Aflatoxin Contamination of Various Carbohydrate Rich
Foods, Legumes, and Vegetables, and Implications of
Targeted Processing Techniques
Ifeanacho, M.O.
1, Agomuo E.N.
2, Amadi, P.U.
1,*1Department of Biochemistry, University of Port Harcourt, Choba Rivers State, Nigeria 2Department of Biochemistry, Imo State University Owerri, Nigeria
Copyright©2017 by authors, all rights reserved. Authors agree that this article remains permanently open access under the terms of the Creative Commons Attribution License 4.0 International License
Abstract
This study was carried out to assess the levels of the metabolites of Aspergillus flavus; aflatoxin B1 (AFB1), aflatoxin B2 (AFB2), aflatoxin G1 (AFG1), and aflatoxin G2 (AFG2) in various food samples. Corn (24.00 µg/kg), millet (4.13 µg/kg), and cassava (3.88 µg/kg) contained the highest AFB1, while AFB2, AFG1, and AFG2 occurred highest in corn and yam. After processing, cassava and yam recorded the highest percentage of AFB1 and AFB2 reduction respectively, while the decontamination of AFG1 was jointly most effective after wheat and millet processing, and AFG2 reduced most after wheat, cassava, and millet processing. The occurrence of AFB1 in the legumes, followed the order; beans > breadfruit > groundnut > melon > oil bean and for AFB2 and AFG2 levels, breadfruit > melon > oil beans > beans, while AFG1 occurred highest in breadfruit, groundnut and oil beans. Ugba (6.26 µg/kg), Ogiri (10 µg/kg), and beans flour (14.62 µg/kg) had the least total aflatoxin contents of the legumes evaluated. Egusi, beans and oil bean recorded over 80% AFB1 and AFG1 reduction, while processing of groundnut and breadfruit, and breadfruit and melon produced the highest percentage of AFB2 and AFG2 respectively. The result for the vegetables showed least contamination of AFB1 in nchuanwu and bitter leaf, while the occurrence of AFB2, AFG1, and AFG2 in nchuanwu and bitter leaf occurred below detection levels. Blanched nchuanwu and bitter leaves had 100% AFB1 reduction, while the percentage reductions of AFB2 in oha and curry leaves, AFG1 in oha, and AFG2 in pumpkin leaves were 100%. This study has shown the presence of aflatoxins in the foods beyond permissible limits, as well as the effectiveness of milling, fermentation and blanching in reducing aflatoxins from carbohydrate rich foods, proteins, and vegetables respectively.
Keywords
Legumes Aflatoxins, Vegetables Aflatoxin, Aflatoxin Alterations by Fermentation, Aflatoxins Reduction by Frying1. Introduction
of the food when the levels of toxins occur beyond the permissible limits (Williams et al., 2004). Consequently, residents of aflatoxin-endemic countries subjected to high aflatoxin exposure have shown increased incidence of liver diseases especially cirrhosis (Egal et al., 2005; Ezekiel et al., 2014) neural tube defects (Umoh et al., 2011) and other adverse effects on biological systems. Hence, as a result of these harmful effects of aflatoxins, most investigations are thus tailored towards the prevention of aflatoxin formation. Preventive policies like good manufacturing and agricultural practices especially during storage are regarded most effective for the reduction of aflatoxin levels in foods. Further, with the knowledge that prevention of aflatoxins contamination is not feasible, various methods of decontamination have received attention, targeted at attenuating the uptake of aflatoxins from the food chain (Jalili et al., 2010). These decontamination methods mainly applied during food processing include cleaning, sorting, drying, heating, milling, and application of yeast, bacteria, and non-toxigenic Aspergillus strains (Jalili et al., 2010). Cleaning (Jard et al., 2011) (when mycotoxin contamination is heterogenous) and washing (Hwang, 2010) have been reported to achieve the decontamination of aflatoxins up to 40%, while heat treatment (steaming, roasting, boiling, and baking) have recorded up to 50-70% decontamination (Reddy and Rani, 2004) and up to 95% decontamination of AFB1 when roasting is applied (Hussain et al., 2011). From these literature sources, it seems encouraging that the application of various processing methods enhances the reduction/elimination of aflatoxins from agricultural products. It is therefore on this foregoing that this study was carried out to determine the aflatoxin levels of various widely consumed food stuffs, as well as evaluate the degree of decontamination achieved by various processing methods.
2. Materials and Methods
2.1. Sample Preparation
The raw food samples; yam tuber, wheat, cassava tuber, millet, corn, breadfruit, groundnut, melon seeds, Oil bean, and beans and their respective processed forms; yam flour, wheat flour, garri, millet flour, corn flour, roasted breadfruit and groundnut, Ogiri, Ugba, and beans flour were purchased from Ekeonunwa Market in Owerri Imo State, and identified at the Department of Plant Science and Biotechnology Imo State University Owerri Imo State Nigeria. The leafy vegetables; pumkin leaves (Telfairia occidentalis), oha (Pterocarpus mildbraedii), nchuanwu (Occimum gratissimum), curry (Murraya koenigii), and bitter leaf (Vernonia amygdalina) were purchased from Ekeonunwa Market in Owerri Imo State Nigeria. The vegetables were processed by blanching; immersing in boiling water for 5 minutes.
2.2. Determination of Aflatoxin Concentration 2.2.1. Extraction
The method of Hell et al., (2009) was applied for the extraction of aflatoxins from the food and vegetable samples. Precisely, 10g of the samples was mixed thoroughly with 50ml CH3OH/H20 (85:15 v/v) and allowed to blend for 5 min before being filtered using a filter paper. The filtrate (40ml) was mixed with 40ml of 10% NaCl. The mixture was defatted in a separation funnel using 25ml n-hexane, and discarded, leaving the aqueous layer. The aqueous layer was partitioned twice using chloroform, which was pooled and dried over anhydrous Na2SO4. The chloroform was then evaporated off on a rotary evaporator and the residue transferred to an amber vial with 2×0.5 ml of chloroform which was evaporated off under vacuum to near dryness and
stored at −20 °C until analyzed. The residue was redissolved
in 200 μl acetonitrile: water:acetic acid (10:50:40 v/v/v) for
high pressure liquid chromatography (HPLC). 2.2.2. Quantitative Analysis of Aflatoxins
Aflatoxins were analyzed on Agilent Technologies 1200 series HPLC with UV detection as described by Makun et al., (2012) at wavelength of 365nm. The octadecylsilyl group
(ODS) column, 4.6mm x 150mm x 5μm was used at ambient
temperature of 25oC. Acetonitrile: water and acetic acid in ratio 10:50:40 v/v/v respectively was used as mobile phase at flow rate of 0.8ml/min. The injection volume was 20 μl.
Identification of aflatoxins (B1, B2, G1, and G2) in each sample was achieved by comparison with retention times of standard peaks. A series of each aflatoxin standards were used to construct a calibration curve. The equation obtained from the calibration curve was used to calculate the concentration of aflatoxins in each sample.
2.3. Statistical Analysis
Data was expressed as mean ± SD of triplicate determinations. The data were analyzed by using Student’s T-test of the Statistical Packages for Science and Social Science (SPSS). p values < 0.05 were considered as significant.
3. Results and Discussion
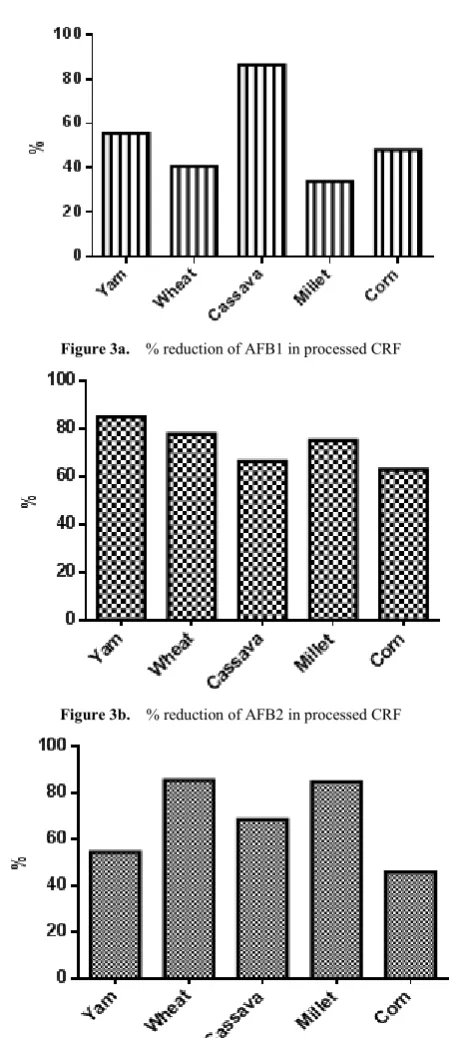
presented in this study for yam. Among the commonly encountered aflatoxin, aflatoxin B1 is regarded as the most toxic due to its contribution to hepatocellular carcinoma (HCC) in animals, and twice as potent as carcinogens like an equitoxic dose of X-rays (Ilic et al., 2010). Chen et al., (2010) posited that, aflatoxin B1 is a known mutagen, while its immunosuppressive (Meissonnier et al., 2008) and teratogenic (Geissler and Faustman, 1988) activities have been reported. Also, Yang et al., (2012) have mentioned the hepatotoxic effect and disruption of oxidative stress markers of foods contaminated with Aflatoxin B2. The aflatoxin G1 and G2 contents of the raw and processed carbohydrates shown in Table 1 indicated that with the exception of corn and cassava, the application of the distinct processing methods were effective in the reduction of these aflatoxins. Some studies have reported the resistance of aflatoxins especially aflatoxin G2, to various forms of processing, especially with applications of heat (Proctor et al., 2005; Pratiwi et al., 2015). Corn, yam, and cassava contained the
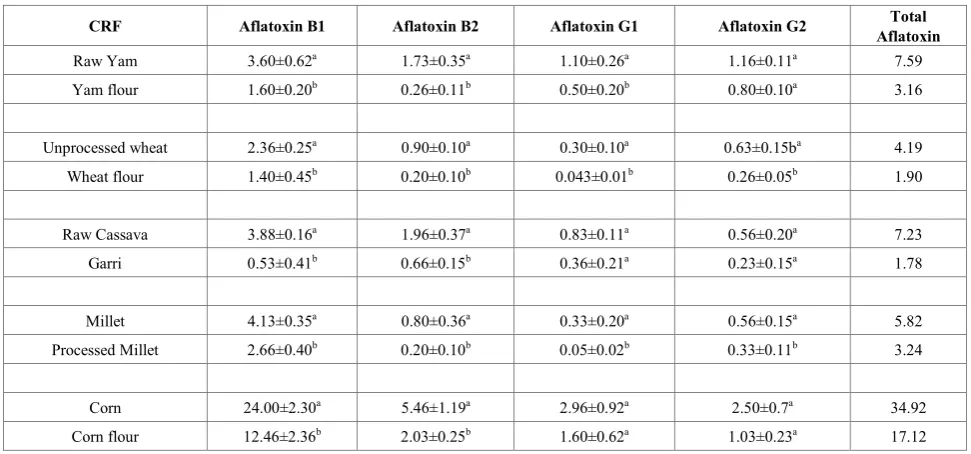
highest amount of aflatoxin G1 and G2 while wheat and millet contained the least aflatoxin G1 and G2 contents. Corn and corn flour contained the highest total aflatoxin contents while unprocessed yam and cassava contained a similar amount of total aflatoxin contamination (Table 1). In line with the findings of this study, Mokoena et al., (2006) have reported the high susceptibility of Maize and maize products to fungi contamination, especially with those producing metabolites like. In addition, the processed forms of wheat and cassava had comparable total aflatoxin contents, while the aflatoxin content of the processed yam was comparable to that of millet (Table 1). From these findings, only the aflatoxin content of the unprocessed corn exceeded the regulatory limit of 20ppb, recommended by USFDA for agricultural commodities. The results presented for the total aflatoxin content of corn, was slightly higher than those presented by Opadokun and Ikeorah (1989), and Arowora et al. (2012), however, Arowora et al., (2012) recognized that maize is highly susceptible to aflatoxin contamination. Table 1. Aflatoxin contamination (µg/kg) of raw and processed carbohydrate-rich foods (CRF)
CRF Aflatoxin B1 Aflatoxin B2 Aflatoxin G1 Aflatoxin G2 Aflatoxin Total
Raw Yam 3.60±0.62a 1.73±0.35a 1.10±0.26a 1.16±0.11a 7.59 Yam flour 1.60±0.20b 0.26±0.11b 0.50±0.20b 0.80±0.10a 3.16
Unprocessed wheat 2.36±0.25a 0.90±0.10a 0.30±0.10a 0.63±0.15ba 4.19 Wheat flour 1.40±0.45b 0.20±0.10b 0.043±0.01b 0.26±0.05b 1.90
Raw Cassava 3.88±0.16a 1.96±0.37a 0.83±0.11a 0.56±0.20a 7.23 Garri 0.53±0.41b 0.66±0.15b 0.36±0.21a 0.23±0.15a 1.78
Millet 4.13±0.35a 0.80±0.36a 0.33±0.20a 0.56±0.15a 5.82 Processed Millet 2.66±0.40b 0.20±0.10b 0.05±0.02b 0.33±0.11b 3.24
[image:3.595.62.548.328.555.2]Figure 3a. % reduction of AFB1 in processed CRF
Figure 3b. % reduction of AFB2 in processed CRF
Figure 3c. % reduction of AFG1 in processed CRF
Figure 3d. % reduction of AFG2 in processed CRF
[image:4.595.330.534.78.233.2]Table 2. Aflatoxin contamination (µg/kg) of raw and processed legumes
Grains Aflatoxin B1 Aflatoxin B2 Aflatoxin G1 Aflatoxin G2 Total Aflatoxin
Breadfruit 43.63±4.97a 11.83±1.87a 3.76±0.65a 5.30±0.30a 64.52 Roasted breadfruit 13.50±1.86b 5.60±2.23bb 0.80±0.20b 0.33±0.25b 20.23 Melon 27.36±1.91a 6.26±0.75a 0.80±0.30 3.10±0.35a 37.52 ogiri 6.91±0.43b 4.08±0.16bb BDL 1.53±0.20b 12.52 Groundnut 41.43±3.46a 4.50±1.64ba 2.50±0.10a BDL 48.43 Roasted Groundnut 23.50±3.80b 1.96±0.40b 0.26±0.11b BDL 25.72 Beans 67.60±8.92a 2.50±0.46a 0.93±0.15a 1.00±0.26a 72.03 Beans Flour 12.46±1.98b 1.43±0.45a 0.13±0.06b 0.60±0.26a 14.62 Oil Bean 16.30±2.80a 4.10±0.30a 1.63±0.15 2.26±0.81a 24.29
Ugba 2.52±0.71b 2.77±0.28b BDL 2.04±0.44a 7.33
Values are means ± S.D of triplicate determinations. For each food type, values bearing different superscript letter(s) (a-b) down the column, are significantly different (p < 0.05).
The aflatoxin contents of some selected legumes are shown in Table 2. Among the analyzed legumes, beans, breadfruit and groundnut contained the highest amount of aflatoxin B1, while oilbean and melon had the lowest contamination of the aflatoxin. The result also indicated that the applied processing techniques significantly reduced the aflatoxin content of the food samples after processing. The aflatoxin B1 content of soybean (47.9 ppb) recorded by Pratiwi et al., (2015) was comparable with those for breadfruit and groundnut presented in this study. Similarly, the aflatoxin B1 content of breadfruit shown in this study was comparable to that reported elsewhere by Odoemelam and Osu, (2009) whereas that of groundnut presented in this study was lower than their findings. Some authors have also demonstrated the influence of environmental factors being contributory to the variations in aflatoxin B1 contamination using similar samples. For instance, the aflatoxin B1 content of groundnut samples in Senegal (Park and Njapau, 1989) was higher than that of this study, as well as those reported for India (Singh et al., 1982) and Bangladesh (Akano and Atanda, 1992). The International Agency for Research on Cancer (IARC), according to Seo et al., (2011) regards Aflatoxin B1 as group 1 human carcinogen, and with the level of occurrence in most of the food samples evaluated in this study, the consumption of those legumes having elevated amounts of Aflatoxin B1, puts the consumers at risk. The result presented in Table 2 showed a lower occurrence of AFB2 on these legumes when compared to the occurrence of AFB1, and in addition, showed that processing methods for beans was ineffective in reducing the AFB2 content. Guchi, (2015) have implicated beans as susceptible to aflatoxin contamination. Furthermore, the amount of AFB2 in both processed and unprocessed melon in this study was higher than those reported by Fapohunda et al., (2014). Breadfruit, groundnut, and oil bean were the most contaminated by AFG1, but for AFG2, breadfruit, melon, and oil bean contained the highest amounts (Table 2), while no detectable amount of AFG2 was recorded for groundnut. Except for beans and oil beans, the AFG2 content of all other legumes in
this study were significantly lowered after processing, while the result for AFG1 indicated that all the legumes assessed had significantly lowered AFG1 contents after processing, with total obliteration of AFG1 obtained for melon and oil bean as a result of processing. All the unprocessed forms of these legumes evaluated in this study for total aflatoxin, exceeded the permissible limits in food samples, however, it was shown that the processing of melon, beans, and oil bean, lowered the aflatoxin contamination within the permissible limit. The high levels of aflatoxins in these legumes may be related to the agricultural practices and other factors having profound influence on aflatoxin contamination such as drying methods (Atukwase et al., 2009), storage duration (Orsi et al., 2000), insect infestation (Udoh et al., 2000), and climatic conditions (Milani, 2013). The contamination of these widely consumed foods used both for human consumption and for animal feeds is a crucial issue for farmers because of both the acute and chronic implications in animals. In an economic sense for animals, Upadhaya et al., (2010) envisaged such implications as reduction in productivity, as well as damage of vital organs.
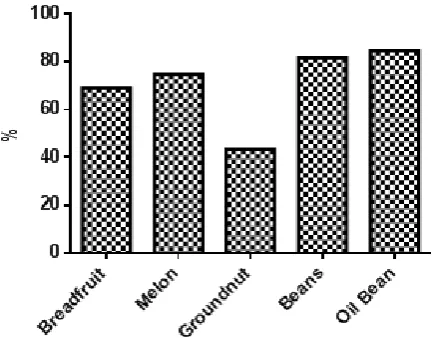
[image:5.595.322.539.545.714.2]Figure 4b. % reduction of AFB2 after the processing of legumes
Figure 4c. % reduction of AFG1 after the processing of legumes
Figure 4d. % reduction of AFG2 after the processing of legumes
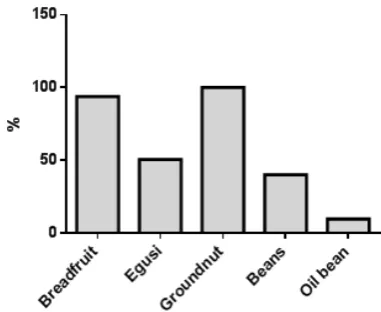
Fig. 4a-d shows the effect of processing on aflatoxin contaminations in selected legumes. In Fig 4a, egusi and oil bean recorded about 74.74 and 84.53% respective reduction in AFB1 contamination after processing. This implies that aside from factors related to the composition of the food material being investigated, the predominant processing method applied for egusi and oilbean (soaking and fermentation) is generally more effective in AFB1 decontamination, than those for breadfruit and groundnut (frying), but comparable to that for beans (sorting and
[image:6.595.87.273.265.416.2]milling). Processed egusi generally known in Eastern Nigeria as “ogiri” and oilbean as “ugba” are fermented products, thus showing more emphasis on the effects of fermentation on AFB1 contamination. Many authors have discussed the effects fermentation on the aflatoxin contents of fermented products (Wiseman and Marth 1981; Gourama and Bullerman, 1995; Oluwafemi and Ikeowa, 2008; Assohoun et al., 2013). El-Nezami et al., (1998) and Haskard et al., (2001) clearly showed the effectiveness of lactic acid bacteria during fermentation in the removal of AFB1 which was in line with the findings of this present study. Oluwafemi and Ikeowa, (2008) and Assohoun et al., (2013) observed that the significantly decreased production of aflatoxins after soaking and fermentation with corresponding reduction in pH, was as a result of the inhibition of the growth of food poisoning or spoiling microorganisms whereas other researchers believe these toxins are rather removed by the non covalent binding of the lactic acid bacteria cell wall (Zhang and Ohta, 1991). Fig. 4b indicates that AFB2 is more effectively reduced by frying as seen in the case of groundnut and breadfruit compared to the processing method of egusi and oil bean. Further, Fig 4c shows a 100% decontamination of AFG1 on application of fermentation procedures on egusi and oil bean, which was greater than the 50% reduction shown by Oluwafemi and Ikeowa, (2008). AFG2 as shown in Fig. 4d was most effectively reduced during the processing of breadfruit, while that of beans and oilbean contributed the least. This may imply that frying leguminous food products may be a more effective method of reducing AFG2 content, than milling and fermentation.
[image:6.595.81.272.439.595.2]Table 3. Aflatoxin contamination (µg/kg) of raw and blanched vegetables
Vegetables Aflatoxin B1 Aflatoxin B2 Aflatoxin G1 Aflatoxin G2 Total Aflatoxin Pumpkin leaves (PL) 6.70±1.60a 3.30±0.52a 0.96±0.11a 0.76±0.21 11.72
Blanched (PL) 5.96±1.60a 1.53±0.40b 0.26±0.21b BDL 7.75 Oha Leaves (OL) 3.76±0.49a 0.53±0.25 0.23±0.15 0.33±0.15a 4.85
Blanched OL 2.03±0.15b BDL BDL 0.13±0.06b 2.16
Nchuanwu Leaves (NL) 0.20±0.10 BDL BDL BDL 0.20
Blanched NL BDL BDL BDL BDL BDL
Curry leaves (CL) 1.36±0.50a 0.20±0.10 BDL BDL 1.56
Blanched CL 0.20±0.10b BDL BDL BDL 0.20
Bitter Leaf (BL) 0.40±0.20a BDL BDL BDL 0.40
Blanched BL BDL BDL BDL BDL BDL
Values are means ± S.D of triplicate determinations. For each vegetable type, values bearing different superscript letter(s) (a-b) down the column, are significantly different (p < 0.05).
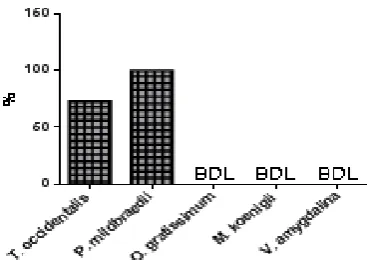
Figure 5a. % reduction of AFB1 after blanching of vegetables
Figure 5b. % reduction of AFB2 after blanching of vegetables BDL means Below Detection Levels
Figure 5c. % reduction of AFG2 after blanching of vegetables BDL means Below Detection Levels
Figure 5d. % reduction of AFG2 after blanching of vegetables BDL means Below Detection Levels
The reducing effect of blanching on AFB1, AFB2, AFG1, and AFG2 is shown in Fig. 5a-d. Fig. 5a shows that blanching produce the least reducing effect on the AFB1 content of T. occidentalis (pumpkin leaves), followed by P. mildbraedii (Oha leaves), while after blanching the AFB1 present in raw samples of O. gratissimum (nchuanwu) and V. amygdalina (bitter leaf) were destroyed beyond detection. Further, the results show the effectiveness of blanching in removal of AFB2 from P. mildbraedii and M. koenigee (Fig.5b), while AFG1 and AFG2 were completely removed from P. mildbraedii (Fig. 5c) and T. occidentalis (Fig. 5d) respectively. These vegetables are widely consumed vegetables, and the presence of aflatoxins necessitates nadequate processing before consumption. Therefore, with the effectiveness of blanching in reduction or complete destruction of aflatoxins shown in this study, it is imperative to subject these vegetables to blanching prior to consumption.
4. Conclusions
[image:7.595.63.553.90.215.2] [image:7.595.87.275.253.382.2] [image:7.595.330.537.255.391.2] [image:7.595.84.278.411.555.2] [image:7.595.89.273.598.728.2]higher aflatoxin reducing effect on the legumes. With this, there is an urgent need to sensitize the public on the high aflatoxin content of these agricultural products, as well as providing information on the effective processing method suitable for the reduction/removal of aflatoxins in each food product.
Conflict of Interest
The authors declare no conflict of interest regarding the publication of this article.
REFERENCES
[1] Abbas, H.K., Reddy, K.R.N., Salleh, B., Saad, B., Abel, C.A. and Shier, W.T. (2010). An overview of mycotoxin contamination in foods and its implications for human health. Toxin Review 29: 3-26.
[2] Akano, D.A. and Atanda, O.O. (1990). The present Level of Aflatoxin in Nigeria Groundnut Cake (‘Kulikuli’). Letters in Aplied. Microbiology. 10: 187-18.
[3] Anne, I.P., Ngozi O.K., Serah O.A., Njideka E.N., Chioma, N.E., Williams, O.M. (2016). Effect of Wrapping Materials on Physico-chemical and Microbiological Qualities of Fermented Melon Seed (Citrullus colocynthis L.) Used as Condiment, American Journal of Food Science and Technology 4(1), pp 14-19. doi: 10.12691/ajfst-4-1-3
[4] Arowora. K.A., Abiodun, A.A., Adetunji, C.O., Sanu, F.T., Afolayan, S.S. and Ogundele, B.A. (2012). Levels of Aflatoxins in Some Agricultural Commodities Sold at Baboko Market in Ilorin. Nigeria Global
[5] Assohoun, C.N., Théodore, N.D., Koussémon-Camara, M., Kouakou, B. (2013) Effect of Fermentation Process on Nutritional Composition and Aflatoxins Concentration of Doklu, a Fermented Maize Based Food. Food and Nutrition Sciences, 4, 1120-1127
[6] Atukwase, A, Kaaya, A.N. and Muyanja, C. (2009). Factors associated with fumonisin contamination of maize in Uganda. J. Sci. Food Agr. 89: 2393–2398.
[7] Bankole, S.A. and Adebanjo, A. (2003). Aflatoxin contamination of dried yam chips marketed in Nigeria. Tropical Science 43: 201 – 203
[8] Chen T., Heflich R.H., Moore, M.M. and Mei, N. (2010) Differential mutagenicity of aflatoxin B1 in the liver of neonatal and adult mice. Environ Mol Mutagen. 51(2):156-63. doi: 10.1002/em.20518.
[9] Chikezie P. C. Ojiako, O.A. (2013). Cyanide and Aflatoxin Loads of Processed Cassava (Manihot esculenta) Tubers (Garri) in Njaba, Imo State, Nigeria, Toxicol Int. 20(3): 261–267. doi: 10.4103/0971-6580.121679 PMCID: PMC3877494
[10]Cornea, C.P., Ciuca, M., Voaides, C., Gagiu, V. and Pop, A. (2011). Incidence of fungal contamination in a Romanian bakery: a molecular approach. Romanian Biotechnological
Letters 16: 5863-5871.
[11]Egal, S., Hounsa, A., Gong, Y.Y., Turner, P.C., Wild, C.P., Hall, A.J., Hell, K. and Cardwell, K.F. (2005). Dietary exposure to aflatoxin from maize and groundnut in young children from Benin and Togo, West Africa. International Journal of Food Microbiology, 104:215–224.
[12]el-Nezami, H. Kankaanpaa, P. Salminen, S. and Ahokas, J. (1998) “Physicochemical Alterations Enhance the Ability of Dairy Strains of Lactic Acid Bacteria to Remove Afla- toxin from Contaminated Media,” Journal of Food Protection, 61(4), pp. 466-468.
[13]Ezekiel, C.N., Warth, B., Ogara, I.M., Abia, W.A., Ezekiel, V.C., Atehnkeng, J., Sulyok, M., Turner, P.C., Tayo, G.O., Krska, R. and Bandyopadhyay, R. (2014). Mycotoxin exposure in rural residents in northern Nigeria: a pilot study using multi-urinary biomarkers. Environment International, 66: 138-145.
[14]Fapohunda, S.O (2011).Impact of Mycotoxins on Sub-Saharan Africa: Nigeria as a Case Study. European Mycotoxin Awareness Network Retrieved on 7th July, 2011 from http://www.services.leatherheadfood.com/mycotoxins/index.a sp
[15]Geissler, F. and Faustman, E.M. (1988). Developmental toxicity of aflatoxin B1 in the rodent embryo in vitro: contribution of exogenous biotransformation systems to toxicity. Teratology. 37(2):101-11.
[16]Gourama, H. and Bullerman, L.B. (1995) “Detection ofmolds in foods and feeds: potential rapid and selective methods,” Journal of Food Protection, vol. 58, no. 12, pp. 1389–1394. [17]Guchi, E. (2015) “Implication of Aflatoxin Contamination in
Agricultural Products.” American Journal of Food and Nutrition, 3(1): 12-20. doi: 10.12691/ajfn-3-1-3.
[18]Haskard, C.A., El-Nezami, H.S., Kankaanpaa, P.E., Salminen, S. and Ahokas, J.T. (2001). Surface binding of aflatoxin B1 by lactic acid bacteria. Appl. Environ. Microbiol. 67(7), 3086-91. [19]Hell, K., Gnonlonfin, .G.J., Kodjogbe, G., Lamboni, Y. and Abdourhamane, I.K. (2009). Mycoflora and occurrence of aflatoxin in dried vegetables in Benin, Mali and Togo, West Africa International Journal of Food Microbiology 135, 99–104
[20]Hussain, A., Ali, J. and Akther, S. (2011) Degradation of aflatoxins by roasting in contaminated peanuts. Pak. J. Biochem. Mol. Biol.; 44(2): 56-59.
[21]Hwang, J.H. and Lee, K.G. (2006). Reduction of aflatoxin B1 contamination in wheat by various cooking treatments. Food Chem. 98(1): 71–75.
[22]Idris, Y.M.A., Mariod, A.A., Elnour, I.A. and Mohamed, A.A. (2010). Determination of aflatoxin levels in Sudanese edible oils. Food and Chemical Toxicology 48: 2539-2541.
[23]Ilic, Z., Crawford, D. Egner, P. and Sell, S. (2010). Glutathione-S-transferase A3 knockout mice are sensitive to acute cytotoxic and genotoxic effects of aflatoxin B1. Toxicol. and Applied Pharmacol., 242: 241–246
[25]Jard, G., Liboz, T., Mathieu, F., Guyonvarch’h, A. and Lebrihi, A. (2011) Review of mycotoxin reduction in food and feed: from prevention in the field to detoxification by adsorption or transformation. Food Addit. Contamination Part A. Chem. Anal. Exposure Risk Assessment. 28(11): 1590-09.
[26]Journal of Science Frontier Research Agriculture and
Veterinary Sciences Volume 12(10), 31-34
[27]Kumar, V., Basu, M.S. and Rajendran, T.P. (2008). Mycotoxin research and mycoflora in some commercially important agricultural commodities. Crop Protection 27: 891-905. [28]Makun, H.A., Dutton, M.F., Njobeh, P.B., Gbodi, T.A. and
Ogbadu, G.H. (2012). Aflatoxin Contamination in Foods and Feeds: A Special Focus on Africa In: Prof. Ayman Amer Eissa (Ed.) ‘Trends in Vital Food and Control Engineering’ ISBN: 978-953-51-0449-0, InTech, retrieved on 31st July, 2012 from: http://www.intechopen.com/books/trends-invital-
food-and-control-engineering/aflatoxin-contamination-in-foo dsand- feeds-a-special-focus-on-africa-
[29]Meissonnier, G., Pinton, P. Laffitte, J., Cossalter, A.M., Gong, Y.Y., Wild, C.P., Bertin, G. Galtier, P. and I.P. Oswald (2008). Immunotoxicity of aflatoxin B1: Impairment of the cell-mediated response to vaccine antigen and modulation of cytokine expression. Toxicol. Appl. Pharmacol. 231: 142- 149.
[30]Milani, J.M. (2013). Ecological conditions affecting mycotoxin production in cereals: a review. Veterinarni Medicina 58(8):405-411.
[31]Mokoena, M. P. Chelule, P. K. and Gqaleni, N. (2006) “The Toxicity and Decreased Concentration of Aflatoxin B1 in Natural Lactic Acid Fermented Maize Meal,” Journal of
Applied Microbiology, 100 (4), pp. 773- 777.
http://dx.doi.org/10.1111/j.1365-2672.2006.02881.x
[32]Murugan, K., Anandaraj, K. and Al-Sohaibani, S. (2013). Antiaflatoxigenic food additive potential of Murraya koenigii: An in vitro and molecular interaction study. Food Res. Int. 52(1):8-16.
[33]Neveen H.A., Mohamed, D., El-Kassem, L.A. and Khalil, M. (2015) Chemical Composition and Antifungal Activity of Ocimum basilicum L. Essential Oil Open Access Maced J Med Sci. 3(3): 374–379. doi: 10.3889/oamjms.2015.082 [34]Odoemelam, S. A. and Osu, C. I. (2009). Aflatoxin B(1)
Contamination of Some Edible Grains Marketed in Nigeria. E-Journal of Chemistry 6: 308-314.
[35]Odunfa, S.A. and Oyeyiola, G.F. (1985). Microbiological study of the fermentation of ugba- a Nigerian indigenous fermented food flavour. J. Plant Foods 6: 155-163
[36]Oluwafemi, F. and Ikeowa, M.C. (2008) Length of Fermentation and Detection Methods of Aflatoxin B1 During Fermentation of Maize into “Ogi”. Nigerian Journal of Microbiology, 22(1): 1698 – 1703
[37]Opadokun, J.S. and Ikeorah, J.N. (1989). Moisture and aflatoxin contentsof white maize samples from Apomu market. Nig. Stored Products Research Inst., 21st Annual Report, pp 6-12.
[38]Orsi, R.B., Corrêa, B., Possi, C.R., Schammass, E.A., Nogueira, J.R., Dias, S.M.C. and Malozzi, M.A.B. (2000). Mycroflora and occurrence of fumonisins in freshly harvested and stored hybrid maize. J Stored Prod Res. 36: 75-87. [39]Park, D.L. and Njapau, H. (1989) Contamination issues and
padding. J Am Oil Chem Soc 66, 1402–1405.
[40]Pratiwi, C., Rahayu, W. P., Lioe, H. N., Herawati, D., Broto, W. and Ambarwati, S. (2015) The effect of temperature and relative humidity for Aspergillus flavus BIO 2237 growth and aflatoxin production on soybeans International Food Research Journal 22(1): 82-87
[41]Proctor, A. D., Ahmedna, M., Kumar, J. V. and Goktepe, I. (2004). Degradation of aflatoxins in peanut kernels/flour by gaseous ozonation and mild heat treatment. Food Additives and Contaminants, 21, 786-793.
http://dx.doi.org/10.1080/02652030410001713898
[42]Rajarajan, P. N. Rajasekaran, K.M. Asha D.N.K. (2013) Aflatoxin Contamination in Agricultural Commodities. Indian J. Pharm. Biol. Res.; 1(4):148-151.
[43]Reddy, U.M. and Rani, P.C. (2004). Effect of processing on detoxification of aflatoxins in maize. Indian J. Nutr. Diet. 43(1): 54-59.
[44]Seo, J. H., Min, W. K., Kweon, D. H., Park, K. and Park, Y. C. (2011). Characterisation of monoclonal antibody against aflatoxin B1 produced in hybridoma 2C12 and its single-chain variable fragment expressed in recombinant Escherichia coli. Food Chemistry 126: 1316-1323.
[45]Umoh, N. J., Lesi, O. A., Mendy, M., Bah, E., Akano, A., Whittle, H., Hainaut, P. and Kirk, G. D. (2011). Aetiological differences in demographical, clinical and pathological characteristics of hepatocellular carcinoma in The Gambia. Liver International 31: 215-221.
[46]Upadhaya, S.D. Park, M.A. and Ha, J.K. (2010) Mycotoxins and Their Biotransformation in the Rumen: A Review Asian-Aust. J. Anim. Sci. 23(9), 1250 - 1260
[47]Williams, J.H., Phillips, T.D., Jolly, P.E., Stiles, J.K., Jolly, C.M. and Aggarwal, D. (2004). Human aflatoxicosis in developing countries: a review of toxicology, exposure, potential health consequences, and interventions. American Journal of Clinical Nutrition; 80:1106–1122.
[48]Wiseman, D.W. and Marth, E.H. (1981). Growth and aflatoxin production by Aspergillus parasiticus when in the presence of
Streptococcus lactis. Mycopathol. 73: 49-56.
[49]Yang, X., Lua, H., Li, Z. (2012) Cytochrome P450 2A13 mediates aflatoxin B1-induced cytotoxicity and apoptosis in human bronchial epithelial cells. Toxicology; 300: 138–48. [50]Yeap, S.K. Ho, W.Y. Beh, B.K. Liang, W.S. Ky, H. Yousr,
A.H.N. and Alitheen, N.B. (2010) Vernonia amygdalina, an ethnoveterinary and ethnomedical used green vegetable with multiple bioactivities Journal of Medicinal Plants Research, 4(25), pp. 2787-2812.