Decentralisation: a One-to-many
Relationship. The Case of Greece
Photis, Yorgos N. and Koutsopoulos, Kostis
University of Thessaly, Department of Planning Regional
Development, National Technical University
1996
Online at
https://mpra.ub.uni-muenchen.de/20723/
The Case of Greece
by Yorgos N. Photis and Kostis C. Koutsopoulos
1. Introduction
There is no doubt that even a cursory examination of the indisputable efforts for decentralisation in Greece, will reveal that the main problem lies within the ever-expanding bureaucratic labyrinth of its political decision making processes and the underlying political and administrative system that generates and supports them. In sort, this political system, seems to strive for inclusiveness and broad acceptance, rather than theoretical consistency or elegance, setting the government incapable to play a truly co-ordinating role and exhibit the administrative wisdom that it implies (Ashford 1983). Seeking in this respect, to accommodate new demands as they emerge by means, insofar as possible, that leave previous arrangements (programmes and administrative regulations) undisturbed, which in turn involve the least possible disruption for public enterprises, as well as the least possible inconvenience and annoyance for institutions and individuals alike, who have built their life-styles around the expectation of system stability.
However, in terms of its administrative system, Greece has the same characteristics and problems with most of the Mediterranean European Countries. Consequently, the potential of future decentralisation policies in a regional level, as they are expressed by either the elimination of regional disparities or the formulation of regional restructuring strategies, should be seen with respect to the extended political framework within which they have to be implemented. Namely, the Mediterranean frontier.
Within this framework, this paper reviews the historical course and critically presents the results of the proclaimed decentralization efforts in Greece. Specifically, certain political and socio-economic indicators are utilised, in order both to micro-evaluate the regional disparities within the country and to generate a parallel macro-comparison with the other Mediterranean Member States of the European Union.
2. The Mandates of History
has been urging the government to reduce regional disparities within the country, Greece has not gone a single year without the government attempting to reform the system and the opposition criticising it, the main argument being the overwhelming role of Athens. Inside the community very few countries, with the exception of the neighbouring Mediterranean France and possibly Italy, have experienced so much reform associated with so little change. Consequently and despite the regularity and persistence of this concern and the popularity of the issue, decentralisation still remains invisible.
On the other hand, there is no doubt that the observed increase of administrative centralisation in Greece, should in many respects be granted to the insistence of the central government to determine the conditions within which lower levels of government of both the public and private sectors of the economy have to operate. In this framework, we believe that the following historical review of the five major time periods that distinguish the efforts for decentralisation reforms in Greece (Tritsis et al. 1984), might be both enlightening and convincing.
2.1. First Period: 1821 -1832
Immediately after the liberation of the country from the Ottoman empire there was no time, energy or experience to create a new government organisation. With the formation and imposition of a national government, the power and authority of the central and the local governments were not complementary, but rather competing. On the one hand the central government was operating in a very centralised fashion, while the local governments, remnants of the Turkish occupation, were possessing real power and acted accordingly.
2.2. Second Period: 1833 -1887
By a royal degree (3 April 1833) the country, following the French example, was divided into prefectures and provinces, theoretically creating administrative units with decentralized authority. The practice of the central government, however, as exemplified by a later degree (20/6/1836), clearly reflected the autocratic and highly centralised regime of the Bavarian King, which unfortunately lasted too long.
2.3. Third Period: 1888 -1969
The prefecture system which initiated in 1833 and refined in 1845 (Law KE), was finally put into effect, but only in the form of a simple truncated administrative regionalisation, where the prefecture and its administrator, as part of the ministry and under the minister of Interior, possessed no real administrative or for that matter any other authority.
2.4. Fourth Period: 1970 -1982
In 1970 (Presidential decree 532/1970) the prefecture finally attains full administrative independence and the administrator becomes the real supervisor of its bureaucratic apparatus. But decentralisation stops short of providing real power for political, economic and other important functions of the area, which remain in the hands of the central government, who firmly exercises them.
2.5. Fifth Period: 1983 - Present
However, the division of power remains to be effected and the appropriate decision-making mechanisms by which an operating and truly decentralised administration system will be accomplished have yet to be specified. As a concept, it is indeed a far cry improvement over the existing situation, but as decentralisation reform is still very far from completion. Simply put, the socialists following all the previous governments, have paid lip service to the idea of a true decentralised system, while continued to govern in a very centralised way.
Finally, it should be mentioned that throughout the modern history of Greece all efforts towards a decentralised system suffer from two major drawbacks: First, there was never a complete spherical concept upon which to base any of the innovations, especially with regards to the limits of power-sharing between central and local governments and second, all measures and policies up to now are characterised by spasmodic conception as well as implementation.
3. Characteristics of the Government System
The Greek society, influenced by the historical evolution just described, affected from its own peculiarities and conditions and determined by a highly complex decision making process, confronts a government system that is characterised by the following (Katochianou 1985).
3.1. Centralised System
The Greek system is a highly centralised and strictly hierarchical system, where all initiatives are coming from the top, which is fully occupied by the central government. At the base of the system, the local authorities have only a secondary role, namely to do the things that the central government refuses to do, but insists on determining how to be done. Guidance is also a function of the centre towards the middle level of the organisational pyramid, the prefecture, whose administrator acts simply as agent of the central government. Thus, it is of no surprise that 93% of the budget is controlled by the various ministries in Athens, who are employing the same number of employees as all of the 6.039 communities (cities, towns and villages) of the country.
3.2. Ill-Structured System
The organisational structure of the Greek system differs significantly from what someone might expect from a really decentralised system. In fact, the structural view of a decentralized system should reflect the interplay of two factors, namely autonomy and administrative hierarchy. That is, every echelon of authority should possess the independent presence of the following necessary functions (Koutsopoulos 1989):
— political: giving them the ability to make the appropriate and relevant decisions; — administrative: permitting them to govern independently;
— economic: providing them with the funds and the independence to spend them;
— infrastructure: allowing them the self-reliance to carry out all of the previous functions. Moreover, within a clearly defined hierarchy, the provision of services and the dispensation of each function is exhausted, to the possible degree, at the lower level, so that the hierarchy is determined from the bottom up and autonomy is achieved.
above characteristics, for as we have mentioned the hierarchy is determined from the top, while the lower decision making tiers only possess limited political, independent but not sufficient administrative and inadequate economic functions as well as absolutely insufficient infrastructure (Ministry of Internal Affairs1985).
3.3. Pseudo-Decentralised Administration
The result of all the unending system reforms, is that a pseudo- decentralised administrative structure (regional and local authorities exist, but do not have any power or autonomy) has been created that mainly masks some of the deficiencies of centralisation and provides needed excuses to the politicians for their failure to provide a truly decentralised system, where political, economic and administrative functions can be exercised by the prefectural and local authorities.
3.4. Unadjusted Lower Levels
Greece, by contrast to northern European countries, has not been able to adjust the lower levels of the system (prefectures and communities) that are ill-adapted to the present day requirements of urban and regional development. The Greek prefecture map has not been altered for the last 120 years. Thus, the prefecture of Attiki which approximately has 40% of the Greek population and is allocated 30% of the total amount spend by all prefectures, has the same status than Euritania with less than 0.4% of the population and 0.3% of the allocated funds. Moreover, the local political administrative system seems fossilised in the form it had in the pre-World War I period, despite the urgency of reforms and despite the fact that decentralisation, a policy option of all Greek parties when in opposition, was always forgotten on coming to power.
Summarising, the Greek government system is epitomised by a strong central government, controlling and dominating all regional and local affairs (political, economic and administrative) and depriving subordinate political units of any influence over fiscal, social or any other policies affecting their areas.
4. Decentralisation Aspects
The political system of Greece is something a paradox. On the one hand, its task is to manage an extraordinary dynamic society, which throws up a constant stream of new demands and opportunities. On the other hand, the organisations of the political system itself, such as the governmental bureaucracy, are such as to generate an extreme orientation toward caution. Another way to put this, is to say that the political system in Greece strives to maintain the security of its key institutions and personnel as it responds to outside stimuli. Changes in the system applied by the various political parties in power, vary widely in the strategies that they utilise to pursue such security, and in the priority that they accord it, relative to other key objectives. The result, and the main objectives, however, remain the same and unchanged through time.
4.1. The Decision-Making Process
As a result, in Greece and with respect to decentralisation, the political system strives to accommodate new political demands with minimal disturbance to existing policies, institutional arrangements and individual behaviour patterns. At the same time, it is accustomed to dealing with rapidly evolving conditions and voter priorities. In short, it has certain political maintenance requirements of a conservative nature, but it is oriented as well toward dealing with the radical nature of modern reality. These characteristics result in piecemeal, but constant and relatively adaptive policy accretion. If they impair the clarity and consistency of policy outcomes, they tend also to maximise their broad acceptability. Additionally, they render the system unusually open to innovative ideas that can be injected into the ongoing stream of activities without substantially disrupting entrenched public programmes, private economic interests and personal life-styles. In short, the system does not treat apparent tensions among policy objectives as inescapable sources of conflict; rather it seeks by political means to blur the tensions and by technical means to find ingenious new means of reconciling the objectives.
It follows therefore, that other things being equal, change strategies and policies for decentralisation will vary in political acceptability in accord with the degree to which they inconvenience institutions and powerful politicians-administrators. To this basic proposition we would add as a corollary, that the connection between decentralisation and regional disparities is a key desideratum. It matters a great deal to elected officials to be seen as champions in eradicating regional disparities (a very popular issue), rather than reforming the government (which they avoid), in the same way that powerful institution and individuals preach balanced development, but profit from regional disparities. Yet regional disparities in Greece, with its own peculiarities and conditions, reflect nothing less than the degree of centralisation of the government system. Implying in this respect, that in Greece a balanced development can in no way be achieved outside and without the assistance and support of a truly decentralised system.
Given, therefore, that the problem of regional disparities has been paid lip service by the decision makers, the fact that decentralization improvements (the other side of the same coin) have not been forthcoming, can be of no surprise to anyone. As a result, as long as regional disparities persist, a truly decentralised system cannot be achieved. It is in this line of reasoning that the existence of administrative centralisation in Greece represented by the existence of regional and prefectural inequalities, can be easily illuminated with the empirical evidence presented below.
4.2. A Tale of One Centre
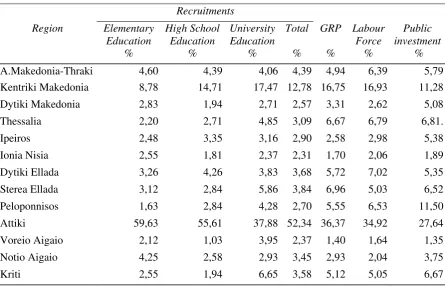
Table 1. Regional indicators in Greece Recruitments
Region Elementary
Education
High School Education
University Education
Total GRP Labour
Force
Public investment
% % % % % % %
A.Makedonia-Thraki 4,60 4,39 4,06 4,39 4,94 6,39 5,79 Kentriki Makedonia 8,78 14,71 17,47 12,78 16,75 16,93 11,28 Dytiki Makedonia 2,83 1,94 2,71 2,57 3,31 2,62 5,08 Thessalia 2,20 2,71 4,85 3,09 6,67 6,79 6,81. Ipeiros 2,48 3,35 3,16 2,90 2,58 2,98 5,38 Ionia Nisia 2,55 1,81 2,37 2,31 1,70 2,06 1,89 Dytiki Ellada 3,26 4,26 3,83 3,68 5,72 7,02 5,35 Sterea Ellada 3,12 2,84 5,86 3,84 6,96 5,03 6,52 Peloponnisos 1,63 2,84 4,28 2,70 5,55 6,53 11,50 Attiki 59,63 55,61 37,88 52,34 36,37 34,92 27,64 Voreio Aigaio 2,12 1,03 3,95 2,37 1,40 1,64 1,35 Notio Aigaio 4,25 2,58 2,93 3,45 2,93 2,04 3,75 Kriti 2,55 1,94 6,65 3,58 5,12 5,05 6,67
The figures in table 1, which are all expressed as the percentage of each region to the total, point out some persistent differentiations. First, there is a significant gap between the prefecture of Attiki and secondary the urbanised prefectures (Attiki, Kentriki Makedonia and Dytiki Ellada) and the rest of the country, underlining the dominant role of Athens and the next two biggest cities of Thessaloniki and Patra. Second, the distribution of every prefecture in each factor (along each column), practically follows the population distribution (Table 2). Any deviation from the expected (due to their population) value simply reflects idiomatic regional circumstances (different capacities to adapt to the trends and calls of the last decades). Third, there are significant fluctuations in the distribution of every factor for each prefecture (along each row). Especially revealing are the differences between the percentages of the civil servants' recruitment and public investments rates, which reflect the actual and the government's perceived spatial needs and priorities respectively. More specifically, the distribution of public investments (publicly debated and available), representing the direct and public intervention of the government, shows expected values (based on each prefecture's population, economic activities etc.). On the other hand, recruitments (seen by politicians as their main instrument to assure votes and consensus) show considerable deviations favouring again Attiki.
Given that Greece is a member of the European Union and the Union's new structural policies recognised in the Maastricht Treaty initialised a new phase, where the elimination of regional disparities and the strengthening of inner regional co-operation and cohesion within each Member State, are outlined as the main objective and an unquestionable prerequisite of every Government's political initiatives; it seems only logical to examine in the next few paragraphs the issues of decentralisation and regional disparities in a broader area and at an international level, that of the Mediterranean Countries of the European Union. This line of reasoning stems from the well established fact that within a community which is gradually moving towards explicit union, wide fluctuations are by no means acceptable, especially when they refer to regions that share common economic and structural characteristics.
5. The Mediterranean Frontier
The verification of the absence or the existence of homogeneity in terms of regional disparities and thus decentralisation, between the Mediterranean Members of the European Union will be presented through the analyses of regional disparities on a different scale and the utilisation of different political and socio-economic factors. More specifically, the aim is to detect the varying degrees of convergence or divergence, in an inter-regional perspective, within and between the Mediterranean countries of the European Union.
Although the comparison of regional endowments raises immense methodological issues, we feel confident that the following five factors reflect and affect the decentralisation process within every Member State. These factors are: employment rate, number of hospital beds, number of dwellings, the services share and number of doctors.
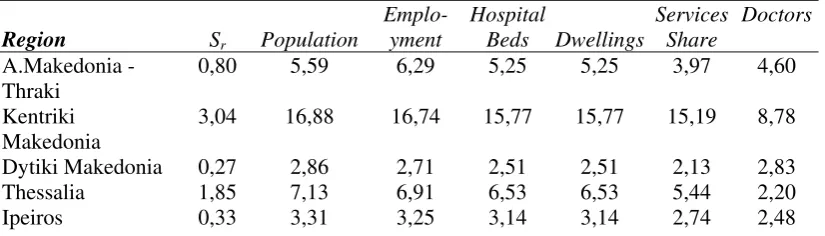
[image:8.595.73.486.659.777.2]The analyses were relatively simple, but it was felt that the two calculated indices were particularly effective in describing the existing situation. More specifically, for every region in each Mediterranean country the standard deviation Sr of the percentages of each region to the country's total was calculated, as a straightforward measure of dispersion. In this framework, values of Sr near zero in effect represent a uniform distribution of all factors in a given region in accordance with the relevant importance of the region. On the other hand, values significantly different from zero, indicate political decision making processes that preserve and encourage regional differentials. As a second indicator, the standard error Sg of the Sr's of each column was calculated to reflect the regional homogeneity within each Mediterranean Member State and effectively represent a decentralisation index. Again, values of this index near zero reflect the existence of inter-regional uniformity, while larger values verify the absence of regional homogeneity.
Table 2. Regional indicators in the Mediterranean Countries
Region Sr Population
Emplo-yment
Hospital
Beds Dwellings
Services Share
Doctors
A.Makedonia - Thraki
0,80 5,59 6,29 5,25 5,25 3,97 4,60
Kentriki Makedonia
3,04 16,88 16,74 15,77 15,77 15,19 8,78
Ionia Nisia 0,30 1,86 2,18 2,16 2,16 1,68 2,55
Dytiki Ellada 1,36 6,83 7,01 6,08 6,08 5,51 3,26 Sterea Ellada 0,99 5,63 4,94 5,25 5,25 3,76 3,12 Peloponnisos 1,93 5,91 5,70 6,58 6,58 4,00 1,63 Attiki 10,13 34,34 35,04 35,47 35,47 46,01 59,63 Voreio Aigaio 0,52 1,94 1,69 2,94 2,94 2,32 2,12 Notio Aigaio 0,72 2,50 2,18 2,99 2,99 3,29 4,25 Kriti 1,15 5,22 5,35 5,33 5,33 3,95 2,55
GREECE SSr = 2,63
Galicia 0,93 7,20 8,19 6,37 6,37 5,64 5,97 Asturias 0,13 2,89 2,84 2,89 2,89 2,60 2,99 Cantabria 0,07 1,35 1,34 1,31 1,31 1,34 1,49 Pais Vasco 0,40 5,46 5,51 4,91 4,91 5,37 5,97 Navarra 0,12 1,34 1,43 1,21 1,21 1,23 1,49 Rioja 0,07 0,67 0,72 0,73 0,73 0,56 0,75 Aragon 0,28 3,11 3,30 3,44 3,44 2,92 3,73 Madrid 1,98 12,52 12,96 11,91 11,91 15,71 16,42 Castilla-Leon 0,55 6,74 6,72 7,53 7,53 6,22 7,46 Castilla-La Mancha 0,74 4,40 4,13 4,89 4,89 3,67 2,99 Extremadura 0,27 2,90 2,36 2,79 2,79 2,78 2,24 Cataluna 1,04 15,42 17,53 16,93 16,93 14,76 16,42 Comunidad
Valenciam
0,98 9,72 10,22 11,55 11,55 9,32 9,70
Baleares 0,29 1,75 1,98 2,22 2,22 2,08 1,49 Andalucia 1,42 17,76 14,43 15,57 15,57 18,05 15,67 Murcia 0,14 2,64 2,62 2,51 2,51 2,47 2,24 Ceuta y Melilla 0,16 0,32 0,25 0,24 0,24 0,50 0,00 Canarias 0,77 3,81 3,48 3,01 3,01 4,95 2,99
ESPANA Ss= 0,53
|Norte 3,63 35,02 36,03 29,72 29,72 27,80 n/a Centre 2,98 17,50 17,75 20,03 20,03 12,74 n/a Lisboa e Vale do
Tejo
4,91 33,53 33,62 34,61 34,61 45,01 n/a
Alentejo 1,11 5,53 4,82 7,28 7,28 5,65 n/a Algarve 0,55 3,43 3,08 4,13 4,13 4,39 n/a Azores 0,25 2,41 2,02 2,21 2,21 2,69 n/a Madeira 0,32 2,57 2,69 2,01 2,01 2,40 n/a
PORTUGAL SSr= l,86
Ile-de-France 2,30 18,84 21,64 18,65 n/a 21,92 24,11 Champagne-
Ardenne
0,16 2,38 2,26 2,31 n/a 1,98 2,13
Poitu-Charentes 0,31 2,81 2,45 2,91 n/a 2,47 2,13 Aquitaine 0,15 4,94 4,62 4,95 n/a 4,80 4,96 Midi-Pyrenees 0,31 4,30 4,39 4,30 n/a 4,19 4,96 Limousin 0,14 1,27 1,26 1,51 n/a 1,16 1,42 Rhone- Alpes 0,22 9,46 9,52 9,46 n/a 8,99 9,22 Auvergne 0,26 2,33 2,19 2,68 n/a 2,01 2,13
Languedoc-Roussillon
0,43 3,75 3,21 4,19 n/a 4,05 4,26
Provence- Alpes-Cote
1,15 7,53 6,92 8,22 n/a 8,73 9,93
d'Azur Corse
0,18 0,44 0,21 0,56 n/a 0,49 0,71
Guadeloupe 0,00 0,0 0,00 0,00 n/a 0,00 0,00 Martinique 0,00 0,00 0,00 0,00 n/a 0,00 0,00 Guyane 0,00 0,00 0,00 0,00 n/a 0,00 0,00 Reunion 0,00 0,00 0,00 0,00 n/a 0,00 0,00
FRANCE SSr = 0,46
Piemonte 1,22 7,62 9,82 9,22 9,22 6,60 7,95
Valle d'Aosta 0,14 0,20 0,28 0,36 0,36 0,22 0,00
Liguria 1,56 3,0 0,00 4,14 4,14 3,66 3,41
Lombardia 2,26 15,60 20,67 15,58 15,58 14,13 15,91
Trentino-Alto Adige
0,30 1,55 2,06 1,65 1,65 1,69 1,14
Veneto 1,21 7,6 9,91 7,11 7,11 6,64 6,82
Friuli-Venezia Giulia
0,91 2,10 0,00 2,27 2,27 2,21 2,27
Emilia-Romagna 1,01 6,86 9,32 7,39 7,39 6,51 6,82
Toscana 0,70 6,23 7,79 6,34 6,34 6,39 5,68
Umbria 0,18 1,44 1,70 1,35 1,35 1,38 1,14
Marche 0,41 2,50 3,32 2,45 2,45 2,19 2,27
Lazio 1,26 9,06 10,62 8,87 8,87 11,50 11,36
Campania 1,32 9,41 9,71 7,35 7,35 10,02 10,23
Abruzzi 0,15 2,22 2,62 2,28 2,28 2,22 2,27
Molise 0,36 0,59 0,00 0,62 0,62 0,55 1,14
Puglia 2,81 7,12 0,00 6,51 6,51 7,27 6,82
Basilicata 0,04 1,09 1,06 1,05 1,05 1,02 1,14
Calabria 1,52 3,76 0,00 3,76 3,76 3,85 3,41
Sicilia 0,69 9,06 8,15 9,19 9,19 9,75 7,95
Sardegna 0,30 2,90 2,97 2,51 2,51 2,99 2,27
ITALIA SSr = 0,75
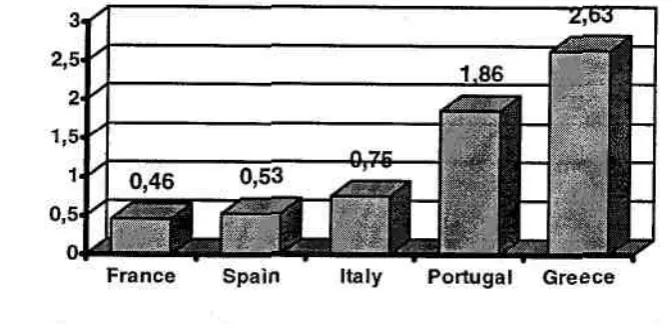
The results of the analyses are shown in Table 2, while the values of the decentralisation index SSr are depicted in Figure 1. The results were expected with the
Foreign Direct Investment over the 1980's. The latter, brought major benefits to the country's national and regional economies and confirmed the fact that Spain is increasingly considered as a favourable candidate for further expenditure on regional incentives. On the other hand, for Greece and Portugal which represent, by far, the worst values of the index, the problem is indeed twofold: To strengthen the weak regions in terms of infrastructure and service provision levels, through the concentration of the available resources to the worst-affected areas and to increase the respective regional expenditures and the emphasis placed on the improvement on inter-regional differences.
Figure1. Decentralisation index in the Mediterranean
6. Conclusions
Although the opponents of the decentralisation task range from\ the ever power-hungry central government politicians, the top civil servants and the local officials satisfied with a system that gives them influence and discharges them from the burden of exercising power, in Greece and in the other Mediterranean Member States, it is the overall political framework within which decision are made, that the traditional centralised systems were strengthened and intensified.
[image:11.595.92.428.243.409.2]References
Ashford G.D., 1983. The Socialist reorganisation of French local government -another Jacobin reform?, Environment and Planning, Vol 1, pp. 29-44.
European Commission, Competitiveness and cohesion: trends in theregions, Fifth periodic report on the social and economic situation and development of the regions in the Community.
Eurostat 1993. Regions, Statistical Yearbook 1993, Theme 1, Statistical office of the European Communities, Bruxelles, Luxembourg.
Katochianou D., 1985. Regional divisions of Greece, Special bulletin, National Technical Chamber of Greece, January, p. 19- 30.
Konsola D., 1988. Decentralisation and Cultural Policy in Greece, Papers of the Regional
Science Association, 64.
Koutsopoulos C.K. and Makris A., 1988. Decentralisation through Regionalization of Greece, paper presented at the Regional Science Association Meeting, Athens.
Koutsopoulos C.K., 1984. Urban System: Politics, Policies and Planning, paper presented at the Seminar of Problems of Urban Planning, MGRCOOP, Cairo.
Koutsopoulos C.K., 1989. Regionalization of Greece, presented at the Conference of
Geography and Public Administration, Washington D.C.
Machin H., 1978. All Jacobins now? The hostility to local government reform, West
European Politics, 1, pp.133-155.
Ministry of Internal Affairs, 1985. Proposal for the administrative Reorganisation of the
nation, Athens.
Statistical office of the European Communities, 1993. Portrait of the Regions, Vol. 2-3. Technical Chamber of Greece, 1985. The New code for local Governments, Athens.
Tritsis A. et al., 1984. Regional Reorganisation of Greece, Report to the Ministry of Internal Affairs of Greece, Athens.