White Rose Research Online URL for this paper: http://eprints.whiterose.ac.uk/129343/
Version: Accepted Version
Article:
Fil, A., Kolemen, E., Ferraro, N. M. et al. (4 more authors) (2017) Modeling of lithium granule injection in NSTX using M3D-C1. Nuclear Fusion. 056040. ISSN 1741-4326
https://doi.org/10.1088/1741-4326/aa66b1
[email protected] https://eprints.whiterose.ac.uk/
Reuse
Items deposited in White Rose Research Online are protected by copyright, with all rights reserved unless indicated otherwise. They may be downloaded and/or printed for private study, or other acts as permitted by national copyright laws. The publisher or other rights holders may allow further reproduction and re-use of the full text version. This is indicated by the licence information on the White Rose Research Online record for the item.
Takedown
If you consider content in White Rose Research Online to be in breach of UK law, please notify us by
Modeling of Lithium Granule Injection in NSTX using
M3D-C1
A. Fil1
, E. Kolemen1
, N. Ferraro2
, S. Jardin2
, P.B. Parks3
, R. Lunsford2
, R. Maingi2
1Princeton University, NJ 08540, USA
2
Princeton Plasma Physics Laboratory, Princeton, NJ 08543, USA
3
General Atomics, PO Box 85608, San Diego, CA 92186, USA
E-mail contact of main author: [email protected]
Abstract. In this paper we present simulations of pedestal control by Lithium Granule Injection (LGI) in NSTX. A model for small granule ablation has been implemented in the M3D-C1 code [1], allowing the simulation of realistic Lithium granule injections. 2D and 3D simulations of Li injections in NSTX H-mode plasmas are performed and the effect of granule size, injection angle and velocity on the pedestal gradient increase is studied. The amplitude of the local pressure perturbation caused by the granules is found to be highly dependent on the solid granule size. Adjusting the granule injection velocity allows one to inject more particles at the pedestal top.
3D simulations show the destabilization of high order MHD modes whose amplitude is directly linked to the localized pressure perturbation, which is found to depend on the toroidal localization of the granule density source.
1. Introduction
ITER will have to keep the pedestal free of Edge-Localized-Modes (or ELMs) to prevent large heat fluxes potentially damaging for the device. At the same time, ITER must maintain very high plasma performance to reach its goals. To achieve this, real-time pedestal control will need to be used in ITER as well as in future fusion reactors. NSTX and other devices have already developed and tested many different control schemes in order to adjust and regulate the pedestal pressure and density. The aim is to change the pedestal parameters to mitigate ELMs. For example, gas puffing [2] injects fuel or impurities at the plasma edge to control the plasma pedestal density, 3D magnetic perturbations [3] create an edge stochastic layer increasing the transport (which lowers the pedestal pressure gradient), Lithium Granule Injections (LGI) [4] induce pressure perturbations triggering ELMs and can thus change the ELM frequency and their impact on the Plasma Facing Components (PFCs). NSTX-U is currently planning additional tests of these methods, in particular for LGI. The next step would be to combine all these methods into an adaptive and automatic pedestal control algorithm for tokamaks. Such a capability could allow one to explore new innovative scenarios such as the Super H-Mode [5] or lithium induced ELM-free regimes [6]. To build such a control algorithm, simplified models must be derived based on our understanding of the physics and on how the different control actuators affect the pedestal. This is especially important in order to evaluate applicability to future reactors, e.g. ITER.
but some concern exists because of the variability of triggered-ELM sizes. In particular, in high density, low-torque ITER baseline scenarios, an increase of the ELM frequency by LGI-pacing did not directly translate in ELM size mitigation [8]. Modeling with M3D-C1 investigates these phenomena by simulating the non-linear, 3 dimensional dynamic evolution of a realistic tokamak equilibrium subject to a triggered ELM. For this study, ablation models for Lithium granules have been implemented in M3D-C1. Studies of LGI with M3D-C1, whose first steps are detailed in this paper, improve our physical understanding of this method and will allow us to build reduced models for control applications. First, we present the implementation of granule ablation models in M3D-C1. We will then present the results of 2D NSTX LGI simulations investigating the pressure perturbation triggered by different granule sizes, injection angle and velocity. Finally, we will present 3D simulations investigating the MHD activity triggered by LGI.
2. Implementing ablation models for lithium granules in M3D-C1
Two models have been implemented in M3D-C1 to calculate the ablation rate of the Lithium granule. The first one [9] [10] is a Neutral Gas Shielding Model calibrated on DIII-D experimental measurements of the Lithium granule ablation rates. The second one [11] is valid for small size granules (sub-mm) where the contribution of plasma ions to the granule ablation is not negligible. In this second model, the ablation flow is treated as an expanding monoatomic gas with spherical symmetry, and a realistic Maxwellian distribution function for incident fast electrons is used. It also accounts for slowing down and pitch-angle scattering collisions of these fast electrons with cloud atoms. The granule is then modeled as a varying density source that is a Gaussian multiplied by the normalized ablation rate Ar. The
realistic granule radius rp is multiplied by an arbitrary parameter to give the width of the
density source. Indeed, experimentally an ablation cloud is observed around the granule and this parameter is used to mimic the experiment. Note that this is the only ÓfreeÓ parameter of the granule model and that experimentally its value is difficult to measure accurately (between 5-100 times the solid granule radius). Its impact on the simulations will be discussed further when presenting the results.
At each time-step, the granule ablation rate is calculated as Ar = C(ne, Te, rp) × Xm, where rp is
the granule radius and (ne, Te) are the electron density and temperature of the background
plasma at the granule position. C(ne, Te, rp), the non-dimensional ablation coefficient,
depends on the species parameter and is determined by solving the gas dynamic equations for the ablation flow for each set of (ne, Te, rp). A function fitting these results is used in
M3D-C1. The granule radius rp and thus the source width decreases as the granule is ablated
by the plasma, as δrp/δt = − C(ne, Te, rp) × Xp. Xm and Xp embody the dominant similarity law
for the strongly shielded cryogenic pellets and depends on the granule radius, the plasma density and temperature, the atomic mass of the granule and functions describing the interaction between incident plasma electrons and the granule ablation cloud. More details on the model can be found in [10][11].
3. LGI simulations with M3D-C1
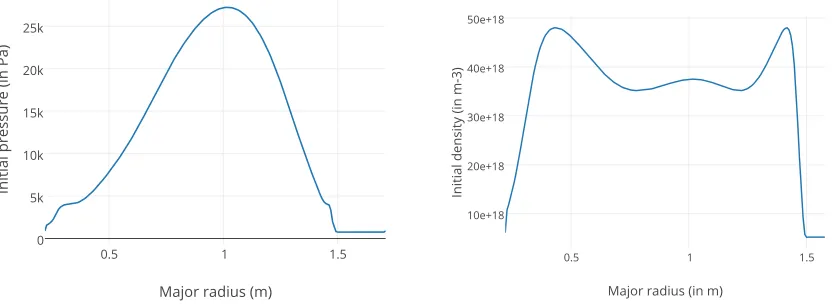
The simulations presented in the following start from NSTX experimental profiles (electron density and temperature). The target plasma is an ELMy H-mode (plasma discharge 129015) [6] with reliable temperature measurements during the inter-ELM period (See Figure 1 showing the input profiles). The main parameters of this discharge are BT = 0.44 T, Ip = 0.785
pedestal is initially at R = 1.46 m (see Figure 2).
Simulations are performed with granule injections of different granule radius, initial speed, injection angle and size of the ablation cloud, as summarized in table 1:
rp (in mm) Inj. Velocity (in m/s) Source width (in cm) Inj. angle (in degree)
0.2 Ð 1 50 Ð 200 1 - 5 -75 to +75
[image:4.595.82.498.225.377.2]Table 1: Range of granule input parameters used in the simulation
FIG. 1. Initial NSTX pressure and density profiles (before firing a Lithium Granule). These are experimental profiles within an inter-ELM time interval.
Typical meshes (see Figure 3) sizes used in the simulations are 1 - 5 mm and the time step is between 10-8 and 10-7seconds.
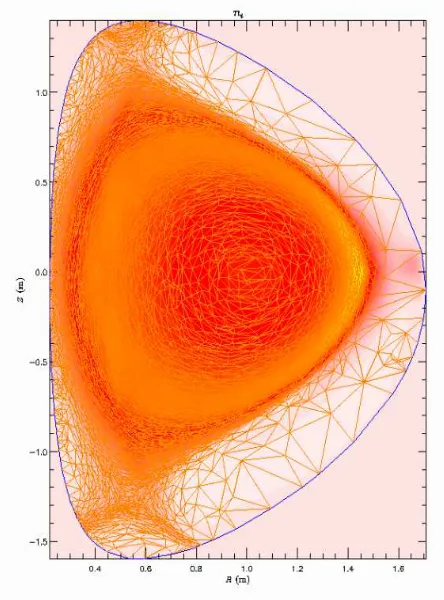
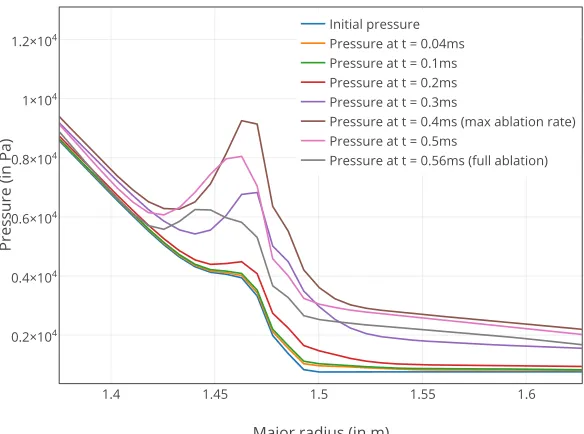
In these simulations, the granule starts propagating inward at R = 1.5 m with a constant velocity. As soon as the granule reaches the pedestal, a large and localized density increase is generated (see Figure 2). Electron conduction along the field lines reheats the localized region of high density, leading to a large increase of the plasma pressure. Figure 4 shows successive pressure profiles after the injection of a 0.8 mm granule and the maximum pressure perturbation is reached when the ablation rate of the granule is maximal. An increase of pressure also occurs in the Scrape-Of-Layer (SOL), which is associated to the boundary conditions used in the open field lines region.
FIG. 2. Electron density contours in the poloidal plane. The density increase is due to the injection of a 0.8 mm granule in NSTX. Separatrix is also drawn in red. The sketch of the LGI system shows that the
injection is done at midplane with a variable injection velocity.
[image:5.595.187.409.429.729.2]FIG. 4. Successive pressure profiles in the poloidal plan where the granule is injected. A large increase of the pedestal pressure is observed.
Figure 5 shows the positions in the plasma where the granules reach their maximum ablation rate and where the granules are totally ablated (penetration depth). The larger granules achieve a significantly larger penetration depth, up to 5.4 cm for 1 mm granules at 100 m/s, i.e. 3.4 cm inside the pedestal top. While the number of particles locally deposited at the pedestal top is higher for large granules, they also inject a non-negligible number of particles inside the separatrix. However, using a larger granule leads to a larger localized pressure perturbation and is thus preferable for ELM triggering.
FIG. 5. Positions where the granules are at maximum ablation and where the granules are completely ablated, for different granule initial sizes and a velocity of 100 m/s. Distance is given in cm inside the
separatrix (at r = 0 cm) and the position of the pedestal top (at r = -2 cm) is given.
launched with a velocity of 50 m/s deposit more particles in the pedestal region and also lead to a smaller increase of density (and temperature decrease) inside the plasma (between the plasma center and the pedestal top), compared to granules at 100 m/s and 200 m/s. The localized maximum pressure increase is presented on Figure 7 and shows that the pressure perturbation is lower for the fast granules compared to the slower ones. This result shows the importance of the injection velocity and one should choose this velocity to maximize the deposition in the pedestal region. Note that in the current model the granule velocity is assumed constant and that effects that may decelerate the granule are not included (for example the impact the non-uniformity of the magnetic field on the granule ablation cloud). Such effects will be included and tested in future work.
[image:7.595.126.458.241.480.2]FIG. 6. Number of ablated atoms injected when the granule is penetrating into the plasma. 0.4 mm granules with different velocities are injected. The top of the pressure pedestal is at R = 1.46 m for this NSTX discharge.
[image:7.595.151.441.524.744.2]Different angles of injection have been tested in the simulations, all using a 1 mm granule. The results are that there seems to be no differences between upward and downward injections and that injecting with an angle α with a velocity Vinj is also very similar to
injecting with no angle at a velocity of cos(α) x Vinj . However, the simulations did not take
into account the plasma rotation that may impact this result.
Finally, the impact of the size of the ablation cloud has been tested in 3D simulations. Three simulations have been done, injecting granules of the same size (i.e. same number of particles and ablation rate) but with a wider source, i.e. larger ablation cloud. The range of values is constrained by the memory limitations of the clusters that prevent us from using even finer meshes. The lower radius currently achievable for the ablation cloud is 1 cm. The radial width of the source can be varied between 1 and 5cm and has a small impact (few %) on the maximum induced pressure perturbation. However, the toroidal width of the source has been varied in 3D simulations and has a significant impact. These simulations start from the same NSTX equilibrium and the same number of particles injected. They typically include 16 to 32 toroidal planes. The source is varied from a quasi-axisymmetric source to one with a toroidal extension of 72 degrees. The toroidal extension of the source is characterized by the parameter dpsi, which is the half width of the Gaussian in the toroidal direction.
The localized density and pressure increase is found to be much larger as the toroidal width of the source decreases. This 3D localized pressure structure is responsible for the destabilization of MHD modes, potentially leading to an ELM.
FIG. 8. Magnetic energies of harmonics n = 0-8 for 3D simulations of LGI in a NSTX H-Mode plasma. Only the toroidal width of the source is varied between the two simulations.
4. Discussion and perspectives
These simulations show that the local pressure perturbation at the pedestal induced by LGI increases with granule size and decreases with velocity. To avoid an undesirable decrease of the temperature inside the separatrix, one can inject granules with a larger injection angle or by decreasing the injection velocity. An LGI system has been installed on NSTX-U and synthetic diagnostics (line integrated measurement of density from interferometry, heat-flux footprint in vicinity of the strike-points) are currently being implemented in M3D-C1. This will allow a comparison of the predicted density increase at the edge to the measured values. Granules with a high injection velocity are not found to be always beneficial. A fast granule might increase the pedestal pressure gradient very quickly, but to values below the ELM-triggering threshold, when slower granules might increase the pedestal gradient above this threshold for the same number of injected particles. 3D simulations are on going to specify quantitatively this threshold and the impact of granule parameters on ELM properties. These simulations aim at finding an effective compromise between fast ELM-pacing and high confinement. 3D simulations already show the impact of the toroidal localization of the density source on the amplitude of the magnetic energy, in particular for high-order modes. Current effort aims at further decreasing the source toroidal localization via mesh packing techniques and adaptive meshing.
Acknowledgments. This manuscript is based upon work supported by the U.S. Department of Energy, Office of Science, Office of Fusion Energy Sciences, and has been authored by Princeton University under Contract Number DE-AC02-09CH11466 with the U.S. Department of Energy. The digital data for this paper can be found in
http://arks.princeton.edu/ark:/88435/dsp018p58pg29j.
[1] S.C. JARDIN, et al., Computational Science & Discovery, 5 (2012) 014002
[2] R. NAZIKIAN, et al., Proceedings of IAEA 2014, EX1-1
[3] R.J. HAWRYLUK, et al., Nucl. Fusion 55 (2015) 053001
[4] D. K. MANSFIELD, et al., Nucl. Fusion 53 (2013) 113023
[5] W. M. SOLOMON, et al., PRL 113, 135001 (2014)
[6] R. MAINGI, et al., PRL 103, 075001 (2009)
[7] A. BORTOLON, et al., Nucl. Fusion 56 (2016) 056008
[8] A. BORTOLON, et al., to be submitted to Nuclear Fusion
[9] R. LUNSFORD, et al., Fusion Eng. Des. (2016)
[11] P. B. PARKS, et al., to be submitted in Physics of Plasmas