© 2018, IRJET | Impact Factor value: 6.171 | ISO 9001:2008 Certified Journal | Page 127
Crowd Density Estimation using Image Processing
Unmesh Dahake
1, Bhavik Bakraniya
2, Jay Thakkar
3, Mandar Sohani
4123
Student, Vidyalankar Institute of Technology, Mumbai, India
4Professor, Vidyalankar Institute of Technology, Mumbai, India
---***---
Abstract
— Crowd density estimation is an extremely important aspect that needs to be considered in current times owing to an ever-increasing population. When many people are gathered, there can be possibility of threat to life, property and more. This is where crowd density estimation can help organizers of public events, railway security, college campuses, etc. to keep a check on crowd density, by using application based on image processing. In this project work, image processing technique of skin color model followed by morphological operation is used to estimate number of people in an image.Keywords—Skin
color model, Morphological operation1. INTRODUCTION
Crowd density estimation is a process to estimate the crowd for intelligent monitoring of the same. This helps to plan better security measures as well as crowd management methods for places which are crowded. Nowadays security surveillance cameras are installed at most of the places as these cameras are available in low cost. Because of this the researchers have taken an interest in developing techniques for Crowd Density Estimation using these camera feeds.
Crowd analysis has gained a lot of momentum in recent years because of its variety of applications. Detection of human beings in crowded video scenes is getting more proliferation due to the variety of applications in crowd monitoring and tracking. This can be further extended for face detection and forensic purposes.
Various techniques have been implemented to estimate crowd density using cameras, some of them using background removal methods, lecture analysis methods, etc. But most of the methods were difficult to implement and were restricted to a kind of images. Other methods did not have good accuracy in estimation. Thus to maximize the accuracy, minimize the problems and have a real time working method we propose the following system which is based on skin color detection.
2.
LITERATURE SURVEY
2.1 Color Spaces
Color space, also known as the color model (or color system), is an abstract mathematical model which simply describes the range of colors as tuples of numbers,
typically as 3 or 4 values or color components (e.g. RGB)[1] . Basically color space is an elaboration of the coordinate system and sub-space. Each color in the system is represented by a single dot. A wide variety of applications including image processing, computer graphics, T.V. broadcasting, etc. where these color models are used. In our project we are dealing with mainly two color models i.e. RGB and HSV. A little focus on YCbCr color model is also made.
2.1.1 RGB color space
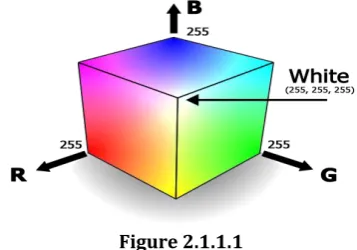
[image:1.595.342.521.434.559.2]RGB color model is most widely used and considered as the default color model. It consists of the three components namely Red, Green and Blue. A broad variety of colors can be produced by combining these colors in appropriate quantity. The main purpose of the RGB color model is for the sensing, representation and display of images in electronic systems, such as televisions and computers, though it has also been used in conventional photography.
Figure 2.1.1.1
2.1.2 HSV color space
HSV color model is considered as an alternative representation of the RGB color model. It basically consists of three components which are described further. Hue is the color portion of the model, and is expressed as a number from 0 to 360 degrees. [2]
Color Angle
Red 0-60
Yellow 60-120
Green 120-180
Blue 240-300
[image:2.595.88.217.68.141.2] [image:2.595.73.252.228.389.2]Magenta 300-360
Figure 2.1.2.1
[image:2.595.109.231.528.653.2] [image:2.595.313.550.539.651.2]Saturation varies from 0 to 1, where 0 is considered as gray and 1 as a primary color. Value works in conjunction with saturation and describes the brightness or intensity of the color, from 0 to 100 percent, where 0 is completely black and 100 is the brightest and reveals the most color.
Figure 2.1.2.2
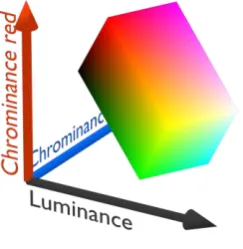
2.1.3 YCbCr color space
YCbCr is commonly used color space in digital video domain. In this color space, luminance information is stored as a single component (Y), while chrominance information is stored in two color-difference components (Cb and Cr). Cb is the blue component relative to the green component and Cr is the red component relative to the green component.
Figure 2.1.3.1
2.2 Traditional Approaches
2.2.1 Background Elimination and Feature Extraction Technique
In this method [3], background is removed by using a combination of optical flow and background subtraction
methods. Then according to texture analysis, a set of new features is extracted from foreground image. It uses Lucas Kanade(LK) optical flow method. However, optical flow methods are sensitive to brightness change, when using LK method; it’s difficult to find a proper threshold to segment foreground and background. To improve the result, it combines LK optical flow and Gaussian Background Model (GBM). The next step includes features extractions which further include steps as follows:
Step 1: The RGB foreground image is changed into three channels of gray images.
Step 2: The 255-level gray images are changed into 64-level gray images.
Step 3: Each image is used to calculate 4 GLCM with different degrees.
Step 4: Extracting Dy from each GLCM
These strategies are not viable when it comes to sparse crowd but complex structure, or dense crowd but simple texture as it might lead to misclassification.
2.2.2 Fusion of statistic features and texture analysis
As using pixel statistics and texture analysis approaches individually, it fails to perform in high density fields and complex background when it comes to pixel statistics and texture analysis respectively. This paper [4] uses statistic features and texture analysis to minimize errors and improve efficiency. Algorithm is divided into feature extraction and feature classification. Feature extraction includes the frame difference, mosaic image difference (MID), time uniform distribution, grid method, wavelet transformation and GLCM (Gray-Level Co-occurrence Matrix).
Figure 2.2.2.1
The key point mentioned here is taking 5 fps (frames per second) to see the changes in field as well as to reduce complex calculations. Support Vector Machine (SVM) is used to do learning and classification. Since SVM achieves the classification of two models, so LIBSVM is used to classify crowd density as low, moderate, high and very high. This result into improvement in accurate results, but shadow and reflective surfaces in background of an image could lead to misclassification.
2.2.3 Mutual feedback scheme for face detection
[image:3.595.331.514.133.318.2]This paper [5] provides one of the better approaches in dealing with crowd density estimation, as it aims at face detection. The solution is provided by using the concept of spatial detection and temporal tracking. Spatial detection is based on skin color classification and shape analysis by using morphological tools. Spatial detection is applied to selected frames which are called as “key frames”.
Figure 2.2.3.1
Both the blocks i.e. the spatial detection and the temporal tracking block analyze the original video frame with the initial estimate of the region of support of the faces to be detected. The feature vector fv is used to store the parameters of detected faces and it evolves with time. The SD block uses the temporal information to improve its face detection rates without increasing the false positives. The TT block provides the information about the faces that might be included in the given skin region. One of the major advantages of this algorithm is, it can reject false positives as well as resolves occlusion problems. Disadvantage can be seen from illumination point of view, as it may lead to false detections or discarded detections.
2.2.4 Detection of faces based on property of circularity
In this process [11], skin detection and morphological operations are applied on the image. Faces and objects which satisfy the criterion of skin are highlighted. The area and perimeter of the detected objects are calculated and circularity of the objects is calculated according to the formula given below.
Metric = 4*pi*area/(perimeter)²
Closer the value of Metric to 1, circularity of that region will be more. The threshold is set to some suitable value; those objects which have circularity more than threshold value are selected and the rest are eliminated.
3. PROPOSED SYSTEM
In this system we are attempting to simplify, actualize by utilizing exiting techniques for crowd density estimation.
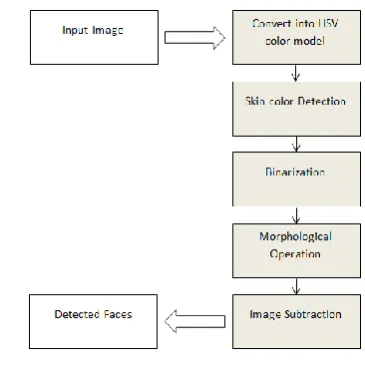
This updated strategy can be effectively utilized as a part of crowd monitoring and face matching. The following is the flow chart of the proposed system.
Figure 3.1
3.1 Methodology
The following are the description of modules in the given system.
3.1.1 Skin Color Detection
Several colour models can be used for human skin colour identification such as HSV, YCbCr etc. In this process we are using HSV colour model as it is quite accuracy. The input to this step is a colour image which is in RGB format. Three matrices of red, green and blue are extracted in form of two dimensional matrixes, where numbers of rows represents the width and numbers of columns represents the height of the colour image. The image is then converted into HSV colour model where the Hue and saturation are extracted in form of two dimensional matrixes for further use. The extracted components that is the red, green and blue along with hue and saturation are compared with standard skin colour values .If all the values for a particular pixel lie in the specified range, then the corresponding pixel is highlighted. The ranges for a skin colour pixel in RGB and HSV colour spaces used in the system are as follows [6]:
0.0 <= H <= 50.0 and 0.23 <= S <= 0.68 and R > 95 and G > 40 and B > 20 and R > G and R > B and | R - G | > 15
(R: Red, G: Green, B: Blue, H: Hue and S: Saturation)
After this what we obtain is a binarized image with the skin colour pixels highlighted and the remaining pixels eliminated.
Figures 3.1.1.2 and 3.1.1.3 are the binary image obtained after skin color detection using HSV and YCbCr color model
[image:3.595.52.277.202.334.2]respectively. From this we can conclude that HSV color model provides better results than YCbCr color model.
[image:4.595.68.258.132.286.2] [image:4.595.68.257.311.466.2] [image:4.595.344.521.350.608.2]A: Original Image
Figure 3.1.1.1 B: Binarization using HSV color model
[image:4.595.62.259.491.646.2]
Figure 3.1.1.2 C: Binarization using YCbCr color model
Figure 3.1.1.3
3.1.2 Morphological Operations
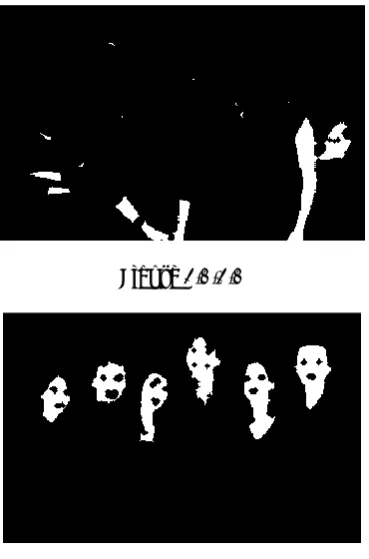
Binary image obtained may contain numerous imperfections. The image obtained may contain faces as well as hands of people in the image .For eliminating the non-facial regions morphological operations are performed. Morphological operations include erosion, dilation, opening and closing which are used to make the regions smooth for further processing. Most of the times, it
is generally considered that human faces are generally circular or elliptical in shape. Basic morphological operations like erosion and dilation are performed [7]. Dilation adds pixels to the boundaries of objects in an image, while erosion removes pixels on object boundaries. Another morphological operation is Opening [8] which opens up the gap between objects connected by a thin bridge of pixels so that either can be easily processed further. All these operations are performed using structuring element. Depending on the size and shape of the structuring element, number of pixels are added or removed from objects in an image. In this system, images are processed using disk shaped or square shaped structuring elements having sizes varying from 1 to maximum of 5.The structuring element is declared by using the function strel [9] in matlab, where the value 2 or 3 refers to the distance of the structuring element form the origin. Those binary images that result in some discontinuities in regions can be solved by using the hole filling operation. Consider figure 3.1.2.2 which is obtained by performing morphological operations on figure 3.1.2.1. The image is eroded using disk of size 2.
Figure 3.1.2.1
Figure 3.1.2.2
3.1.3 Removing nonessential objects by Image subtraction
morphological operation. This results in an image containing detected faces. It may happen that some objects pass through this because these objects may possess similar skin colour as well as they may lay in a specified structuring element i.e. false positives. This can be removed by specifying the threshold or range of an attribute called ‘area’. Those objects that differ from the average area of a human face are eliminated. Consider Figure 3.1.3.1 in which nonessential objects are detected contained in figure 3.1.2.2. Figure 3.1.3.1 is subtracted from figure 3.1.2.2 to get the resultant (figure 3.1.3.2) image containing detected faces.
Figure 3.1.3.1
Figure 3.1.3.2
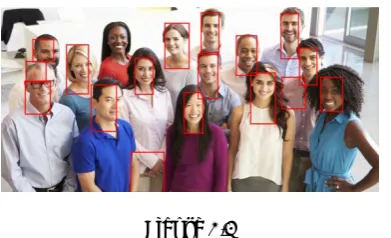
3.1.4 Labelling and Representation of detected faces
A property called as Bounding Box is used to draw rectangle on the detected faces, where the co-ordinates of the four corners are found and a rectangle is drawn over an entire image where faces are detected. Now, detected faces are labelled and count is generated. Consider figure 3.1.4.1.
Figure 3.1.4.1
4. RESULTS
The table shows morphological operation-erosion performed on images using structuring element which are disk and square having size 2 and 3 and the corresponding number of faces detected in the image along with the ground truth. The images in this dataset are downloaded randomly from Google for human skin detection and processing.
Figure 4.1
Note: image1, image2, image3, image6 require Morphological opening operation
Some of the sample result images are shown below
A] In the below figure the algorithm eliminates the hands of a person and clearly shows the detected faces.
Figure 4.2
Image Structuring
Element Size
faces Detected
False positives
Ground Truth
2 1
-3 1
-2 1
-3 1
-2 2
-3 2
-2 2
-3 3
-2 5
-3 4
-2 5
-3 5
-2 6
-3 5
-2 7
-3 8
-2 14
-3 10
-2 16
-3 14
-2 14
-3 8 2
2 16
-3 15
-2 11 1
3 9
-5 9
-3 12 2
2 13 2
3 10 2
2 15 3
3 14 3
10
15 1
2
4
6
9
11 Square
Disk
Square Disk
Square
Disk
Square
Disk
Square Image1
Image2
Image3
Image4
Image5
Image6
Image7
Image8
Disk
Square
Disk
Square
Disk Square
Disk
B] In some of the images false positives are detected i.e. regions which are not faces still detected by the algorithm as in figure 4.3 where the coat of the person which falls in the skin color range is also detected. This is the limitation of the skin color model.
Figure 4.3
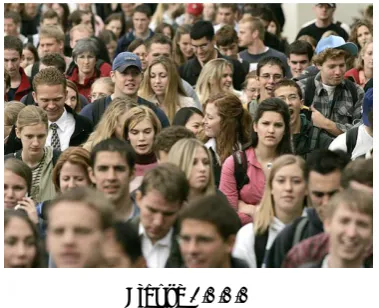
[image:6.595.89.238.318.433.2]C] In this image (Figure 4.4) since the background color falls in the range of skin color 9 out of 10 people are detected which reduces the accuracy to 90%.
Figure 4.4
D] in this image (Figure 4.5) 3 false positives are detected which fall in the skin color range.
Figure 4.5
The above algorithm is tested on images of general crowd. One image having ground truth of around 90 the algorithm gives count of 83 including 5 false positives. Another image of a college ground truth around 75, for this the algorithm gives a count of 75 including 6-7 false positives. Another image of a school having a ground truth of around 60 the algorithm gives a count of 47 with 6-7 false positives.
5. CONCLUSION AND FUTURE SCOPE
We have proposed one of the simplest methods of face detection and crowd estimation. Accuracy of the algorithm varies from image to image giving an average accuracy of 75%.The algorithm is capable of detecting faces under
different lightning conditions. There are some areas where 100% accuracy doesn’t fall into picture. One of the reasons behind is the size and shape of the structuring element. As we change the size and shape of the structuring element, the detection of the number of faces may vary. Another reason is the limitation of the skin color model which detects both faces as well as background object. Further improvement can be made in terms of eliminating false positives by distinguishing between facial and non-facial regions.
6. ACKNOWLEDGEMENT
We are thankful to our professor for guiding us throughout the project and helping us in various ways such as suggesting the changes in the system wherever necessary, etc. We also like to appreciate Google and all the authors for providing random images and documents which were needed on time. This could have been incomplete without taking reviews from various professors as well as from our friends.
7. REFERENCES
1. http://www.arcsoft.com/topics/photostudio-darkroom/what-is-color-space.html
2. https://www.lifewire.com/what-is-hsv-in-design-1078068
3. Wei Li, Xiaojuan Wu, Koichi Matsumoto and Hua-An Zhao, “A New Approach of Crowd Density Estimation”
4. Zi Ye, Jinqiao Wang, Zhenchong Wang and Hanqing Lu, “Multiple Features Fusion for Crowd Density Estimation”
5. J.R. Casas, A. Puig Sitjes and P. Puig Folch, “Mutual feedback scheme for face detection
6. and tracking aimed at density estimation in demonstrations”
7. S. Kolkur, D. Kalbande, P. Shimpi, C. Bapat and J.Jatakia, “Human Skin Detection Using RGB, HSV and YCbCr Color 8. Models”
9. https://in.mathworks.com/help/images/morphological -dilation-and-erosion.html
10. https://in.mathworks.com/help/images/ref/imopen.ht ml
11. https://in.mathworks.com/help/images/ref/strel.html
12. http://in.mathworks.com/help/images/ref/bwpropfilt. html
13. https://in.mathworks.com/matlabcentral/answers/141 786-how-to-detect-the-circle-ish-shape-in-an-image.
[image:6.595.67.263.477.596.2]