© 2017, IRJET | Impact Factor value: 5.181 | ISO 9001:2008 Certified Journal | Page 44
PERFORMANCE ANALYSIS OF THE TALL STRUCTURE WITH DIAGRID
FOR SEISMIC LOADING
Pavana V
1, Dr. Shreepad Desai
21
P.G Student, Department of Civil Engineering, Haveri, Karnataka, India
2Asst.
Professor
Department of Civil Engineering, Haveri, Karnataka, India
---***---Abstract - Seismic analysis of structural systems has been
a necessary in the recent past. The diagrids have favourable circumstances like light weight structure, compelling against gravity stack, resistance against seismic and wind loads, excess, possible for contorted and other complex structures, reasonable. The diagrid structures utilized 33% less steel than common structures with same basic execution. Modelling of the structures with three distinct arrangements for the three diverse story statures independently. To increment the auxiliary execution of the structures by outside segments with the inclining diagrid module for each one of the models. To study and analyze the horizontal relocations and sidelong floats of the all the diagrid models for seismic stacking. To look at the base shear qualities of the models with diagrid individuals. To analyze the above parameters of both diagrid structures and structures with shear divider with seismic stacking.
In the current study, models were prepared for G+18 The basic goal of the venture was to concentrate the conduct of the tall structures with the diagrid frameworks and the real horizontal load opposing some portion of the structure. Consequently, three states of the arrangements were considered they are square, octagon and round about. All the three models are symmetric in plan. For each shape three story statures are displayed that is 18 stories, from the past explores it was found the ideal plot for diagrid is around 70 degrees. Utilizing dis information we have displayed the diagrid with an edge of 69.67 degrees. Both the diagrid and shear divider framework models with not have any segments at the building limit. The models were subjected to both seismic and dynamic loads. The structural responses like natural periods, base shear, displacement, Storey Stiffness and inter storey drifts were also studied and located in seismic zone 4 in accordance with IS 1893-2002. From the seismic performance results shows that
o
f diagrid system with shear wall system it is found that the above parameters in diagrid models are much lesser than the shear wall models.
Key Words:Diagrid, Column, beam, slab, Shear wall.
1.
INTRODUCTION
India has second highest population in the world, day by day availability of land will decreased because India
is developing country, for using of remaining land efficiently, so some companies constructing high rise buildings. Many of countries for constructing buildings using steel structures but in our country steel structures rarely using due to lack of knowledge and economical reason. The improvement of tall structures relates various complex angles, for example, financial aspects, logical information, feel government strategies. The money related element will be the essential deciding variable. Tall structures request a ton of specialized support without which its development is unrealistic. As the tallness of the structure is expanded the horizontal supremacies following up on the structure additionally quickly increments. Subsequently the oblique load opposing frameworks goes out to be tremendously basic
.
Behavior of concrete, earthquake effect and design of earthquake resistance for different zones and different soil condition these are parameter commonly consider for construction activity.Earthquake is one of the natural phenomena it may happen due to naturally or human activity, what it may be it required safety of buildings to resist seismic loads. For analysis of structure, considering the zones, soil condition and other data will available in IS 1893-2000 code book.
© 2017, IRJET | Impact Factor value: 5.181 | ISO 9001:2008 Certified Journal | Page 45 The RCC dividers in a structure gave basically to
oppose the level strengths is known as shear dividers. The lofty structures in which shear dividers are the principal basic individuals intended to oppose sidelong powers are called working with shear divider framework. Significant segment of sidelong seismic and wind powers is taken up by these dividers. The demeanor of shear divider is like the activity of a cantilever profound pillar. At the argument when the stature to length proportion is little the shear dividers are known as squat dividers and high tallness to length proportion is called high shear divider.
2. OBJECTIVES
The main objective of the work is
1. To perform linear static and linear dynamic analysis of diagrid and shear wall structures using Response Spectrum method.
2. Response evaluation of 3D Systems of Diagrid model and shear wall models at periphery under dynamic loading.
3. Seismic performance by studying Time Period, Story displacement, Story stiffness, Story drift and Base shear by considering 18storey with three different plan ,zone IV .
3. METHOD OF ANALYSIS
3.1 Approaches for seismic analysis of the
Structure
The two imperative approaches of seismic scurutiny are
Static analysis
Dynamic analysis
In this method, design of base shear can be computed along the height of building, simple formulas using to analyze base shear according to IS 1893(part-I); 2002.
i. Design of lateral force or design of base shear can be determined by
(Clause 7.5, IS 1893(Part-I):2002)
VB = Ah x W Where,
VB is base shear
Ah is design horizontal force W is seismic weight of building
R is response reduction factor Z is zone factor
I is important factor
Sa/g is average acceleration response coefficient
ii. Fundamental natural period iii. Distribution of base shear
Qi =
Where,
Qi is design lateral force at floor i Wi is seismic weight of floor i hi is height of floor
n is number of stories in building
4. MODELLING AND ANALYISIS
The basic goal of the venture was to concentrate the conduct of the tall structures with the diagrid frameworks and the real horizontal load opposing some portion of the structure. Consequently, three states of the arrangements were considered they are square, octagon and round about. All the three models are symmetric in plan. For each shape three story statures are displayed that is 18 stories, for relative reason, we have utilized shear divider framework as an outer side long load opposing frame work. For similar arrangements and story statures we have utilized shear dividers set up of diagrid.Both the diagrid and shear divider framework models with not have any segments at the building limit.
4.1 BUILDING MODELING
Modeling will be done by using ETABS software, the frame element like column, beam columns are modeled. Area element slab and shear wall as consider as member and shell element. Building frames with fixed base . Following Seismic analyses of 3D building diagrid structure and shear wall structure with three different plan square, octagon 40x40Bay & circular plan perimeter 160m Bay 18 Storeys. Different types of Models considered for this analysis are
4.2 DETAILS OF DIAGRID STRUCTURE & SHEAR
WALL STRUCTURE
Dimensions of Beam1 (bxd) = (500x1000) mm
Dimensions of Beam2 (bxd) = (300x700) mm
Dimensions of Column (bxd) = (1000x1000)mm
Thickness of Slab, = 125 mm
Thickness of Diagrid= 500mm hallow pipe with 25mm
Thickness of Shear wall, W= 500 mm & 300mm
Height of column, hcl= 3.6 m
Steel for diagrid = Fe 345
Reinforcement =HYSD 500
Modulus of concrete (fck )=M30
Moment of Inertia of Beam / Column = 2.6 x 10⁻³ & 10 x 10-3 m4
© 2017, IRJET | Impact Factor value: 5.181 | ISO 9001:2008 Certified Journal | Page 46
4.3 Description of the Specimen
3D diagrid structure and shear wall structure of 40x40 having 18 Storeys are taken into consideration. For the design of RC frames structures using Bureau of Indian Standards (IS) codes, IS 456-2000, “Plain and Reinforced Concrete-code of practice”, IS 1893-2002 (Part 1), “Criteria for earthquake resistant design of structures” and detailed as per IS 13920-1993, the concrete is M30 and Tor steel are used for reinforcement. For Analysis of the structures is carried by using ETABS 9.7 software. For analysis considered loads are Live load, Dead load and earthquake load.
4.3.1
Dead load (DL)
The self weight/dead load is consider as per IS 875-1987 (Part I-Dead loads), “Code of Practice for Design Loads (Other than Earthquake) for Buildings and Structures”.
Unit weight of Reinforced Concrete = 25 kN/m3
Super dead load = 2 kN/m2
Floor finish = 1.0 kN/m2
Roof finish = 1.0kN/m2
4.3.2
Imposed Load (LL)
The live load imposed load is consider as per IS 875-1987 (Part II-Live load), “Code of Practice for Design Loads (Other than Earthquake) for Buildings and Structures”.
Imposed load on slab = 3.0 kN/m2
Imposed load on roof = 1.5 kN/m24.3.3 Earthquake Load (EL)
The earthquake load is consider as per the IS 1893-2002(Part 1). The factors considered are
Zone factors = 0.24 (zone IV)
Importance factor = 1.0
Response reduction factor = 5.0
Soil condition = II
Time period = programmed calculation
4.3.4 Load Combinations
The load combinations are consider as per IS 875-1987 (Part 5-Special loads and combinations) “Code of Practice for Design Loads (Other than Earthquake) for Buildings and Structures”.
a. 1.5 (DL + IL) b. 1.2 (DL + IL ± EL) c. 1.5 (DL ± EL) d. 0.9 DL ± 1.5 EL
4.4 Models with the Diagrid structure used in the
analysis
DS 1- Square paln models with exterior diagrid
DS 2- Octagonal plan models with exterior diagrid
DS 3- circular plan models with exterior diagrid
4.5 Models with shear wall structure
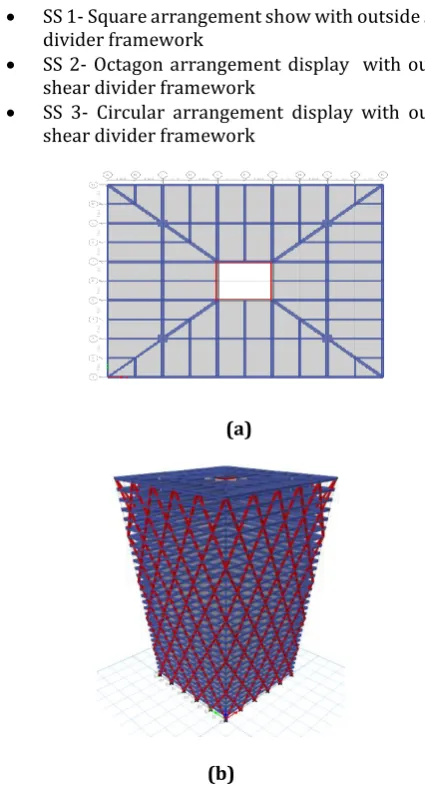
SS 1- Square arrangement show with outside shear divider framework
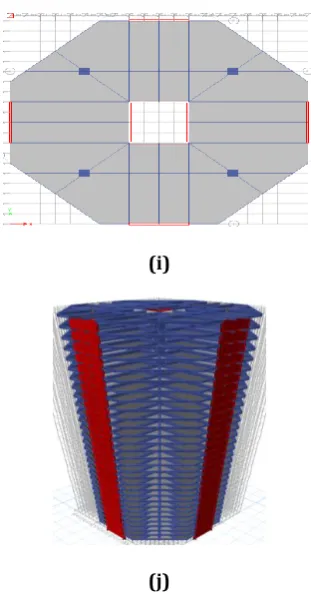
SS 2- Octagon arrangement display with outside shear divider framework
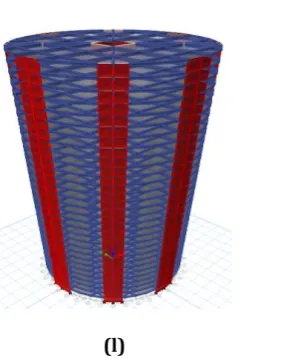
SS 3- Circular arrangement display with outside shear divider framework
(a)
[image:3.595.323.536.211.612.2](b)
Fig 1: Plan of Symmetrical 40x40 3D view models of square models diagrid
© 2017, IRJET | Impact Factor value: 5.181 | ISO 9001:2008 Certified Journal | Page 47
[image:4.595.53.557.38.817.2](d)
Fig 2: Plan of Symmetrical 40x40 3D view models of octagonal plan diagrid
(e)
(f)
Fig 3: Plan of Symmetrical 3D view models of circular models diagrid
(g)
(h)
Fig 4: plan of Symmetrical 3D view models of the square models with exterior shear wall
(i)
(j)
Fig 5: plan of Symmetrical 3D view models of the octagon models with exterior shear wall
[image:4.595.354.510.305.607.2]© 2017, IRJET | Impact Factor value: 5.181 | ISO 9001:2008 Certified Journal | Page 48
[image:5.595.300.558.56.288.2](l)
Fig 6: plan of Symmetrical 3D view models of the circular models with exterior shear wall
5. RESULTS AND DISCUSION
The present study is on diagrid structure models and shear wall structure models for Symmetrical Systems, at different three plans locations and subjected to loads such as Seismic Static load and Seismic Dynamic load. Performance of diagrid structure and shear wall structure are compared and discussed for various Seismic Parameters are lateral displacement, time period, storey stiffeness, storey base shear, an storey drift, with relevant graphs and Tables in the sections to follow;
5.1 EQUVIVALENT STATIC AND DYNAMIC
ANALYSIS
Comparison of three different Models with Diagrid System and Shear Wall System.
Square model-18 storey
Octagon model-18 storey
Circular model-18 storey
Fundamental Natural Time Period as per IS 1893-2002 and as per analysis using software are tabulated in Symmetrical models for 18-Storey Structures.
Codal Natural Time Period as per IS 1893:2002 Cl. no. 7.8.1 P.no.24
T = 0.075H0.75 Where
H=Height of the Building
Table -1: Natural Time period for square model of diagrid and shear wall systems
TIME PERIOD FOR SQUARE
DIAGRID SHEAR WALL
1.177 1.427
[image:5.595.104.250.85.266.2]Chart -1: Variation of Natural Time Period for square models of diagrid and shear wall systems
Table -2: Natural Time period for octagonal model of diagrid and shear wall systems
TIME PERIOD FOR OCTAGON
DIAGRID SHEAR WALL
1.099 1.519
Chart -2: Variation of Natural Time Period for octagonal models of diagrid and shear wall systems
Table -3: Natural Time period for circular model of diagrid and shear wall systems
TIME PERIOD FOR CIRCULAR MODEL
DIAGRID SHEAR WALL
[image:5.595.309.559.364.630.2]© 2017, IRJET | Impact Factor value: 5.181 | ISO 9001:2008 Certified Journal | Page 49
[image:6.595.295.561.54.254.2]Chart -3: Variation of Natural Time Period for circular models of diagrid and shear wall systems
Table -4: Natural Time period of diagrid systems
TIME PERIOD FOR DIAGRID
SQUARE OCTAGON CIRCULAR
1.177 1.099 1.206
Chart -4: Variation of Natural Time Period of diagrid systems
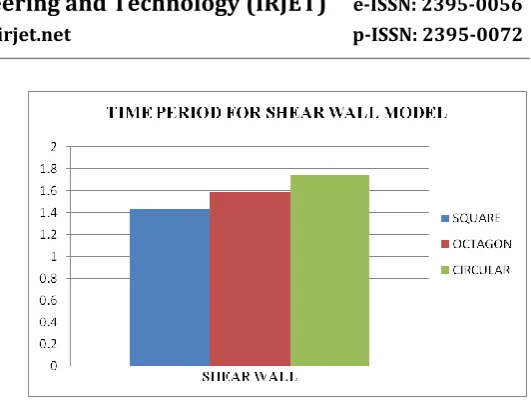
Table -5: Natural Time period of shear wall systems
TIME PERIOD FOR SHEAR WALL
SQUARE OCTAGON CIRCULAR
1.427 1.591 1.749
Chart -5: Variation of Natural Time Period of shear wall systems
5.2 Lateral Displacement
According to IS-456:2000 (Cl.No 20.5 p.no.33), maximum lateral displacement is
[image:6.595.38.290.334.581.2]Where H is building height
Table -6: Storey Displacements for square model of diagrid and shear wall systems
LATERAL DISPLACEMENTS OF SQUARE MODEL
DIAGRID SHEAR WALL
13.6 17.2
12.9 16
12.2 14.9
11.5 13.7
10.7 12.5
9.9 11.3
9.1 10.1
8.2 8.9
[image:6.595.321.547.411.694.2]© 2017, IRJET | Impact Factor value: 5.181 | ISO 9001:2008 Certified Journal | Page 50
Table -7: Storey Displacements for octagonal model of diagrid and shear wall systems
LATERAL DISPLACEMENT OF OCTAGON MODEL
DIAGRID SHEAR WALL
12.9 18.3
12.3 17.2
11.6 16
10.9 14.8
10.2 13.6
9.4 12.3
8.6 11.1
7.8 9.9
[image:7.595.308.561.278.443.2]Chart -7: Variation of Displacements in Seismic Case of octagon models diagrid and shear wall systems
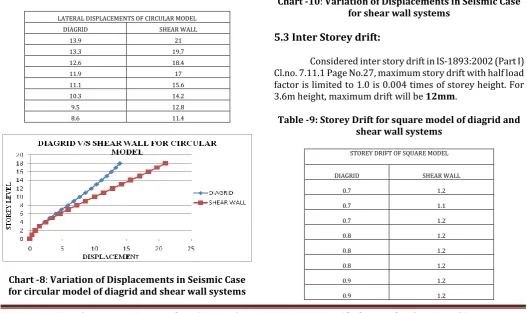
Table -8: Storey Displacements for circular model of diagrid and shear wall systems
LATERAL DISPLACEMENTS OFCIRCULAR MODEL
DIAGRID SHEAR WALL
13.9 21
13.3 19.7
12.6 18.4
11.9 17
11.1 15.6
10.3 14.2
9.5 12.8
8.6 11.4
Chart -8: Variation of Displacements in Seismic Case for circular model of diagrid and shear wall systems
Chart -9: Variation of Displacements in Seismic Case for diagrid systems
Chart -10: Variation of Displacements in Seismic Case for shear wall systems
5.3 Inter Storey drift:
[image:7.595.34.562.472.785.2]Considered inter story drift in IS-1893:2002 (Part I) Cl.no. 7.11.1 Page No.27, maximum story drift with half load factor is limited to 1.0 is 0.004 times of storey height. For 3.6m height, maximum drift will be 12mm.
Table -9: Storey Drift for square model of diagrid and shear wall systems
STOREY DRIFT OFSQUARE MODEL
DIAGRID SHEAR WALL
0.7 1.2
0.7 1.1
0.7 1.2
0.8 1.2
0.8 1.2
0.8 1.2
0.9 1.2
© 2017, IRJET | Impact Factor value: 5.181 | ISO 9001:2008 Certified Journal | Page 51
[image:8.595.40.562.28.843.2]Chart -11: Variation of Storey Drifts for square model of diagrid and shear wall systems
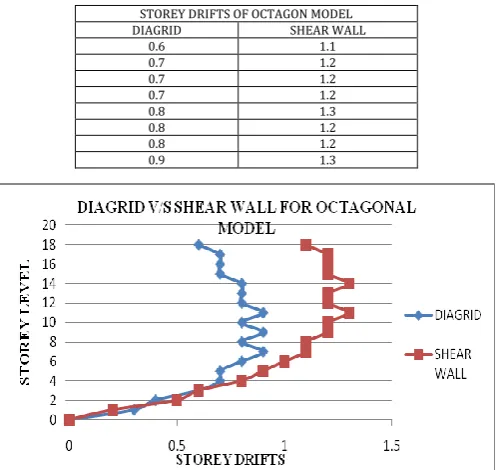
Table -10: Storey Drift for octagonal model of diagrid and shear wall systems
STOREY DRIFTS OF OCTAGON MODEL
DIAGRID SHEAR WALL
0.6 1.1
0.7 1.2
0.7 1.2
0.7 1.2
0.8 1.3
0.8 1.2
0.8 1.2
0.9 1.3
[image:8.595.37.286.112.255.2]Chart -12: Variation of Storey Drifts for octagonal model of diagrid and shear wall systems
Table -11: Storey Drift for circular model of diagrid and shear wall systems
STOREY DRIFTS OF CIRCULAR MODEL
DIAGRID SHEAR WALL
0.6 1.3
0.7 1.3
0.7 1.4
0.8 1.4
0.8 1.4
0.8 1.4
0.9 1.4
0.9 1.4
Chart -13: Variation of Storey Drifts for circular model of diagrid and shear wall systems
Chart -14: Variation of Storey Drifts for diagrid systems
Chart -15: Variation of Storey Drifts for shear wall systems
5.4 STOREY STIFFENESS ANALYSIS:
Table -12: Storey
Stiffeness
for square model of diagrid and shear wall systemsSTOREY STIFFENESSOF SQUARE MODEL
[image:8.595.38.288.338.573.2]© 2017, IRJET | Impact Factor value: 5.181 | ISO 9001:2008 Certified Journal | Page 52 1277460.088 517959.339
2349708.157 1049847.269
3101076.513 1531919.654
3737972.095 1966319.9
4197768.279 2361563.718
4445586.122 2727021.621
4746229.203 3073485.246
5067436.165 3413104.114
[image:9.595.39.287.92.352.2]Chart -16: Variation of Storey stiffeness for square model of diagrid and shear wall systems
Table -13: Storey
Stiffeness
for octagonal model of diagrid and shear wall systemsSTOREY STIFFENESSOF OCTAGON MODEL
DIAGRID SHEAR WALL
1276574.22 682281.864
2329171.883 1225767.506
3057814.288 1598031.976
3622642.647 1840932.314
4010301.487 2008314.808
4242696.258 2141661.066
4514593.213 2268418.127
4810998.964 2409357.18
[image:9.595.309.561.118.446.2]Chart -17: Variation of Storey stiffeness for octagonal model of diagrid and shear wall systems
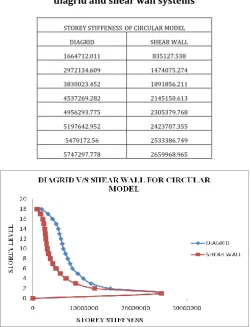
Table -14: Storey
Stiffeness
for circular model of diagrid and shear wall systemsSTOREY STIFFENESSOF CIRCULAR MODEL
DIAGRID SHEAR WALL
1664712.011 835127.538
2972134.609 1474075.274 3830023.452 1891856.211 4537269.282 2145150.613 4956293.775 2305379.768 5197642.952 2423707.355
5470172.56 2533386.749
5747297.778 2659968.965
Chart -18: Variation of Storey stiffeness for circular model of diagrid and shear wall systems
© 2017, IRJET | Impact Factor value: 5.181 | ISO 9001:2008 Certified Journal | Page 53
Chart -20: Variation of Storey stiffeness for shear wall systems
5.5 STOREY BASE SHEAR ANALYSIS:
[image:10.595.44.563.47.242.2]Base shear results are tabulated in the Tables and the respective Graph Nos. beneath the Table Nos.
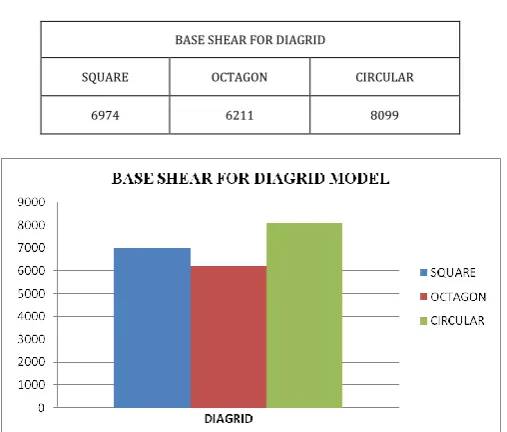
Table -15: Base Shear of diagrid systems
BASE SHEAR FOR DIAGRID
SQUARE OCTAGON CIRCULAR
6974 6211 8099
Chart -21: Variation of Base Shear in Seismic diagrid systems
Table -16: Base Shear of shear wall systems
BASE SHEAR FOR SHEAR WALL
SQUARE OCTAGON CIRCULAR
5327 4925.5495 6556
[image:10.595.318.549.306.528.2]Chart -22: Variation of Base Shear in Seismic shear wall systems
Table -17: Storey
Base shear
for square model of diagrid and shear wall systemsBASE SHEAR FOR SQUARE MODELS
DIAGRID SHEAR WALL
6974 5327
[image:10.595.36.290.361.577.2]Chart -23: Variation of Storey Base shear for square model of diagrid and shear wall systems
Table -18: Storey
Base shear
for octagonal model of diagrid and shear wall systemsBASE SHEAR FOR OCTAGON MODEL
DIAGRID SHEAR WALL
[image:10.595.65.259.649.711.2]© 2017, IRJET | Impact Factor value: 5.181 | ISO 9001:2008 Certified Journal | Page 54
[image:11.595.38.289.310.523.2]Chart -24: Variation of Base Shear for octagonal model of diagrid and shear wall systems
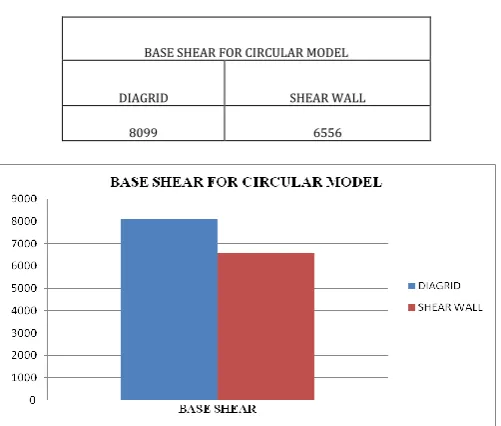
Table -19: Storey
Base shear
for circular model of diagrid and shear wall systemsBASE SHEAR FOR CIRCULAR MODEL
DIAGRID SHEAR WALL
8099 6556
Chart -25: Variation of Base Shear for circular model of diagrid and shear wall systems
6. CONCLUSIONS
The introduction of diagrid systems in tall structures is found to increase the seismic performance of the structure.
From the comparison of diagrid system with shear wall system it is found that the lateral displacements in diagrid models are much lesser than the shear wall models.
The lesser lateral displacements in diagrid shows the enhanced resistance of the buildings against lateral seismic force.
The storey drifts is also smaller value in model with diagrid system than shear wall system. Thus the diagonal elements of the diagrid effectively counter the drifts from earthquake forces.
The stiffness values of the diagrid models are also comparatively higher than the shear wall models. The diagrid models are stiff against vibrations due to seismic forces than the shear wall models.
The base shear values in diagrid models are higher than other models with shows higher seismic forces are acting on the diagrid models.
The time periods are less in diagrid system models. lesser values of the time period than shear wall models shows that diagrid models are less flexible against seismic vibrations.
REFERENCES
[1] Khalid K. Shadhan “Optimal diagrid angle to minimize drift in high-rise steel buildings subjected to wind loads”,International Journal of Civil Engineering and Technology (IJCIET),Volume 6, Issue 11, Nov 2015, pp. 01-10
[2] Lekshmi Mohan1, C.K.Prasad Varma Thampan2, “Numerical Modelling and Evaluation of Hybrid Diagrid Structures” International Journal of Research in Advent Technology (E-ISSN: 2321-9637), “TASC- 15”, June 2015 pp10-11.
[3] Raghunath .D. Deshpande1, Sadanand M. Patil2, Subramanya Ratan3 “Analysis and comparison of diagrid and conventional structural system” IRJET, Volume: 02 Issue: 03 June -2015.
[4] Harish Varsani 1, Narendra Pokar 2, Dipesh Gandhi3
“Comparative Analysis of Diagrid Structural System and Conventional Structural System for High Rise Steel Building” IJAREST ISSN(O):2393-9877, ISSN(P): 2394-2444,Volume 2,Issue 1, January- 2015..
[5] Nishith B. Panchal, Dr. V. R. Patel, Dr. I. I. Pandya, “Optimum Angle of Diagrid Structural System” IETR,ISSN: 2321-0869, Volume-2, Issue-6, June 2014
BIOGRAPHIES
Pavana v pursuing his M.Tech. in Civil Strutures from Government Engineering College, Haveri & obtained B.E. Civil from BIT Bangalore.