© 2017, IRJET | Impact Factor value: 5.181 | ISO 9001:2008 Certified Journal | Page 669
Design Optimization of Display Unit Supporting Structure under Static
and Spectrum Loads Using FEA
Mahesh B L
1, H S Manjunath
2, Vijay kumar V
3, Surekha A
41
Dept. Of Mechanical Engineering, Dr. Ambedkar Institute of Technology, Bengaluru, Karnataka, India
2Assistant Professor, Dept. Of Mechanical Engineering, Dr. Ambedkar Institute of Technology, Bengaluru,
Karnataka, India
3
HOD, Dept. Of Mechanical Engineering, East West Polytechnic, Bengaluru, Karnataka, India
4Lecture,Dept. Of Mechanical Engineering, GPT-Chennapatna, Karnataka, India
---***---Abstract -
Engineering components/assemblies aremounted over the supporting structures for its functionality. These supporting structures are subjected to various loads based on the type of application. Any failure in supporting structure results to malfunctioning of the mounted components. So the design considers the safety of the mounting platforms. Due to the advent of computer based numerical technology, virtual simulation can be effectively utilized to improve the safety of the assembly components and the stress condition can be estimated early before the actual production of the components. In the present work, a display unit support structure is modeled using a three dimensional modeling software and later imported to Hypermesh for quality meshing. The members are grouped to different components for later design optimization. Rigid body elements through mass elements are defined for load transfer. Initial analysis for the given load cases shows failure of some of the components for the given loading conditions. So design optimization through design optimizer module is carried out to improve the problem. Total of 7 design sets in the form of scalar parameters are represented along with 2 state variables which defines the limitation for structural safety. Weight is considered as the objective function with 0.1 kg as the convergence tolerance. Sub problem approximation technique is used to find the design sets. Total of 21 sets are obtained to find the design solution for the requirements. The results for both initial and final sets are represented.
Key Words: Engineering components, Malfunctioning, Virtual
simulation, three dimensional modeling software, Hypermesh, Design optimization, Design optimizer module.
1. INTRODUCTION
Stress analysis is very important part of design of engineering components. Every structure has its limiting value based on its internal material structure. Even this capacity is based on many loading parameters like temperature and uniformity and method of production. Based on the limiting values, the design should be carried out maintaining the structural safety. Many methods are available to find the structural condition of the problem. Main methods for structural analysis are as follows.
Continuum methods Experimental methods Numerical methods.
1.1 Continuum Methods
These methods are more accurate and are mainly based on mathematical integral formulae’s. For integration, the geometry of the problem should be defined with proper curve fitting function which consumes maximum time coding. Further continuum methods are classified to exact methods and approximate methods. Various exact methods are
Potential energy Method Stress function method Fourier equations
1.2 Numerical Methods
These are modification of exact or continuum methods. Based on the same principles of continuum with a difference of exact integration to partial integration, numerical methods are becoming more popular in the stress analysis techniques. Complex integration is simplified with grid type of structural geometrical calculations. It can easily accommodate changes in the geometry, loads and materials. Various numerical techniques are
Finite Difference method Finite Element Method Boundary Element Method Finite volume Method etc.
Various commercial and educational software’s are developed and these methods can be applied to various branches of engineering like
Automotive and Aerospace industry Medical Industry
Refrigeration and Air Conditioning Nano mechanics
© 2017, IRJET | Impact Factor value: 5.181 | ISO 9001:2008 Certified Journal | Page 670 Nuclear Engineering
Mechanical Engineering applications etc.
1.3 Experimental Methods
The usage of experimental methods is very essential for components with large production. At least few components need to be checked for practical testing conditions to know the nearness of numerical or continuum solution with practical solution. Various experimental techniques are
Spring balance Method Photo elastic method Strain Gauge method Load Cell techniques X-Ray Diffraction
Various coating techniques etc.
2. PROBLEM DEFINITION
Structural analysis for safety and design optimisation of a display unit mainly made of aluminium components is the main definition of the problem. The main objectives include
Geometrical Modelling of the Display unit Meshing and stress analysis
Design optimisation
2.1 Methodology
1. Geometrical Modelling of the problem 2. Meshing of the assembly with different
components based on uniform thickness
3. Analysis for static and spectrum loads in different directions
4. Capturing vonmises stress in the individual components
5. Design optimisation by variation of thickness of the assembly components.
2.2 Material
Material selected
Aluminium
Elastic Modulus
71Gpa
Poison’s ratio
0.3
Density
kg/m
7800
3.
Allowable stress
210 Mpa
Allowable factor of
safety
2
Table -1: Material properties
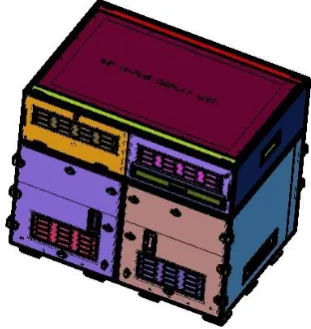
2.3 Geometrical Modelling of the Display Panel
The geometry is having one meter length with 0.7 m height along with transverse distance of 0.9 m. The geometry is built using three dimensional modelling software Solid works using sketcher, part modeller and assembler. It contains number of parts which are assembled at the appropriate places.
Fig -1: Geometrical Plot
2.4 Design Specifications
The structural assembly should with stand 800 kg load on the top of the panel.
The spectrum loads along longitudinal direction: 15g Lateral direction: 6g
Transverse Direction: 5g
2.5 Design Requirements
The structure should with standard the loads mentioned in 3.5. The deflection should not exceed 9mm and stress should not exceed allowable stress of 140Mpa leaving the standard parts.
2.6 Mesh Plot
[image:2.595.353.509.211.376.2]© 2017, IRJET | Impact Factor value: 5.181 | ISO 9001:2008 Certified Journal | Page 671 The figure-2 shows mesh of the system using Hypermesh.
The members are grouped based on the thickness specification and standard nature. All the standard parts are meshed using three dimensional solid elements as they doesn’t need design optimisation.
2.7
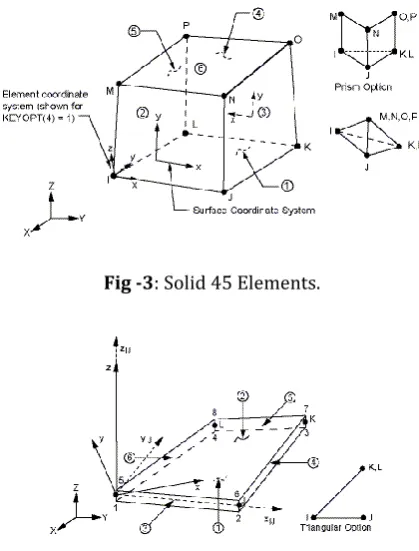
Element Types Used
The element is defined with 8 nodes in brick meshing and 4 nodes in tetrahedral meshing. Even it takes 6 nodes during prism type meshing. Brick meshing is more accurate compared to other type of meshing.
Fig -3: Solid 45 Elements.
Fig -4: Shell 63 Elements.
3.
RESULTS AND DISCUSSION
Structural analysis is the key aspect of finding the safety of the problem under various cases of loads. Vonmises is the most appropriate theory for failure prediction of ductile aluminium material. Various load cases considered for the problem are as shown below.
1. Self Weight Analysis alone 2. With external load of 800kg 3. With only longitudinal spectrum 4. With only lateral spectrum 5. With only transverse spectrum 6. Combination of all the loads
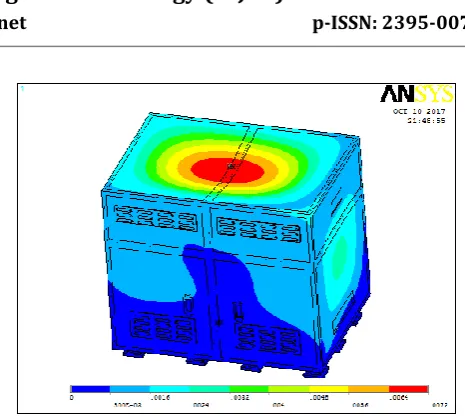
Fig -5: Deformation under self weight
The figure shows maximum deformation of 0.000223m or 0.223mm deformation due to self weight. This deformation is less than the allowed deformation of 9mm.
Fig -6: Deformation under ext. load + self weight (Maximum deformation is 1mm)
[image:3.595.323.556.84.253.2] [image:3.595.55.265.259.535.2] [image:3.595.325.565.328.477.2] [image:3.595.327.556.521.695.2]© 2017, IRJET | Impact Factor value: 5.181 | ISO 9001:2008 Certified Journal | Page 672
Fig -8: Deformation under Case 2 and Lateral Spectrum (Maximum Deformation is 4.5mm)
[image:4.595.44.278.291.446.2]Fig -9:Deformation plot under case2 and transverse spectrum
Fig -10: Deformation under all the Loads (Maximum deformation is 6mm)
The vonmises stress is represented for individual
components are as shown in the table below.Component
Number Vonmises Stress (Mpa)
1 306
2 1040
3 41.4
4 140
5 1320
6 39.2
7 66.8
Table -2: Stress development in non-standard parts
[image:4.595.321.543.330.482.2]The table shows components 1, 2 and 5 are subjected to heavy stresses which are higher than the allowable stress of the material. So these need to be optimised along with low stress members (Component 3, 6, 7) for even distribution of stress and maintaining the safety of the assembly for the given loads.
Fig -11: Design Convergence (Execution of design optimisation and convergence)
The figure shows convergence of sub problem approximation through design optimiser module execution. It shows set number 21 is converging to the requirements and showing a final weight of 113.82 kgs from the initial weight of 109.37kgs.
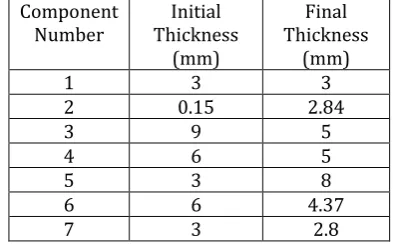
Component
Number Thickness Initial (mm)
Final Thickness
(mm)
1 3 3
2 0.15 2.84
3 9 5
4 6 5
5 3 8
6 6 4.37
7 3 2.8
[image:4.595.43.282.491.666.2] [image:4.595.334.531.603.726.2]© 2017, IRJET | Impact Factor value: 5.181 | ISO 9001:2008 Certified Journal | Page 673
Fig -12: Design Iterations to Vonmises Stress
The figure 4.23 shows drop of stress in the initial iterations itself and finally converging to the required value.
Fig -13: Vonmises Stress Vs Design Parameters
This figure helps in identifying the effect of design variables
on stress generation.3.1 Results Representation for Final Optimised
Structure:
[image:5.595.42.287.68.278.2]The figure 14 shows final deformation in the structure. The maximum deformation is 7.2mm (0.0072m) which is less then the allowable deformation of 9mm. So deformation
[image:5.595.317.549.308.479.2]Fig -14: Deformation in the final Optimised Structure
Fig -15: Vonmises stress in the final Optimised Structure
The figure 15 shows final vonmises stress in the assembly. Maximum stress is 210 and is equal to the allowable stress. So the assembly is safe for the given resultant loads.
Component Number
Initial Vonmises Stress
(Mpa)
Final Vonmises Stress After Design
Optimization
1 306 138
2 1040 210
3 41.4 36.4
4 140 131
5 1320 186
6 39.2 43.1
7 66.8 62
Table -4: Summary of Stress Results between Initial and Optimised sets
[image:5.595.37.283.351.533.2] [image:5.595.302.567.560.683.2]© 2017, IRJET | Impact Factor value: 5.181 | ISO 9001:2008 Certified Journal | Page 674 well below or equal to the allowable stress. So the assembly
will be safe for the given loading conditions.
4. CONCLUSIONS
The assembly is modelled using a three dimensional modelling software Solid works and imported to Hypermesh for meshing in ‘step’ file format.
Hypermesh is used to mesh the components appropriately with element size of 5mm. All the standard components are meshed with solid elements and non standard parts are meshed with shell elements. A mass element is created to distribute the external load to the supporting panels through RBE3 element connection.
The meshed finite element model is imported to Ansys software for further analysis in ‘inp’ file format for further analysis. The results are obtained after representation of different load steps for self weight, external load and spectrum in three different directions. The stresses in the nonstandard sections are represented for individual components.
The results shows stress exceeding allowable limits in certain components which need to be improved for safe working of the support structure. Design optimiser in Ansys is used after specifying 7 design variables, two state variables with weight as the objective function. Sub problem approximation is used to find the converged results.
Totally 21 sets are obtained for converged results. The final set shows the stress levels within the allowable limit of the problem for both deformation and stress. The individual component result also shows safety of the component for the given loads
REFERENCES
1. Duffin R.J. “Geometric Programming: Theory and Applications”, Wiley, New York, 1960
2. Morris A.J. “Foundations of Structural Optimisation: A Unified Approach”, John Wiley & Sons, Isted UK, 1960
3. Gettatly, “ A Procedure for Automated Minimum Weight Structural Design”, Aero Quart Part 1, vol 17, pp 332 -342, 1999
4. Jim Patterson, Hendrickson Trailer Suspension Systems, 2000
5. Hursha Narayan, Robert Bosch Corporation, 2002
6. Joe Metrisin, Florida Turbine Technologies, 2002
7. Arrora J. “Introduction to Optimum Design”, 2nded,
Academic Press, 2004