Development of Induction Motor Efficiency Model and
Improving at Low Load Condition using Controllers
D.Santhosh Kumar
Research scholarDept of Instrumentation Engineering Madras Institute of Technology,
Chennai-45
D.Manamalli, PhD.
Dept of Instrumentation EngineeringMadras Institute of Technology, Chennai-45
ABSTRACT
Induction motor is the electrical drives which are widely used in major industrial applications. Generally efficiency of the induction motor is poor at lower load condition. It is necessary to improve the efficiency for the better performance that is possible with the modeling of an induction motor. In this work the mathematical model of an Induction Motor is developed. From the parameters obtained from the model, efficiency can be. calculated from no load to full load condition considering all motor losses including Stray loss, Friction loss etc. Efficiency has been improved by using conventional and fuzzy optimization technique. The performance of developed induction motor model is analyzed with various parameters like torque, speed, current and various losses
.
Keywords:
Induction Motor, Mathematical Model, Losses calculation, Efficiency model, Fuzzy, PID1.INTRODUCTION
The utility of induction motor is more than 50% in the electrical energy generation worldwide. A small improvement in efficiency would significantly save the total electrical energy. Hence, it is important to optimize the efficiency of motor drive systems if significant energy savings are to be obtained. The induction motor (IM), especially the squirrel-cage type, is widely used in electrical drives and is responsible for most of the energy consumed by electric motors. The main objective of the project is to develop the mathematical model of an Induction Motor for calculating the efficiency from no load to full load condition. The efficiency of the induction motor must be analyzed deeply over the various operating regions. From the analysis, efficiency of the induction motor is less accurate over some operating region. This work involves only in obtaining the efficiency model of induction motor including all the losses for various load conditions. Generally efficiency of the motor will be poor at low load conditions. Induction motor cannot be operated at full load condition in all applications, for example traction, electric vehicle etc. In many applications efficiency optimization of induction motor (IM) which is the most used electrical motor presents an important factor of control especially for autonomous electrical traction. Induction motor is well explained in Bimal k. Bose(2003), Efficiency calculation model can be studied in the paper presented by Cui shumei, Liang chen, Song liwei(2008).
In this work, Section 2 explains the development of Mathematical model of Induction Motor using stator reference frame. Section 3 deals with Calculation of losses. Section 4 deals with the Determination of Efficiency Model. Section 5 Results and Analysis. Section 6 is the result of losses. Section 7is the results of controllers. Section 8 conclusion. .
2. DEVELOPMENT OF
MATHEMATICAL MODEL OF
INDUCTION MOTOR USING STATOR
REFERENCE FRAME
Induction motor model can be developed by using differential equations of the induction motor, there are six mathematical equations for developing the model of the induction motor
whichare as follows.
s ds r dr r s m qr r s r m sr r s s r r m dsaL
V
L
aL
PL
L
aL
R
L
i
L
aL
R
L
R
L
dt
di
2
2 2 2 2
1
s qs r qr r s m dr r s r m ds r s s r r m qsaL
V
L
aL
PL
L
aL
R
L
i
L
aL
R
L
R
L
dt
di
2
2 2 2 2
2 r qr dr r r ds r r m dr P L R i L R L dt d
2
3 r dr qr r r qs r r m qrP
L
R
i
L
R
L
dt
d
2
4
J
B
J
T
i
i
J
L
PL
dt
d
l rds qr qs dr r m
r
4
3
5
dr qs qr ds
r m
e
i
i
L
PL
dt
dT
4
3
6Where
i
ds- stator d-axis current,i
qs-stator q-axis current,dr
s
L
- Stator Inductance,a
- constant,R
r- Rotor resistance,B
- Friction coefficient,P
- No of poles, ,
r- Rotor speed, T-Developed Torque,Lm-magnetizing inductance
For developing induction motor model, vector model is the best way, because vector model decouples the interaction between the flux and torque. Normally, in dc separately excited motor flux and torque can be controlled independently because there is natural decoupling between the flux control quantity and torque controlling quantity. In construction wise armature and field windings are placed orthogonal to each other but in ac motor this is not there, so always there is a interaction between the stator current and rotor torque.
3. CALCULATION OF LOSSES
The following fig: 2.1 show the general Block Diagram of Induction motor. From which we can infer about loss occurring locations
Fig:1 Block Diagram of Induction Motor
Different types of losses present in Induction motor are
1. Core Loss (constant loss)
2. Copper Loss (I2R loss, Variable loss)
3. Friction and Windage Losses (Mechanical losses)
4. Stray loss
Total Loss = Pc+ Pcus+ Pcur +Pfw +Ps
3.1. Core loss
Core loss is a constant loss, i.e. it will not change when the load is changing the core loss of motor is directly proportional to supply voltage. The core loss of a induction motor is depends upon the frequency and the maximum flux density when the volume and thickness of the core lamination are given. The core loss can be reduced by reducing the supply voltage
Core Loss contain two components,
3.2. Eddy current loss
Eddy current loss is occurring due to flow of circulating current in the motor core, this circulating current can limited by laminating the motor core, the eddy current loss is occurring in the form of heat.Pe 2B2
f =operating frequency, B =Max.flux density.
3.3. Hysteresis loss
Hysteresis loss occurring due to the magnetic property of the core material, due to the saturation of the material hysteresis loss occurs in the form of heat.
Ph 1.6
For reducing the core loss we can adjust supply frequency and flux density and supply voltage, core loss occur due to flow of Iw(core loss current) through the R0(core loss resistance),the no load current of the motor is combination of the Iw+Iμ, when we reduce the magnetizing current by adjusting the voltage core loss also can be reduced
Nominal values,
For 1 to 10 HP motors,
1. Thickness of the lamination can be varying in between 0.3mm to 0.5 mm based on the motor ratings.
2. Flux density can be vary in between 0.3 wb/m2 to 0.45wb/m2
3.4. Copper Loss
Copper loss varies as a function of load current, whenever load applied to the motor is changed copper loss also will change, in squirrel cage induction motor normally turns ratios are taken as a 1, because due to short circuit on the rotor side rotor no of turns will replicate stator no of turns so in squirrel cage induction motor stator and rotor currents are considered as equal in magnitude. Due to this stator and rotor copper loss will be same in magnitude. Copper Loss contain two components they are,
3.4.1 Stator copper loss
Stator copper loss is directly proportional to the supply or stator current of motor, this stator current can be measured directly at stator side so calculation of this loss easier. When load is increasing load current also will increase so this copper loss also will increase.
Pcus=Is2*Rs
3.4.2 Rotor copper loss
Rotor copper loss is directly proportional to the rotor current, measurement of rotor current is not so easy like measurement of stator current so easiest way to measure rotor current is turns ratio, by means of turns ratio we can calculate rotor current. Rotor copper loss also can be calculated by calculating the slip value, rotor loss is also proportional to slip speed, when slip value is less rotor copper loss also will be low, controlling of speed is one way to reduce the rotor copper loss.
Pcur=Ir2*Rr
Total copper loss
Pcu= Is 2
Rs+Ir 2
Rr
Is− stator current.
Rs− stator resistance.
Ir − rotor current.
Rs – rotor resistance.
3.5. Friction and Windage Losses
the motor rotation. According to IEEE standard friction loss will be 1% of output power for 5HP motor. This standard value will vary based on based on the motor power rating.
3.6. Stray Loss
The stray loss could be calculated by the following way. Both the pulsation loss Pt and the harmonic loss PB are in proportion to the stator current I1. The surface loss is in proportion to the second power of the stator current. The sum of the pulsation loss and the harmonic loss equals almost the surface loss. So it is deduced that the sum of the pulsation loss and the harmonic loss and the surface loss are occupied respectively 50% of the total stray loss. Stray loss is combination of five losses,
Surface loss, Pulsation loss, Harmonic current loss of rotor part, Cross−path loss, Flux leakage loss.
Pst=Pstf*(Ist2/Istf2)
Pst =stray loss at operating load.
Pstf=stray loss at full load.
Ist=load current at operating load.
[image:3.612.331.549.116.211.2]Istf=load current at full load.
Figure .2. Power flow in Induction motor
4. DETERMINATION OF EFFICIENCY
MODEL
Performance of induction motor can be analyzed by calculating the efficiency of the motor, efficiency of the motor can be calculated by knowing the input and output to the motor. But when one of this parameter is unknown, that unknown parameter can be determined by calculating the loss of the motor.
In this work input power to the motor is unknown so by calculating output power and losses input power is calculated. Power factor of the motor is unknown and it will vary when the load is changing. Efficiency can be calculated by using the formula.
LOSSES
R
OUTPUTPOWE
POWER
OUTPUT
EFFICIENCY
Efficiency of the motor is varying with change in load
condition, when the applied load is low then the efficiency of
the motor also will be lower. when load is increasing efficiency
also will start to increase.
Block diagram for calculating efficiency from output power
and calculated losses is shown in Fig: 4.1
Fig .3. Efficiency calculation
5. RESULTS AND DISCUSSIONS
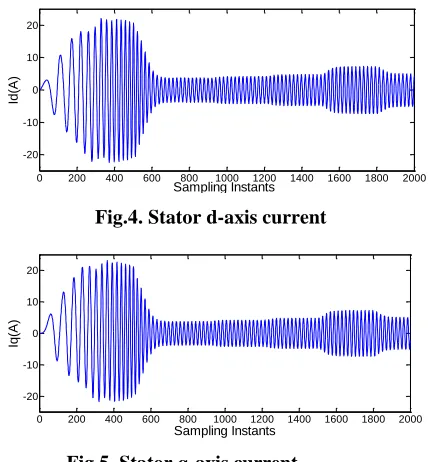
In the graph, up to 850 sampling instant motor starting condition, after 850 sampling instant only motor reaches it rated speed. V/F control has been applied for motor starting in order to reduce the starting current. Starting current of motor can be reduced further by reducing the step increase in V/F ratio. When V/F ratio is reduced starting time of motor will increase. For calculating motor parameters at different load condition load torque has been taken as load variable and it varied at different time instant. Variation in the load current, flux linkage, speed, developed torque has been plotted in the below figures. Variation in q-axis and d-axis current at various load condition is shown in fig 4 and 5
0 200 400 600 800 1000 1200 1400 1600 1800 2000 -20
-10 0 10 20
Sampling Instants
Id
(A
)
Fig.4. Stator d-axis current
0 200 400 600 800 1000 1200 1400 1600 1800 2000 -20
-10 0 10 20
Sampling Instants
Iq
(A
)
Fig.5. Stator q-axis current
[image:3.612.338.552.391.622.2]0 200 400 600 800 1000 1200 1400 1600 1800 2000 -2
-1 0 1 2
Sampling Instants
sa
i d
(wb
-t
u
rn
s)
Fig.6. Rotor d-axis flux linkage
0 200 400 600 800 1000 1200 1400 1600 1800 2000 -2
-1 0 1 2
Sampling Instants
sa
i q
(wb
-t
u
rn
s)
Fig.7. Rotor q-axis flux leakage
When the load is increasing motor speed will start to reduce. The reduction in the motor speed is plotted in fig8. Here low loads only applied so reduction in speed will be less.
0 200 400 600 800 1000 1200 1400 1600 1800 2000 0
500 1000 1500
Sampling Instants
S
p
e
e
d
(RP
M
)
Fig.8. Motor speed
0 50 100 150 200 0
10 20 30 40
Sampling Instants
to
rq
u
e
(N
-m
)
Fig.9. Developed torque
Developed torque of the motor is plotted in the fig.9.Output power of the motor can be calculated from the speed and torque of the motor. The output power of the motor has shown in the fig.10
0 200 400 600 800 1000 1200 1400 1600 1800 2000 0
500 1000 1500 2000 2500 3000 3500 4000
Sampling Instants
o
u
tp
u
t
p
o
we
r(
wa
tt
s)
Fig.10. Output power of the motor
6. LOSS CALCULATION
Motor associated losses can be calculated from the motor parameters like current, maximum flux density, operating frequency. Here stator and rotor copper losses are calculated for per phase value of current. For total copper loss its need to be multiply with no of phases. stator copper loss is shown in the fig11 and rotor copper loss is shown in the fig5.9 for variation in the load. Total copper loss is addition of stator and rotor copper loss. Total copper loss is shown in the fig.13.
0 500 1000 1500 2000 0
500 1000 1500
st
a
to
r
cu
lo
ss(
W
a
tt
s)
Sampling Instants
Fig.11. Stator copper loss
0 200 400 600 800 1000 1200 1400 1600 1800 2000 0
200 400 600 800 1000
Ro
to
r
cu
lo
ss(
W
a
tt
s)
Sampling Instants
Fig.12. Rotor copper loss
0 200 400 600 800 1000 1200 1400 1600 1800 2000 0
500 1000 1500 2000 2500
T
o
ta
l cu
lo
ss(
W
a
tt
s)
Sampling Instants
Core loss is combination of eddy current and hysteresis loss. Both the losses are function of the maxi. flux density and operating frequency. In this work V/F control is applied at starting of motor so both the flux density and frequency will be increased gradually upto rated speed. Upto rated speed core loss will increase, after reaching rated speed it will become constant irrespective with load condition. Eddy current is shown in the fig14.
[image:5.612.336.555.93.337.2]0 200 400 600 800 1000 1200 1400 1600 1800 2000 0 20 40 60 80 100 E d d y cu rr e n t lo ss( W a tt s) Sampling Instants
Fig.14. Eddy current loss
0 200 400 600 800 1000 1200 1400 1600 1800 2000 0 20 40 60 80 100 Hyste re sis lo ss( W a tt s) Sampling Instants
Fig.15. Hysteresis loss
[image:5.612.64.280.162.513.2]0 200 400 600 800 1000 1200 1400 1600 1800 2000 0 50 100 150 Co re lo ss( W a tt s) Sampling Instants
Fig.16. Core loss
Hysteresis loss is shown in the fig15
Core loss is shown in fig16 .Stray loss of the motor is varying when the load is varying. Stray loss is the function of load current. Variation in the stray loss is shown in the fig17
0 200 400 600 800 1000 1200 1400 1600 1800 2000 0 50 100 150 S tr a y lo ss( W a tt s) Sampling Instants
Fig.17. stray loss
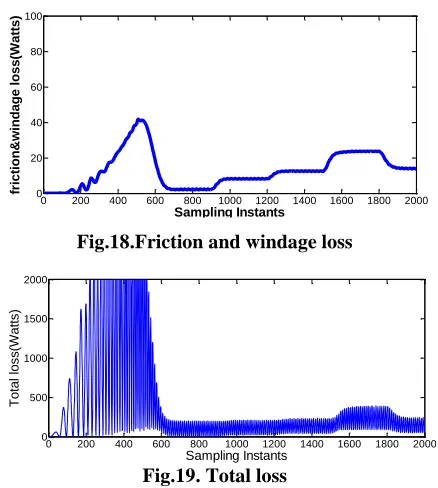
Friction and windage losses increase with respect to output power of the motor. Because output power of the motor is function of speed so when speed increase friction and
opposition of the air also will increase. Friction and windage loss is shown in the fig18
0 200 400 600 800 1000 1200 1400 1600 1800 2000 0 20 40 60 80 100 Sampling Instants fr ic ti o n &wi n d a g e l o s s (W a tt s )
Fig.18.Friction and windage loss
0 200 400 600 800 1000 1200 1400 1600 1800 2000 0 500 1000 1500 2000 T o ta l lo ss( W a tt s) Sampling Instants
Fig.19. Total loss
Total loss of the motor is shown in the fig19. In this work input power is unknown so it calculated from the output power and calculated losses. Input power to the motor is plotted in the fig20
[image:5.612.340.554.396.500.2]0 200 400 600 800 1000 1200 1400 1600 1800 2000 0 1000 2000 3000 4000 5000 In p u t p o we r( W a tt s) Sampling Instants
Fig.20. Input power
Efficiency of the motor can be calculated from output power and input power. In this work efficiency of the motor is calculated for variation in the load but here variation in load is less than the half of the rated load so efficiency is low. Same model can be used to find efficiency upto full load condition.
[image:5.612.340.549.571.695.2]0 200 400 600 800 1000 1200 1400 1600 1800 2000 0 20 40 60 80 100 E ff ici e n cy( % ) Sampling Instants
[image:5.612.65.280.572.681.2]
7.
METHODS FOR EFFICIENCY
IMPROVEMENT
Efficiency has been improvement in two methods
1. Conventional method using PID.
2. Fuzzy optimization technique.
7.1 Conventional method
Normally efficiency can be improved in two methods,
1. Power factor improvement method ( for low load condition)
2. Constant speed control method (for higher load condition)
At the low load condition the major part of the loss is core loss, the core loss of the motor can be reduced by reducing the magnetizing current of the motor. Cause for core loss is magnetic saturation of the motor windings. If the supply voltage to the motor is reduced at low load condition, the reactive current taken by the motor will be reduced and real current will be increased in order to make apparent current remains same and the power factor also increases. But voltage should not be reduced below certain limit
Fig.22.Indirect vector control scheme
Fig.23. Magnetizing current component
Fig.24. core loss current component
Fig.25. Power factor
Fig.26. Speed of the motor
Fig.27. Efficiency in conventional control
8. FUZZY LOGIC CONTROL SCHEME
:
The fuzzy logic is an aggregation of rules, based on the input state variables condition with a corresponding desired output. According to the optimization principle, two input variables are considered torque current component Ids and its integral square variation. The output of the fuzzy controller is the no load I0, which is calculated to minimize iron losses. A simplified block diagram of the optimization procedure is depicted in Fig28.
Fig.28
.fuzzy control scheme
Fig.29. magnetizing current component
Fig.30. core loss current component
Fig.31. Speed of the motor
Fig.32. Efficiency in fuzzy control
9. PERFORMANCE ANALYSIS OF
CONVENTIONAL AND FUZZY
CONTROLLER
The following table shows the performance of conventional controller as well as performance of fuzzy optimization where fuzzy controller acting in supervisory mode and PID in regulatory mode.
PARAMET ER
CONVENTI ONAL CONTROLL ER
FUZZY
OPTIMIZATIO N
SUPPLY VOLTAGE
430 V 408 V
STATOR D-AXIS CURRENT
3A 2.7A
POWER FACTOR
0.7 0.74
MAGNETI ZING CURRENT
2.2 to 1.54 2.2 to 1.54
CORE LOSS COMPON ENT
0 to 1.6 0 to 1.64
EFFICIEN CY
60% 62.5%
10.CONCLUSION
The efficiency model of the induction motor is developed by modeling the induction motor using vector model. From the
developed induction motor model, output
parameters(current,flux linkage,speed and torque) are obtained. By using those output parameters various losses of induction motor are calculated. In that Core loss is calculated using maximum flux density from flux linkage and copper loss from output current. The output power and calculated losses of the motor gives the Input power thereby efficiency of the induction motor is calculated at lower load conditions. Using conventional and Fuzzy optimization techniques efficiency is improved by minimizing losses. From the simulation results it is proved that in the efficiency maximization, fuzzy controller has better performance than conventional controller.
11. REFERENCES
[1] Murat Barut, Seta Bogosyan, MetinGokasan “Speed-sensorless Estimation for Induction motor using Extended kalman Filters “ IEEE Transactions on industrial electronics,Vol. 54, No. 1,Feb 2007
[2] Vilas N.Ghate, Sanjay V.Dudul and G.M.Dhole “Generalized model of three phase induction Motor for fault analysis” IEEE Region 8 , Sibircon 2008
[3] Cui shumei, Liang chen, Song liwei “ Study On efficiency calculation model of induction
[4] motor for electrical vehicles” IEEE Vehicle Power and Propulsion Conference (VPPC), September 3-5, 2008
[5] G.K. Singh and S. A. S. Al Kazzaz, “Induction machine drive condition monitoring andm diagnostic research – a survey,” Electric Power Systems Research, vol. 64, no. 2, pp.145–158,2003
[6] Jawad Faiz and M.B.B. Sharifian “Optimum Design of a Three phase Squirrel cage Induction motor based on Efficiency maximization“vol.21,No. 5,pp 367−373,1995.
[7] I.Daut, K. Anayet, M. Irwanto, N.Gomesh, M. Muzhar, M.Asri, Syatirah “Parameter calculation of 5 HP Induction motor”2009
[8] Bimal k.Bose “ Modern power electronics and ac drives ” Pearson education, Third edition 2003,pp 29-94,333-430
[9] B. L. Theraja, A. K Theraja “ A Text book of Electrical Technology” vol II, S.Chand Publications
[10]T.P. Blanchett a, G.C. Kember a,*, R. Dubay b “PID gain scheduling using fuzzy logic” ISA Transactions 39 (2000).
[11]Leehter Yao and Chin-Chin Lin “Design of Gain Scheduled Fuzzy PID Controller” World Academy of Science, Engineering and Technology 1 2005