www.hydrol-earth-syst-sci.net/15/91/2011/ doi:10.5194/hess-15-91-2011
© Author(s) 2011. CC Attribution 3.0 License.
Earth System
Sciences
Evaluation of global continental hydrology as simulated by the
Land-surface Processes and eXchanges Dynamic Global
Vegetation Model
S. J. Murray1, P. N. Foster1, and I. C. Prentice1,2,3
1QUEST, School of Earth Sciences, Wills Memorial Building, University of Bristol, Queens Road, Bristol, BS8 1RJ, UK 2Department of Biological Sciences, Macquarie University, North Ryde, NSW 2109, Australia
3Grantham Institute of Climate Change, and Division of Biology, Imperial College, Silwood Park, Ascot, SL5 7PY, UK
Received: 22 June 2010 – Published in Hydrol. Earth Syst. Sci. Discuss.: 6 July 2010 Revised: 5 January 2011 – Accepted: 10 January 2011 – Published: 13 January 2011
Abstract. Global freshwater resources are sensitive to changes in climate, land cover and population density and distribution. The Land-surface Processes and eXchanges Dynamic Global Vegetation Model is a recent development of the Lund-Potsdam-Jena model with improved represen-tation of fire-vegerepresen-tation interactions. It allows simulta-neous consideration of the effects of changes in climate, CO2concentration, natural vegetation and fire regime shifts
on the continental hydrological cycle. Here the model is assessed for its ability to simulate large-scale spatial and temporal runoff patterns, in order to test its suitability for modelling future global water resources. Comparisons are made against observations of streamflow and a composite dataset of modelled and observed runoff (1986–1995) and are also evaluated against soil moisture data and the Palmer Drought Severity Index. The model captures the main features of the geographical distribution of global runoff, but tends to overestimate runoff in much of the Northern Hemisphere (where this can be somewhat accounted for by freshwater consumption and the unrealistic accumulation of the simulated winter snowpack in permafrost regions) and the southern tropics. Interannual variability is represented reasonably well at the large catchment scale, as are seasonal flow timings and monthly high and low flow events. Further improvements to the simulation of intra-annual runoff might be achieved via the addition of river flow routing. Overes-timates of runoff in some basins could likely be corrected by the inclusion of transmission losses and direct-channel evaporation.
Correspondence to: S. J. Murray
1 Introduction
Interactions between vegetation and hydrology operate on micro to macro scales. For example, it is well established that vegetation regulates runoff at the macro scale via interception (Winsemius et al., 2005; Murray, 2011), changes in albedo (Mylne and Rowntree, 1992), transpiration (Levis et al., 2000) and land cover change (Bosch and Hewlett, 1982; Foley et al., 2005; D’Almeida et al., 2007). Influencing runoff at the micro level are reductions in stomatal conduc-tance in response to increasing atmospheric carbon dioxide concentrations, resulting in a greater carbon dioxide intake per unit of water transpired (Gedney et al., 2006). This physiological effect has been proposed to account for a 6% increase in mean global runoff since pre-industrial times (Betts et al., 2007). However, its importance has been con-tested, as the physiological effects of carbon dioxide could lead to compensating increases in leaf area index (LAI) (Piao et al., 2007; Huntington, 2008). DGVMs attempt to resolve such discrepancies by quantifying the various competing processes and allowing them to work together. The extent to which they do so correctly can only be evaluated through extensive comparison with observations.
This paper aims to evaluate the macro-hydrological per-formance of a leading DGVM of intermediate complexity – LPX (Land-surface Processes and eXchanges: Prentice et al., 2011). LPX is one of the most recent developments from the LPJ model (Sitch et al., 2003) with improved hydrology as introduced by Gerten et al. (2004). We compare simulated runoff fields against observations of global streamflow and an independent composite, model-adjusted runoff dataset.
Previous and complementary versions of LPJ have been evaluated with regard to carbon storages and fluxes (Sitch et al., 2003), soil moisture (Wagner et al., 2003), crop phenology (Bondeau et al., 2007) and hydrology (Gerten et al., 2004; Rost et al., 2008). Comparative evaluations of LPX and several other DGVMs, including two versions of LPJ, are underway for seasonal, interannual and interdecadal indicators of carbon cycling, water cycling and remotely sensed green vegetation cover (E. M. Blyth et al., personal communication, 2010). LPJ has been shown to perform reasonably well in comparison to similar models at both the basin scale (thirteen US basins; Gordon et al., 2004) and the global scale (Cramer et al., 2001). Gerten et al. (2004) reported that runoff and evaporation agree well with comparable hydrological models, although considerable discrepancies in runoff estimation persisted in some regions, particularly in the tropics.
2 Methods
2.1 The LPX model
LPX simulates global biospheric dynamics through process-based representations of biogeochemical and biogeophysical processes at the land surface at 0.5◦spatial resolution, using
nine plant functional types (PFTs). An in-depth discus-sion of carbon allocation and vegetation establishment was presented by Sitch et al. (2003) in LPJ, while terrestrial biosphere parameter uncertainties have been considered by Zaehle et al. (2005). Gerten et al. (2004) detailed the hydrological process representations, which are summarised here.
2.1.1 Runoff generation, interception and soil moisture storage
Runoff is determined on a daily basis, as net precipitation (after interception) minus transpiration from two fixed-depth soil layers (upper 0.5 m; lower 1.0 m) and surface evapo-ration from the top soil layer (Sitch et al., 2003; Gerten et al., 2004). Precipitation is determined as snow below 0◦C air temperature, which melts at the following rate
(Beer et al., 2007):
M=(1.5+0.007·P )·T (1)
whereMis daily snowmelt (mm day−1),P is monthly pre-cipitation in mm (stochastically distributed to approximate daily values; Prentice et al., 2011) andT is air temperature
>0◦C. Daily interception canopy storage is a function of precipitation, LAI, daily phenology and biome. There is no built-in river routing algorithm, as in LPJmL (LPJ-managed Lands; Rost et al., 2008) so any runoff generated is assumed to reach the basin outlet at the end of each model day. Surface and subsurface runoff are distinguished via determination of water in surplus to field capacity for each soil layer. Soil moisture is the water remaining after daily transpiration, evaporation, infiltration and runoff have been accounted for. Water percolating through the lower soil layer is assumed to contribute to subsurface runoff, the rate of which is a function of soil texture, moisture and depth. This water flux is summed along with surface and subsurface runoff for use in this evaluation.
2.1.2 Evaporation and transpiration
Potential evaporation is calculated based on the Priestley-Taylor equation (Priestley and Priestley-Taylor, 1972; Hobbins et al., 2001) through net radiation and temperature. Transpiration is the lesser of an atmospheric demand term (which combines potential evaporation and surface conductance, following Monteith, 1995) and a soil/plant moisture supply term (a maximal rate determined by plant hydraulic properties, re-duced as a function of declining soil moisture content). Where water is not supply limited, stomatal conductance is governed by photosynthesis rate, and CO2concentration and
2.1.3 Wildfires
Aside from the version of Climate Research Unit (CRU) input data used (CRU TS 3.0 c.f. CRU05; New et al., 2000), the main distinctions between LPX and LPJ of Gerten et al. (2004) concern its wildfire innovations. Consistent with experimental observations of humans pre-empting, rather than exacerbating, the natural fire regime (e.g. Higgins et al., 2007), anthropogenically-induced ignitions have been removed from the model (Prentice et al., 2011). Fire ignition probability is also now also dependent on monthly wet-day frequency and fuel drying follows a modified relationship between litter moisture, mass, surface area (fixed for three fuel classes) and the Nesterov fire danger index, rather than a simple assumed desiccation-fuel class relationship (Prentice et al., 2011). Litter decomposition is now also resolved daily, rather than annually, which has been shown to improve the timing of seasonal fire regime simulations in herbaceous or shrubby vegetation in the presence of fine fuels (Prentice et al., 2011).
Fire is known to play an important role in determining vegetation distribution, type and density, and thus has sub-sequent effects on hydrology in the affected region (e.g. Shakesby and Doerr, 2006).
2.2 Evaluation techniques
2.2.1 Comparison with the Palmer Drought Severity Index (PDSI)
LPX annual and monthly runoff is compared to the Palmer Drought Severity Index (PDSI; Palmer 1965). The PDSI is a hybrid index based on antecedent precipitation, moisture supply and demand (following Thornthwaite, 1948; Dai et al., 2004). The index is most effective on an annual basis, while interpretation of monthly soil moisture values for northern latitudes requires caution due to the exclusion of snow accumulation and potential evaporation being assumed (according to Thornthwaite, 1948). However, the PDSI has been shown to correlate with soil moisture content during warm seasons in Illinois and Eurasia, and streamflow from large global catchments (Dai et al., 2004). Regional-scale studies of recent and historical droughts have been conducted using the PDSI (e.g. Karl, 1986; Lloyd-Hughes and Saun-ders, 2002; Fye et al., 2003; Ntale and Gan, 2003), while Dai et al. (1998) also used this index to estimate the influence of the El Ni˜no-Southern Oscillation on global variability in wet and dry periods.
2.2.2 Comparison with high flows and indicators of drought
Basin sums of monthly LPX runoff, Global Runoff Data Centre (GRDC; http://grdc.bafg.de/) observed streamflow (converted to mm/month) and CRU TS 3.0 precipitation
are used to assess the simulation of hydrological and me-teorological drought respectively. Agricultural or ecolog-ical drought is evaluated using gravimetric soil moisture observation point data from the Global Soil Moisture Data Bank (GSMDB; Robock et al., 2000) for river catchments in Russia. Data are available for the upper 1m soil layer of natural grass plots of ∼0.1 ha for 1978–1985. These have been formed by averaging four measurement points in each plot every ten days during the growing season and once per month during winter (Robock et al., 2000). Monthly means have subsequently been created for each of the Amur (based on 11 soil moisture stations), Lena (17 stations) and Ob (13 stations) catchments. It should be noted however, that soil moisture content is inherently heterogeneous through space, and thus the values presented should be interpreted with necessary caution. This study applies these data as a means of assessing the relative timing of agricultural drought compared to other drought indices.
2.3 Data
A global gridded model-observation composite dataset and two river discharge observation datasets are used to evaluate LPX simulated runoff, in addition to estimates of freshwater consumption.
Global observations of monthly runoff are relatively sparse and discrepancies in monitoring frequency, quality and tech-nique combine to make it difficult to synthesise such data in a common format and assess their reliability. One source of global gridded runoff is a product of the International Satel-lite Land-Surface Climatology Project, Initiative II (ISLSCP II) project: the University of New Hampshire-Global Runoff Data Centre (UNH-GRDC) Composite Global Runoff Fields (Fekete et al., 1999; Fekete et al., 2002). This represents a combination of climate-driven water balance runoff model (WBM) outputs and GRDC observed river discharge obser-vations for the period 1986–1995, on a monthly basis at 0.5◦
resolution. Observations account for 72% of the actively discharging (>3mm year−1) global land area (Fekete et al., 2002). River discharge measured at a point and WBM-simulated runoff are disaggregated between pre-defined in-terstation domains and corrected according to observations (Fekete et al., 2002). Monthly outputs are adjusted via annual corrections to account for mistimings in intra-annual runoff which may arise as a result of storage in excess of a month (Fekete et al., 1999).
Fig. 1. Global Mean Annual Runoff as simulated by LPX for 1951–
2000 (and also with WaterGAP freshwater consumption incorpo-rated), compared to ISLSCP II composite runoff dataset for 1986– 1995, Dai et al. (2009) converted river discharge observations and CRU global mean annual precipitation.
1998; Dingman, 2001), these data should still offer a solid alternative against which to benchmark simulated runoff, with the advantage of being independent of any model.
A dataset of monthly river discharge for 1948–2004 from 925 global rivers, accounting for∼73% of global streamflow (Dai et al., 2009) is used to evaluate LPX interannual vari-ability in runoff. Data are predominantly composed of obser-vations from GRDC, University of New Hampshire (UNH) and National Center for Atmospheric Research (NCAR) archives. Where gaps in the time-series or unmonitored regions exist, these are infilled by using nearby gauges and a linear regression equation for each river, using flow input values from the Community Land Model, version 3 (CLM3; Oleson et al., 2004).
Water consumption is based on the 0.5◦gridded estimates
of the Global Water Use (GWU) model nested within Water-GAP 2 (Water – Global Assessment and Prognosis; Alcamo et al., 2003). The GWU model is composed of domestic, industrial and agricultural sector sub-models which are used to determine total water withdrawals and consumption (the latter being important here in reducing LPX runoff esti-mates). Water consumption is determined as losses from the immediate water environment by means such as evaporation, transpiration, crop irrigation, incorporation into products and crops, and human and livestock consumption (Alcamo et al., 2007). Livestock water demands are assumed to equal their total consumption, while transpiration of irrigated water is assumed to occur at its potential rate (Alcamo et al., 2003).
2.4 Model set-up
A spin-up period was used to initialise the model, which was forced with input variables detrended using the lowess technique (see Prentice et al., 2011, for more details). The 1948–2000 period was recycled using detrended CRU and NCEP data at 286 ppm CO2 and 1850 HYDE croplands
(Klein Goldewijk et al., 2007), until the fifty year means of all carbon pools varied by<2% for each grid cell. LPX was subsequently run for 1850–2006, forced with 0.5◦ monthly gridded fields of air temperature, precipitation, wet day frequency and cloud cover fraction from the CRU TS 3.0 archive (e.g. Mitchell and Jones, 2005), detrended prior to 1901 (using CRU TS 2.1), along with global annually varying CO2 concentrations (Etheridge et al., 1996; IPCC,
2001) and nine fixed soil texture types (Zobler, 1986). The monthly inputs were stochastically disaggregated to form daily values. Fractional sunshine hours data range from 1901–2002, with 1997–1998 formed of monthly means from the previous thirty years and beyond 2002 composed of converted sun hour observations and synthetic data derived from daily temperature ranges. Wet day data are determined from a combination of station measurements and synthetic wet days derived from precipitation, while being entirely synthetically-derived from precipitation from 1990 onwards.
3 Results
3.1 Key features and data-model comparisons 3.1.1 Trend
LPX simulated runoff shows a decrease of 0.42 mm year−1
(t= 181, p≈ 0) through the period 1951–2000 (Fig. 1). Simulated variations in global runoff over the 20th century compare well with the reconstruction of Dai et al. (2009), in terms of most interannual variability features and the pres-ence of a decreasing trend for 1951–2000 being captured. However, the trend as simulated by LPX is steeper than in the Dai et al. (2009) data set.
The trend of the CRU terrestrial precipitation data used here shows little overall change for 1951–2000 (−0.0025 mm year−1). Downward trends in runoff as shown in the Dai et al. (2009) data set, and as simulated by LPX, therefore must have other causes, such as CO2-induced
increasing leaf area index (Piao et al., 2007) in part con-tributing to increased transpiration fluxes. Increasing CO2
might also be enhancing woody cover in the tropics and subtropics at the expense of C4 grasses (e.g. Bond and Midgley, 2000), resulting in increased transpiration as the woody plants access deeper soil water stores.
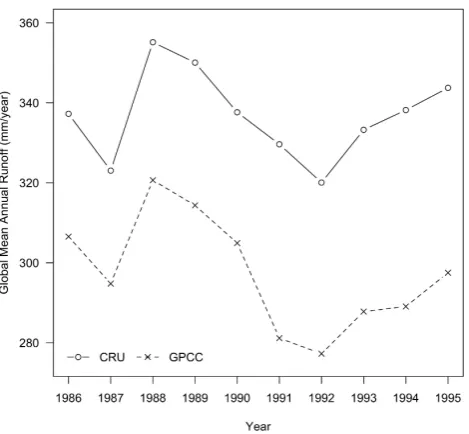
Fig. 2. Comparison of LPX global mean annual runoff for 1986–
1995 using CRU TS 3.0 and GPCC precipitation input data.
is broadly consistent with the findings of, for example, Gerten et al. (2008), Milliman et al. (2008) and Dai et al. (2009) for 1951–2000 and appears to be consistent with CRU precipitation during much of this period (Fig. 1). This is despite the weight of evidence suggesting a net increase in global runoff during the 20th century as a whole (e.g. Labat et al., 2004; Huntington, 2006; Piao et al., 2007; Syed et al., 2010), although there are regional discrepancies (e.g. Aizen et al., 1997; D´ery and Wood, 2005). Precipitation is shown to be a key driver of runoff and exhibits high interannual and interdecadal variability, which generates similar variability in the global runoff regime. These findings also largely reflect those of Milliman et al. (2008) for the same period, thus demonstrating the non-linearity associated with the trend of a supposed acceleration of the global hydrological cycle. 3.1.2 Interannual variability
LPX tracks the interannual variability of the composite global mean and Dai reconstructions very well, although the absolute values of runoff are overestimated by between 65– 88 mm year−1 and 33–76 mm year−1 respectively, probably at least in part due to water abstractions not considered in the DGVM. The interannual variability in runoff appears to be explained largely via changes in precipitation for LPX (r= 0.56; p≈0), Dai reconstructions (r= 0.50; p≈0), and the ISLSCP II composite (r= 0.71;p= 0.02).
3.1.3 Comparison to other models
LPX performs well when related to other similar models for simulation performance, using the Willmott Index of
Agree-ment (Willmott, 1982). This is a metric of simulation quality based on the mean and variance of the outputs compared to their associated observations, whereby 1 = perfect agreement between simulations and observations, and 0 = complete dis-agreement. When tested for interannual variability against the Dai reconstructions and ISLSCP II composite data, LPX scores 0.98 and 0.92 respectively compared to a range of 0.89 (for Gerten-LPJ) to 0.92 (‘Model 2’) as reported in Gerten et al. (2004). The global mean absolute deviation (bias) for LPX is 60 mm year−1for the Dai reconstructions and 74 mm year−1 for ISLSCP II, compared to a range of −1471 (‘Model 1’) to 442 mm year−1 (‘Model 3’) for 663 catchments. LPX total global annual runoff averaged for the period 1961–1990 is 56865 km3year−1from a land area of 128×106km2, compared to 37288 km3year−1for Dai et al. (2009) from an area of 117×106km2(Dai and Trenberth, 2002), and 37075 km3year−1from an area of 112×106km2
for the ISLSCP II composite data. Incorporation of total global annual freshwater consumption of 1341 km3year−1 (as simulated by WaterGAP averaged for the period 1961-1990 results in a revised estimate of 55524 km3year−1. Previous estimates range from 36055 km3(Syed et al., 2010) to∼45500 km3 (Cogley, 1991) while Gerten et al. (2004) estimated total runoff as being 40143 km3. LPX thus predicts total global annual runoff in excess of previous estimates, which appears to be a product of differences in the pre-cipitation input data. For example, CRU TS 3.0 shows 32 mm year−1(not shown) greater mean annual precipitation than similarly-uncorrected ISLSCP II Global Precipitation Climatology Centre (GPCC; Rudolf et al., 1994; Schneider et al., 2008) data for congruent 0.5◦grid cells during 1986–
1995. The outcome of this input discrepancy in terms of LPX runoff is highly similar interannual variability, but a CRU mean annual bias of 39 mm year−1relative to GPCC precip-itation (Fig. 2), thus demonstrating the need for constraint of data input uncertainties (see Fekete et al., 2004; Biemans et al., 2009).
3.1.4 Global runoff distribution
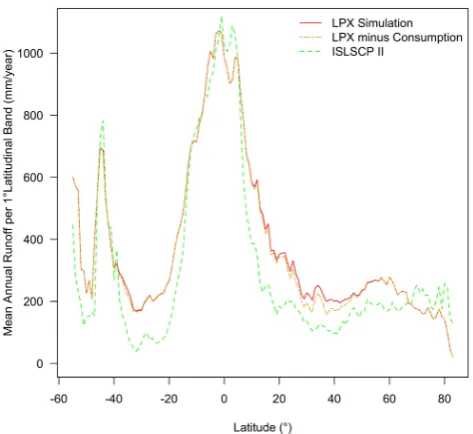
LPX captures the global runoff distribution well, but has a general tendency to overestimate runoff magnitude, partic-ularly in the tropics and throughout much of the Northern Hemisphere, while underestimations are typical surrounding the equator (Fig. 3). These discrepancies are most likely related to precipitation biases, particularly in regions which are affected by the undercatch of snow. The findings de-scribed here compare favourably to similar studies by Sitch et al. (2003) and Gerten et al. (2004) with regard to the relative magnitudes of runoff across latitudinal domains.
Fig. 3. Mean Global Annual Runoff Distribution for the period
1986–1995 per 1◦ latitudinal band as simulated by LPX and as represented by the ISLSCP II composite dataset. Freshwater consumption is based on WaterGAP estimates.
It should be acknowledged that a greater proportion of streamflow observations exist in Europe, North America, South America and parts of western Africa, where the river gauge network density is highest (Fekete et al., 2002). ISLSCP II runoff data inherently incorporate freshwater demands in such regions and thus represent a more suitable runoff comparator. Uncertainty in runoff evaluation is greater in regions where ISLSCP II runoff is model-generated, and particularly where population densities are high, due to the omission of such water withdrawals.
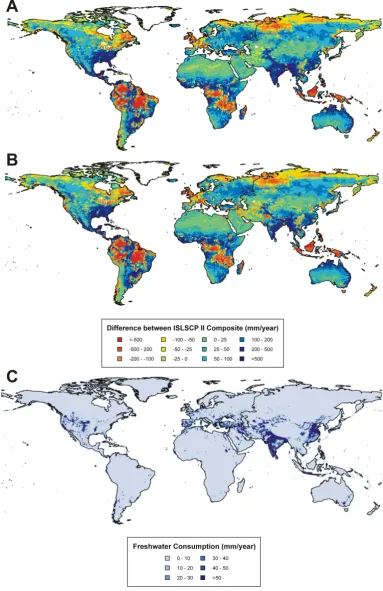
LPX shows considerable overestimations of annual runoff throughout much of Central and Northern America, parts of South America, the tropics of Africa, south and eastern Asia and eastern Europe (Fig. 4a). Underestimations are largely restricted to equatorial regions, central Europe, the UK, and the northernmost latitudes. LPX best represents annual runoff in the Sahel, central and western Asia, parts of North America, south-western South America and southern Australia. These findings are generally consistent with those of Gerten et al. (2004) using LPJ, with improvements apparent in the north-west of North America and some parts of semi-arid northern Africa.
When including freshwater consumption (Fig. 4b and c), LPX shows a reduction in the overestimates for regions of Europe, the USA and southern and eastern Asia. Some parts of India and the Lower Nile river, where runoff is overestimated by LPX, are shown to be underestimated when consumption is incorporated. This is a product of consumed water being removed from accumulated discharge in reality, whereas here it is reduced on a per-grid cell basis. This
suggests the need for incorporation of flow routing or study at the catchment scale (see subsequent sections), particularly where consumption is high.
3.1.5 Interannual variability at the catchment scale
Fig. 4. (A) – Difference in LPX mean annual runoff (mm year−1) from the ISLSCP II composite dataset for the period 1986–1995.
(B) – Difference in mean annual runoff for LPX and ISLSCP II (1986–1995) with mean annual freshwater consumption incorporated
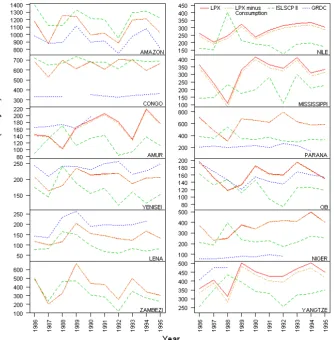
[image:7.595.105.489.67.659.2]Fig. 5. Interannual variability in mean annual runoff for twelve selected catchments as represented by LPX, the ISLSCP II composite data
and, where available, GRDC disaggregated river discharge observations. LPX simulated runoff with WaterGAP freshwater consumption is also shown.
latitude catchments, Gerten et al. (2004) note a deficit in comparison to observations (for a differing time period and using CRU05 precipitation), which is attributed to under-catch of snow in high-latitude precipitation data, and the simplistic model representation of snow accumulation and melt.
3.1.7 Comparison of LPX with high and low flow observations
The reliable forecasting of droughts is critical to all simula-tions of global water resources. Unlike flooding, the defi-nition of drought is not agreed, due to differing perceptions of water shortage magnitude and duration between regions (e.g. Dracup et al., 1980). Broadly one can distinguish mete-orological drought (shortages of precipitation), hydrological drought (shortages of runoff and/or streamflow), agricultural or ecological drought (soil moisture shortages) and socio-economic drought (a shortage of water to support consump-tive economic demand) (Keyantash and Dracup, 2002). This
section focuses on the simulation of the physical forms of drought and the application of hydrological statistics to assess high and low flows. LPX summed total catchment monthly runoff is compared against GRDC runoff-equivalent monthly river discharge (GRDC, 2007) for a selection of large catchments on a per-event basis.
Fig. 6. Summed monthly catchment runoff averaged for 1986–1995 as represented by LPX, the ISLSCP II composite data and GRDC
disaggregated mean monthly river discharge observations converted to runoff equivalent. Also shown are CRU TS 3.0 monthly summed precipitation observations. Basins shown on the map are associated with the graph of the same colour border.
(Fig. 7; r= 0.87; p≈0), but again, while low flow timings are modelled well, event magnitudes are consistently under-estimated. Overall however, peak and low flow timings are generally well captured for the catchments tested (although might be improved further with the addition of river routing), and successful simulations of flow magnitudes are shown.
In order to assess the ability of the model to capture the magnitude of potential floods and varying forms of drought, statistical metrics are used as a means to characterise high and low flows. Low flow frequency (the number of months ≤5% of January 1978 to December 1985 mean flow) and high flow frequency (the number of months≥95%) metrics are applied to each variable for each basin (Table 1). LPX appears capable of capturing all forms of physical high flows (with the exception of soil moisture in cases where observa-tions are limited). Low flows are reasonably well captured (although their frequency tends to be underestimated), with hydrological ‘droughts’ simulated most accurately.
Table 1. Monthly high and low flow frequencies of summed monthly LPX runoff, GRDC river discharge, CRU TS 3.0 precipitation and
mean GSMDB soil moisture for three Russian catchments between January 1978 and December 1985. Low flow frequency is determined as the number of months≤5% of January 1978 to December 1985 mean flow, and high flow frequency as the number of months≥95%.
Runoff River Precipitation Soil
Discharge Moisture
High Low High Low High Low High Low
Amur 1 53 4 71 3 72 46 95
Lena 1 40 1 43 1 80 42 95
Ob 1 52 1 68 2 89 2 93
0 20000 40000 60000 80000 LPX GRDC MISSISSIPPI 0 10000 20000 30000 40000 YANGTZE 0 20000 40000 60000 80000 100000 120000
1970 1971 1972 1973 1974 1975 1976 1977 1978 1979 1980
YENISEI
Summed Monthly Runoff (mm/month)
[image:10.595.49.287.224.461.2]Year
Fig. 7. Total summed monthly catchment LPX runoff versus GRDC
runoff equivalent river discharge for the Mississippi, Yangtze and Yenisei catchments (1970–1979).
3.1.8 Global flow timings
At the individual cell scale, LPX has a slight propensity towards late prediction of global peak intra-annual flow (mean difference of ∼2 days compared to the composite dataset, in contrast to∼1 month early with the former version of LPJ: Gerten et al., 2004), although there are notable regional differences (Fig. 9a, b and c). This improvement may be a result of differences in the input data or process representations. The Sahel, Arabian Peninsula, central North America, central Asia and parts of central Africa are most poorly captured, due to the difficulty associated with discern-ing non-routed monthly runoff maximums in consistently dry climates (and especially since the extremities of the annual hydrographs are dampened due to the absence of channel evaporation and transmission loss processes from the model).
0 20000 40000 60000 80000 100000 120000 ● ● ●● ● ● ●● ● ●● ● ● ● ● ● ● ●●● ● ●● ● ● ● ●● ● ● ● ●● ● ● ● ● ● ● ● ● ● ● ● ● ● ● ● ● ● ● ● ● ●● ● ● ● ● ● ● ● ● ● ● ●● ●● ● ● ● ● ● ● ● ● ● ● ● ● ● ● ● ● ● ● ● ● ●● ● ● ● ● ●
● LPX Runoff
GRDC River Discharge GSMDB Soil Moisture CRU TS 3.0 Precipitation
AMUR 0 20000 40000 60000 80000 100000 120000 ● ● ● ● ● ● ● ● ● ● ● ● ● ● ● ● ● ● ●● ● ● ● ● ● ● ● ● ● ● ● ● ● ● ● ● ● ● ● ● ● ● ● ● ● ● ● ● ● ● ● ● ● ● ● ● ● ● ● ● ● ● ● ● ● ● ●● ● ● ● ● ● ● ● ● ● ● ●● ● ● ● ● ● ● ● ● ● ● ● ● ● ● ● ● LENA 0 20000 40000 60000 80000 100000 120000 ● ● ● ● ● ● ● ●● ● ● ● ● ● ● ● ● ● ● ● ● ● ● ● ● ● ● ● ● ● ●● ● ● ● ● ● ● ● ● ● ● ● ● ● ● ● ● ● ● ● ● ● ● ● ● ● ● ● ● ● ● ● ● ● ● ●●● ● ● ● ● ● ● ● ● ● ● ● ● ● ● ● ● ● ● ● ● ● ● ● ●● ● ● OB
1978 1979 1980 1981 1982 1983 1984 1985
Year
Monthly Summed Runoff, River Discharge, Precipitation (all mm/month) and Mean Soil Moisture (mm x
10
[image:10.595.310.546.230.466.2]4/month)
Fig. 8. Monthly summed catchment LPX runoff, CRU TS 3.0
pre-cipitation, GRDC river discharge (all mm month−1) and Global Soil Moisture Data Bank (GSMDB) soil moisture (mm×104/month) for the Amur, Lena and Ob catchments between January 1978 and December 1985.
Aside from these notable exceptions, the maximum month of runoff is generally well simulated for most of the Northern Hemisphere.
3.2 Comparison of LPX to the Palmer Drought Severity Index (PDSI)
A
B
C
Fig. 9. (A) – Month of maximum runoff as simulated by LPX. (B) – Month of maximum runoff for as represented by the ISLSCP II
[image:11.595.104.493.67.678.2]Fig. 10. Global mean annual Palmer Drought Severity Index (PDSI)
versus LPX global mean annual runoff and soil moisture (from both soil layers) and CRU global mean precipitation.
cases. LPX runoff (r= 0.49; p= 0.001) replicates the PDSI trend much better than precipitation alone (r=−0.0009;
p= 0.995). Soil moisture can also be used as a drought indicator. LPX soil moisture shows a decreasing trend, although to a much lesser degree than the runoff and PDSI trends. The interannual variability matches the PDSI well for some years, but is out of phase by up to three years in others (r= 0.22;p= 0.13, perhaps as a result of large-scale variations in annual snowmelt rates (Dai et al., 2004).
4 Discussion and conclusions
LPX is able to adequately capture the global distribution of runoff, interannual and seasonal runoff variability at the continental and catchment scale, and represents high and low flows reasonably well in large catchments. Several factors can induce a lag in the arrival of water at the catchment outlet (Kuhl and Miller, 1992; Costa and Foley, 1999), highlighting the need to include water routing in this DGVM, as has been done for LPJmL (e.g. Rost et al., 2008). Some overestima-tions (particularly between∼30–45◦N) can to some extent
be accounted for by water consumption. However, errors in the precipitation data (e.g. Fekete et al., 2004; Biemans et al., 2009) may also be involved. Widespread overestimation of runoff may also be attributed in part to LPX underestimating global rainfall interception (Murray, 2011), while the exclu-sion of water withdrawals from LPX (and some hydrological models) often leads to overestimation of runoff in highly populated catchments (e.g. D¨oll et al., 2009).
Wet and dry periods are represented reasonably well through comparison of runoff at the global scale to the PDSI. In addition, high and low flow events are generally simulated well for the Mississippi, Yangtze and Yenisei, and flow event timings are generally captured very well. The incorporation of a glacial mass-balance component and a realistic permafrost melt routine (e.g. Beer et al., 2007) into this version of the DGVM may bring further improvements.
LPX, in common with many hydrological models (e.g. D¨oll et al., 2003) is unable to reproduce the interannual and seasonal peak in runoff observed in semi-arid catchments such as the Nile and Niger. These rivers are unusual cases, in that beyond a point, discharge decreases with distance downstream. For example, approximately half of the Nile’s annual flow is lost from the Sudd marshes via evaporation (including that directly from the channel) and transmission losses (Ibrahim, 1984). Commonly overlooked in global hy-drological modelling, transmission losses must be considered in order for simulations to perform well in dry catchments.
Further improvement of the hydrological element of LPX will require the inclusion of water consumption, a flow routing scheme, and the representation of transmission and direct-channel evaporation losses (particularly in semi-arid regions). While LPX hydrology is simulated at least as well as previous developments of LPJ, such additions to this version of the DGVM should produce a step-change improvement to global runoff modelling and will facilitate the application of LPX as a tool for flood and drought prediction.
Acknowledgements. We are grateful to Dieter Gerten and an
anonymous reviewer for their constructive comments on this manuscript. S. J. Murray is the beneficiary of a doctoral grant from the AXA Research Fund. This research is also supported by the European Union Sixth Framework Programme project Hydrogen, Methane, Nitrous Oxide (HYMN), the NERC programme Quantifying and Understanding the Earth System (QUEST) and the European Union Seventh Framework project Comprehensive Modelling of the Earth System for Better Climate Prediction and Projection (COMBINE).
Edited by: F. Pappenberger
References
Aizen, V. B., Aizen, E. M., Melack, J. M., and Dozier, J., Climatic and hydrologic changes in the Tien Shan, Central Asia, J. Clim., 10, 1393–1404, 1997.
Alcamo, J., Fl¨orke, M., and M¨arker, M.: Future long-term changes in global water resources driven by socio-economic and climatic changes’, Hydrolog. Sci. J., 52(2), 247–275, 2007.
Arnell, N. W.: The effect of climate change on hydrological regimes in Europe: a continental perspective, Global Environmental Change, 9, 5–23, 1999.
Arneth, A., Sitch, S., Bondeau, A., Butterbach-Bahl, K., Foster, P., Gedney, N., de Noblet-Ducoudr´e, N., Prentice, I. C., Sanderson, M., Thonicke, K., Wania, R., and Zaehle, S.: From biota to chemistry and climate: towards a comprehensive description of trace gas exchange between the biosphere and atmosphere, Biogeosciences, 7, 121–149, doi:10.5194/bg-7-121-2010, 2010. Beer, C., Lucht, W., Gerten, D., Thonicke, K., and Schmullius, C.: Effects of soil freezing and thawing on vegetation carbon density in Siberia: a modeling analysis with the Lund-Potsdam-Jena Dynamic Global Vegetation Model (LPJ-DGVM), Global Biogeochem. Cyc., 21, GB1012, doi:10.1029/2006GB002760, 2007.
Betts, R. A., Boucher, O., Collins, M., Cox, P. M., Falloon, P. D., Gedney, N., Hemming, D. L., Huntingford, C., Jones, C. D., Sexton, D. M. H., and Webb, M. J.: Projected increase in continental runoff due to plant responses to increasing carbon dioxide, Nature, 448, 1037–1042, 2007.
Biemans, H., Hutjes, R. W. A., Kabat, P., Strengers, B. J., Gerten, D., and Rost, S.: Effects of precipitation uncertainty on discharge calculations for main river basins, J. Hydrometeorol., 10, 1011– 1025, 2009.
Bond, W. J. and Midgley, G. F.: A proposed CO2-controlled
mechanism of woody plant invasion in grasslands and savannas, Glob. Change Biol., 6(8), 865–869, 2000.
Bondeau, A., Smith, P., Z¨ahle, S., Schaphoff, S., Lucht, W., Cramer, W., Gerten, D., Lotze-Campen, H., M¨uller, C., Reichstein, M., and Smith, B.: Modelling the role of agriculture for the 20th century, Glob. Change Biol., 13, 679–706, 2007.
Bosch, J. M. and Hewlett, J. D.: A review of catchment experiments to determine the effect of vegetation changes on water yield and evapotranspiration, J. Hydrol., 55, 3–23, 1982.
Chin, E. H., Skelton, J., and Guy, H. P.: The 1973 Mississippi River basin flood: compilation and analysis of meteorologic, streamflow and sediment data, US Geological Survey Profes-sional Paper 937, 137 pp., 1975.
Cogley, J. G.: GGHYDRO – Global Hydrographic Data Release 2.0, Department of Geography, Trent University, 1991.
Costa, M. H. and Foley, J. A.: Trends in the hydrologic cycle of the Amazon basin, J. Geophys. Res., 104, 14189–14198, 1999. Cramer, W., Bondeau, A., Woodward, F. I., Prentice, I. C., Betts,
R. A., Brovkin, V., Cox, P. M., Fisher, V., Foley, J. A., Friend, A. D., Kucharik, C., Lomas, M. R., Ramankutty, N., Sitch, S., Smith, B., White, A., and Young-Molling, C.: Global response of terrestrial ecosystem structure and function to CO2and climate change: Results from six dynamic global vegetation models, Glob. Change Biol., 7, 357–373, 2001.
Dai, A. and Trenberth, K. E.: Estimates of freshwater discharge from continents: latitudinal and seasonal variations, J. Hydrom-eteorol., 3, 660–687, 2002.
Dai, A., Trenberth, K. E. and Qian, T.: A global data set of Palmer Drought Severity Index for 1870–2002: relationship with soil moisture and effects of surface warming, J. Hydrometeorol., 5, 1117–1130, 2004.
Dai, A., Qian, T., and Trenberth, K. E.: Changes in continental freshwater discharge from 1948 to 2004, J. Clim., 22, 2773– 2792, 2009.
Dai, A. G, Trenberth, K. E., and Karl, T. R.: Global variations in droughts and wet spells: 1900–1995, Geophys. Res. Lett., 25, 3367–3370, 1998.
D’Almeida, C., V¨or¨osmarty, C. J., Hurtt, G. C., Marengo, J. A., Dingman, S. L. and Keim, B. D.: The effects of deforestation on the hydrological cycle in Amazonia: a review on scale and resolution, Int. J. Climatol., 27, 633–647, 2007.
D´ery, S. J. and Wood, E. F.: Decreasing river discharge in northern Canada, Geophys. Res. Lett., 32, L10401, doi:10.1029/2005GL022845, 2005.
Deutsch, M. and Ruggles, F.: Optical data processing and projected applications of the ERTS-1 imagery covering the 1973 Missis-sippi river valley floods, J. Am. Water Resour. As., 10(5), 1023– 1039, 1974.
Dingman, S. L.: Physical Hydrology, Prentice-Hall, Englewood Cliffs, N. J., 2001.
D¨oll, P., Kaspar, F., and Lehner, B.: A global hydrological model for deriving water availability indicators: model tuning and validation, Journal of Hydrology, 270, 105–134, 2003.
D¨oll, P., Fiedler, K., and Zhang, J.: Global-scale analysis of river flow alterations due to water withdrawals and reservoirs, Hydrol. Earth Syst. Sci., 13, 2413–2432, doi:10.5194/hess-13-2413-2009, 2009.
Dracup, J. A., Lee, K. S., and Paulson, E. G. Jr.: On the definition of droughts, Water Resour. Res., 16(2), 297–302, 1980. Elshamy, M. E. and Wheater, H. S.: Performance assessment
of a GCM land surface scheme using a fine-scale calibrated hydrological model: an evaluation of MOSES for the Nile Basin, Hydrological Processes, 23, 1548–1564, 2009.
Etheridge, D., Steele, L., Langenfelds, R., Francey, R., Barnola, J.-M., and Morgan, V.: Natural and anthropogenic changes in atmospheric CO2over the last 1000 years from air in Antarctic
ice and firn, J. Geophys. Res., 101, D2, 4115–4128, 1996. Fekete, B. M., V¨or¨osmarty, C. J., and Grabs, W.: Global, Composite
Runoff Fields Based on Observed River Discharge and Simulated Water Balances, GRDC Report 22, Global Runoff Data Center, Koblenz, Germany, 1999.
Fekete, B. M., V¨or¨osmarty, C. J., and Grabs, W.: High resolution fields of global runoff combining observed river discharge and simulated water balances, Global Biogeochem. Cyc., 16(3), doi:10.1029/1999GB001254, 2002.
Fekete, B. M., V¨or¨osmarty, C. J., Roads, J. O., and Willmott, C. J.: Uncertainties in precipitation and their impacts on runoff estimates, J. Clim., 17(2), 294–304, 2004.
Foley, J. A., DeFries, R., Asner, G. P., Barford, C., Bonan, G., Carpenter, S. R., Chapin, F. S., Coe, M. T., Daily, G. C, Gibbs, H. K., Helkowski, J. H., Holloway, T., Howard, E. A., Kucharik, C. J., Monfreda, C., Patz, J. A., Prentice, I. C., Ramankutty, N., and Snyder, P. K.: Global consequences of land use, Science, 309, 570–574, 2005.
Fye, F. K., Stahle, D. W., and Cook, E. R.: Paleoclimatic analogs to twentieth-century moisture regimes across the United States, B. Am. Meteorol. Soc., 84, 901–909, 2003.
Gedney, N., Cox, P. M., Betts, R. A., Boucher, O., Huntingford, C., and Scott, P. A.: Detection of a direct carbon dioxide effect in continental river runoff records, Nature, 439, 835–838, 2006. Gerten, D., Schaphoff, S., Haberlandt, U., Lucht, W., and Sitch,
S.: Terrestrial vegetation and water balance – hydrological evaluation of a dynamic global vegetation model, J. Hydrol., 286, 249–270, 2004.
L20405, doi:10.1029/2008GL035258, 2008.
Global Runoff Data Centre: Major river basins of the world, GRDC in the Bundesanstalt fuer Gewaesserkunde, 56068 Koblenz, Ger-many, http://grdc.bafg.de, 2007.
Gordon, W. S., Famiglietti, J. S., Fowler, N. L., Kittel, T. G. F., and Hibbard, K. A.: Validation of simulated runoff from six terrestrial ecosystem models: results from VEMAP, Ecol. Appl., 14, 527–545, 2004.
Higgins, S. I., Bond, W. J., February, E. C., Bronn, A., Euston-Brown, D. I. W., Enslin, B., Govender, N., Rademan, L., O’Regan, S., Potgieter, A. L. F., Scheiter, S., Sowry, R., Trollope, L., and Trollope W. S. W.: Effects of four decades of fire manipulation on woody vegetation structure in savanna, Ecology, 88, 1119–1125, 2007.
Hobbins, M. T., Ram´ırez, J. A., and Brown, T. C.: The complemen-tary relationship in estimation of regional evapotranspiration: an enhanced advection-aridity model, Water Resour. Res., 37, 1389–1403, 2001.
Huntington, T. G.: Evidence for intensification of the global water cycle: review and synthesis, J. Hydrol., 319, 83–95, 2006. Huntington, T. G.: CO2-induced suppression of transpiration
can-not explain increasing runoff, Hydrological Processes, 22, 311– 314, 2008.
Ibrahim, A. M.: The Nile: Description, hydrology, control and utilisation, Hydrobiologia, 110, 1, 1–13, 1984.
IPCC: Appendix II – SRES Tables’, in: Climate Change 2001: The Scientific Basis. Contribution of Working Group I to the Third Assessment Report of the Intergovernmental Panel on Climate Change, edited by: Houghton, J. T., Ding, Y., Griggs, D. J., Noguer, M., van der Linden, P. J., Dai, X., Maskell, K., and Johnson, C. A., Cambridge University Press, Cambridge, UK and New York, NY, USA, 881 pp., 2001.
Karl, T. R.: Sensitivity of the Palmer Drought Severity Index and Palmer’s Z-index to their calibration coefficients including potential evapotranspiration, J. Clim. Appl. Meteorol., 25, 77– 86, 1986.
Keyantash, J. and Dracup, J. A.: The quantification of drought: an evaluation of drought indices, Bu. Am. Meteorol. Soc., 83, 1167– 1180, 2002.
Klein Goldewijk, K., van Drecht, G., and Bouwman, A.: Mapping contemporary global cropland and grassland distributions on a 5×5 min resolution’, Journal of Land Use, Science, 2(3), 167– 190, 2007.
Kucharik, C. J., Foley, J. A., Delire, C., Fisher, V. A., Coe, M. T., Lenters, J. D., Young-Molling, C., Ramankutty, N., Norman, J. M., and Gower, S. T.: Testing the performance of a dynamic global ecosystem model: water balance, carbon balance, and vegetation structure, Global Biogeochem. Cy., 14, 3, 795–825, 2000.
Kuhl, S. C. and Miller, J. R.: Seasonal river runoff calculated from a global atmospheric model, Water Resour. Res., 28, 2029–2039, 1992.
Labat, D., Godd´eris, Y., Probst, J. L., and Guyot, J. L.: Evidence for global runoff increase related to climate warming, Adv. Water Resour., 27, 631–642, 2004.
Lehner, B., D¨oll, P., Alcamo, J., Henrichs, T., and Kaspar, F.: Estimating the impact of global change on flood and drought risks in Europe: a continental, integrated analysis, Clim. Change, 75, 273–299, 2006.
Levis, S., Foley, J. A., and Pollard, D.: Large-scale vegetation feedbacks on a doubled CO2climate, J. Clim., 13, 1313–1325,
2000.
Lloyd-Hughes, B. and Saunders, M. A.: A drought climatology for Europe, Int. J. Climatol., 22, 1571–1592, 2002.
Milliman, J. D., Farnsworth, K. L., Jones, P. D., Xu, K. H., and Smith, L. C.: Climate and anthropogenic factors affecting river discharge to the global ocean, 1951–2000, Global Planet. Change, 62, 187–194, 2008.
Mitchell, T. D. and Jones, P. D.: An improved method of construct-ing a database of monthly climate observations and associated high-resolution grids, Int. J. Climatol., 25(6), 693–712, 2005. M¨uller, C., Bondeau, A., Lotze-Campen, H., Cramer, W., and
Lucht, W.: Comparative impact of climatic and nonclimatic factors on global terrestrial carbon and water cycles, Global Biogeochem. Cy., 20, GB4015, doi:10.1029/2006GB002742, 2006.
Murray, S. J.: Trends in 20th century global rainfall interception as simulated by a Dynamic Global Vegetation Model: Implications for global water resources, J. Hydrol., in review, 2011.
Mylne, M. F. and Rowntree, P. R.: Modelling the effects of albedo change associated with tropical deforestation, Clim. Change, 21, 1573–1480, 1992.
New, M., Hulme, M., and Jones, P.: Representing twentieth-century space-time climate variability. Part II: development of 1901–96 monthly grids of terrestrial surface climate, J. Climate, 13(13), 2217–2238, 2000.
Ngo-Duc, T., Laval, K., Ramillien, G., Polcher, J., and Cazenave, A.: Validation of the land water storage simulated by Organising Carbon and Hydrology in Dynamic Ecosystems (ORCHIDEE) with Gravity Recovery and Climate Experiment (GRACE) data, Water Resour. Res., 43, W04427, doi:10.1029/2006WR004941, 2007.
Ntale, H. K. and Gan, T. Y.: Drought indices and their application to East Africa, Int. J. Climatol., 23, 1335–1357, 2003.
O’Connor, J. E. and Costa, J. E.: The world’s largest floods, past and present: their causes and magnitudes, US Geological Survey Circular 1254, 13 pp., 2004.
Oleson, K. W., Dai, Y., Bonan, G., Bosilovich, M., Dickinson, R., Dirmeyer, P., Hoffman, F., Houser, P., Levis, S., Niu, G.-Y., Thornton, P., Vertenstein, M., Yang, Z.-L., and Zeng, X.: Technical description of the Community Land Model (CLM), NCAR Technical Note NCAR/TN-4611STR, 186 pp., 2004. Piao, S., Friedlingstein, P., Ciais, P., de Noblet-Ducoudr´e, N., Labat,
D., and Zaehle, S.: Changes in climate and land use have a larger direct impact than rising CO2on global river runoff trends,
Proceedings of the National Academy of Sciences of the United States of America, 104, 15242–15247, 2007.
Prentice, I. C., Kelley, D. I., Foster, P. N., Friedlingstein, P., Harrison, S. P., and Bartlein, P. J.: Fire variability and the terrestrial carbon balance, Global Biogeochem. Cy., in revision, 2011.
Priestley, C. H. B. and Taylor, R. J.: On the assessment of surface heat flux and evaporation using large-scale parameters, Mon. Weather Rev., 100, 81–92, 1972.
Rantz, S. E.: Measurement and Computation of Streamflow: Vol-ume 2. Computation of Discharge, water-supply paper, 2175, US Geological Survey, Reston, VA, 1982.
S. E., Speranskaya, N. A., Liu, S., and Namkhai, A.: The Global Soil Moisture Data Bank, Bu. Am. Meteorol. Soc., 81, 1281– 1299, 2000.
Rost, S., Gerten, D., Bondeau, A., Lucht, W., Rohwer, J., and Schaphoff, S.: Agricultural green and blue water consumption and its influence on the global water system, Water Resour. Res., 44, W09405, doi:10.1029/2007WR006331, 2008.
Rudolf, B., Hauschild, H., Rueth, W., and Schneider, U.: Terrestrial precipitation analysis: operational method and required density of point measurements, in: Global Precipitations and Climate Change, edited by: Desbois, M. and Desalmond, F., NATO ASI Series I, vol. 26, Springer-Verlag, 173–186, 1994.
Schneider, U., Fuchs, T., Meyer-Christoffer, A., and Rudolf, B.: Global precipitation analysis products of the GPCC, Global Pre-cipitation Climatology Centre (GPCC), Deutscher Wetterdienst, Offenbach am Main, Germany, 2008.
Shakesby, R. A. and Doerr, D. A.: Wildfire as a hydrological and geomorphological agent, Earth-Sci. Rev., 74(3–4), 269–307, 2006.
Sitch, S., Smith, B., Prentice, I. C., Arneth, A., Bondeau, A., Cramer, W., Kaplan, J. O., Levis, S., Lucht, W., Sykes, T. M., Thonicke, K., and Venevsky, S.: Evaluation of ecosystem dynamics, plant geography and terrestrial carbon cycling in the LPJ dynamic global vegetation model, Glob. Change Biol., 9, 161–185, 2003.
Syed, T. H., Famiglietti, J. S., Chambers, D. P., Willis, J. K. and Hilburn, K.: Satellite-based global-ocean mass of interannual variability and emerging continental freshwater discharge, P. Natl. A. Sci. India. A., 107(42), 17916–17921, 2010.
Thornthwaite, C. W.: An approach toward a rational classification of climate, Geogr. Rev., 38, 55–94, 1948.
Wagner, W., Scipal, K., Pathe, C., Gerten, D., Lucht, W., and Rudolf, B.: Evaluation of the agreement between the first global remotely sensed soil moisture data with model and precipitation data, J. Geophys. Res., 108(D19), 4611, doi:10.1029/2003JD003663, 2003.
Willmott, C. J.: Some comments on the evaluation of model performance, B. Am. Meteorol. Soc., 63, 1309–1313, 1982. Winsemius, H. C., Savenije, H. H. G., Gerrits, A. M. J., Zapreeva,
E. A., and Klees, R.: Comparison of two model approaches in the Zambezi river basin with regard to model reliability and identifi-ability, Hydrol. Earth Syst. Sci., 10, 339–352, doi:10.5194/hess-10-339-2006, 2006.