
Hydrol. Earth Syst. Sci., 15, 759–769, 2011 www.hydrol-earth-syst-sci.net/15/759/2011/ doi:10.5194/hess-15-759-2011
© Author(s) 2011. CC Attribution 3.0 License.
Hydrology and
Earth System
Sciences
Remotely sensed latent heat fluxes for model error diagnosis:
a case study
J. M. Schuurmans1,*, F. C. van Geer2, and M. F. P. Bierkens1,2
1Department of Physical Geography, Faculty of Geosciences, Utrecht University, P.O. Box 80115, 3508 TC Utrecht, The Netherlands
2Deltares, P.O. Box 80015, 3508 TA Utrecht, The Netherlands
*now at: DHV B.V., P.O. Box 1132, 3800 BC Amersfoort, The Netherlands
Received: 22 June 2010 – Published in Hydrol. Earth Syst. Sci. Discuss.: 25 August 2010 Revised: 12 February 2011 – Accepted: 15 February 2011 – Published: 4 March 2011
Abstract. This study shows that remotely sensed ETact is useful in hydrological modelling for the procedure of model calibration and shows it potential to update soil moisture predictions. Comparison of modeled and remotely sensed ETact together with the outcomes of our data assimilation procedure points out potential model errors, both concep-tual and flux-related. Assimilation of remotely sensed ETact results in a realistic spatial adjustment of soil moisture, ex-cept for the area where the model suffers from conex-ceptual errors (forest with deep groundwater levels). By using op-erational (i.e. available for community in practice) data and models we aim to show the potential and limitations of using remotely sensed ETact in the practice of hydrological mod-elling. We use satellite data of both ASTER and MODIS for the same two days in the summer of 2006 that, in associ-ation with the Surface Energy Balance Algorithm for Land (SEBAL), provides us the spatial distribution of daily ETact. The model, used by the local water board, is a physically based distributed hydrological model of a small catchment (70 km2) in The Netherlands that simulates the water flow in both the unsaturated and saturated zone. Model outcomes of ETact show values that are at least 20% lower than those estimated by SEBAL, which is due to the fact that different evapotranspiration methods are used. The spatial pattern of ETact from the hydrological model resembles the soil map, whereas the ETactfrom SEBAL resembles the land use map. As both ASTER and MODIS images were available for the same days, this study provides an opportunity to compare the worth of these two satellite sources. It is shown that,
Correspondence to: J. M. Schuurmans ([email protected])
although ASTER provides better insight in the spatial dis-tribution of ETact due to its higher spatial resolution than MODIS, they appeared in this study just as useful.
1 Introduction
Accurate prediction of spatially-distributed soil moisture with high spatial resolution is helpful for optimizing irriga-tion applicairriga-tion, hydrological drought forecasting and the as-sessment of catchment wetness for flood control. Physically based spatial distributed hydrological models have the po-tential to provide this insight. As more spatially-distributed information about land surface characteristics becomes avail-able and computer capacity increases, the distributed hy-drological models are also developed at higher spatial res-olutions (Bergstr¨om and Graham, 1998). Potentially these high resolution models can give us insight into the hydro-logical processes in more detail. However, the possibilities to calibrate those models or to validate the accuracy of the model predictions is often limited by the number of (dis-tributed) measurement data. In most cases only observations of groundwater are available at a few points, while in-situ measurements of soil moisture are rare. Discharge data, if available, give only integrated hydrological information of an area. A data source that does provide spatially-distributed soil moisture data, or soil moisture related data, are satel-lites from which latent heat fluxes can be derived (Kustas and Norman, 1996). This paper focuses on satellites that are equipped with thermal bands. Models that are based on the surface energy balance like for instance SEBS (Su, 2002) and SEBAL (Allen et al., 2001; Bastiaanssen, 1995;
760 J. M. Schuurmans et al.: Remotely sensed latent heat fluxes for model error diagnosis: a case study
19 1
Figure 1. A. Location of the study area within the Netherlands. B. Surface level, land use and 2
soil types within the study area. 3
4
Figure 2. Feddes reduction factor (FR) as function of pressure head: between h1 and h2 there 5
is reduction of potential evaporation because of oxygen deficit of root. Between h2 and h3 6
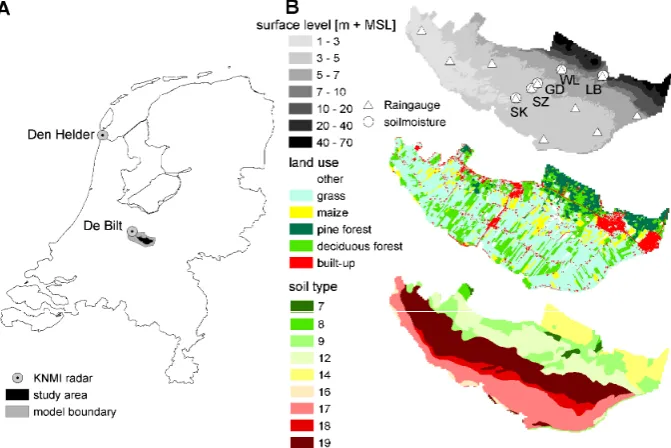
Fig. 1. (A) Location of the study area within the Netherlands. (B) Surface level, land use and soil types within the study area.
Bastiaanssen et al., 2005) can convert thermal band satellite images into images of actual evapotranspiration. These prod-ucts can be used for model verification or model calibration, as was demonstrated by Immerzeel and Droogers (2008).
The purpose of this study is to answer the question: “Can remotely sensed latent heat fluxes (i.e. actual evapotranspi-ration, ETact) improve the accuracy of the prediction of spatially-distributed soil moisture as made by a distributed hydrological model?”. We will answer this question by us-ing a real case study, by which we aim to show the poten-tial and limitation of our approach for hydrological model validation in practice. Outcomes of an operational physi-cally based distributed (25 m×25 m) hydrological model of a small catchment (70 km2) in The Netherlands are compared with satellite (both ASTER and MODIS) based ETactfor the same two days in summer 2006. The Surface Energy Balance for Land (SEBAL) is used in this study to process the satel-lite data. We use an operational physically based distributed (25 m×25 m) hydrological model that simulates the water flow in both the unsaturated and saturated zone, from now on referred to as MetaSWAP. In order to improve the model pre-dictions of soil moisture we assimilate ETactinto our model, using a statistical correction method that weighs the error of both hydrological model based and satellite based ETact. In an earlier study we already assimilated ETactinto another but conceptual similar spatially-distributed hydrological model (Schuurmans et al., 2003). Although promising, the results of this former study remained unverified, as was pointed out by Pipunic et al. (2008). In this study we use soil moisture measurements from 5 locations within the catchment, as well as validation data of SEBAL from The Netherlands, in or-der to get insight into the error of both hydrological model
based and satellite based ETact rather then using different (unknown) weighing factors as we did in our previous study. As both an ASTER and MODIS image were available for the two days (8 June and 17 July), this study also provides an excellent opportunity to compare the worth of these two satellite sources.
The remainder of this paper is organized as follows. Sec-tion 2 gives a descripSec-tion of the study area. SecSec-tion 3 intro-duces the hydrological model (MetaSWAP) and the data that is used in this study, which includes the rainfall, evapotran-spiration, soil moisture and groundwater. This section also gives the MetaSWAP outcomes of these variables. Section 4 deals with the data assimilation method; first the method it-self followed by its parameterization. Section 5 shows the results of the spatially distributed updated soil moisture and discusses the outcomes. Finally the main conclusions are drawn in Sect. 6 and an outlook for improvement of the pre-sented method is given.
2 Study area
Our study area is called the “Langbroekerwetering” and lies in the central part of The Netherlands (Fig. 1a). The Lang-broekerwetering (70 km2) is located along the rim of the Holocene Rhine-Meuse delta (Berendsen and Stouthamer, 2000), which onlaps cover sands and sandur outwash de-posits in front of a Saalian ice-pushed ridge (Busschers et al., 2007). Figure 1b shows the elevation together with the location of the rain gauges and the soil moisture measure-ments, land use and soil types of the Langbroekerwetering. For a description of the soil types we refer to Table 1. At the
[image:2.595.129.465.65.289.2]J. M. Schuurmans et al.: Remotely sensed latent heat fluxes for model error diagnosis: a case study 761
Table 1. Description of soil types within study area (W¨osten et al.,
1988) as well as the indexed error zone (see Sect. 4.2).
Soil unit Description Error zone
7 Drift sand 5
8 Podzol in loam poor fine sand 3
9 Podzol in loamy fine sand 3
12 Enkeerd in loamy fine sand 4
14 Podzol in coarse sand 5
16 Light clay 2
17 Clay with heavy clay layers 1
18 Clay on peat 1
19 Clay on sand 2
higher elevations with coarse sand forest dominates the area, while in the lower area grassland dominates. Within the area some small villages (built-up area) are located. The land use map is derived from the Dutch national land-cover database LGN (Oort et al., 2004; De Wit and Clevers, 2004).
3 Data
3.1 Hydrological model
The model used in this study is a coupled groundwater and unsaturated zone model, referred to as MetaSWAP from now on. The groundwater model is based on the MODFLOW model code (McDonald and Harbaugh, 1988). The unsat-urated zone model, is a quasi steady-state model that uses a sequence of steastate water content profiles for dy-namic simulation (Van Walsum and Groenendijk, 2008). The steady-state water content profiles were obtained by running a steady-state version of the SWAP model (Van Dam, 2000) off-line. The model area is divided into SVAT-units (Soil Vegetation Atmosphere Transfer), which are smaller or equal to the size of the MODFLOW cell. One MODFLOW cell can be coupled to several SVAT-units. The SVAT-units form parallel vertical columns, which are divided into a root zone and a subsoil layer. MetaSWAP distinguishes 21 different soil types. For each soil type the model has predefined sub-layers with corresponding soil physical parameters, the Van Genuchten parameters (Van Genuchten, 1980), to be able to convert pressure head to soil moisture content. In the un-saturated part of the hydrological model only vertical flow according to Richards’ Equation is taken into account. All lateral exchanges are assumed to take place in the saturated zone. The thickness of the root zone is user specified. In our model, the size of the MODFLOW cells is 100 m×100 m. The SVAT-units have a resolution of 25 m×25 m inside the study area and 100 m×100 m outside the study area, within the model boundaries (Fig. 1a).
19 1
Figure 1. A. Location of the study area within the Netherlands. B. Surface level, land use and 2
soil types within the study area. 3
4
Figure 2. Feddes reduction factor (FR) as function of pressure head: between h1 and h2 there 5
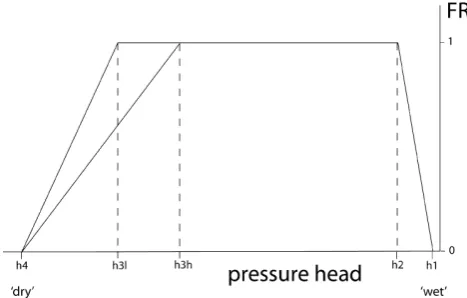
is reduction of potential evaporation because of oxygen deficit of root. Between h2 and h3 6 Fig. 2.head: betweenFeddes reduction factor (FR) as function of pressureh
1 and h2 there is reduction of potential
evapo-ration because of oxygen deficit of roots. Between h2 and h3.
ETact equals ETpot. Between h3 (h3l and h3h correspond to
resp. ETpot= 1 mm d−1 and ETpot= 5 mm d−1) and h4 there is
evapotranspiration reduction due to water deficit. After Feddes et al. (1978).
3.2 Rainfall
The daily rainfall fields (25 m by 25 m) that are used as input for MetaSWAP are a combination of meteorological radar (Fig. 1a) and rain gauges within and closely around the model area. The interpolation method used is a geostatistical method that combines radar estimates with rain gauge obser-vations. The method makes use of collocated cokriging and is explained in more detail in Schuurmans et al. (2007). 3.3 Evapotranspiration
MetaSWAP uses Makkink (De Bruin, 1987; Makkink, 1957; Winter et al., 1995), which is comparable to the internation-ally better known Priestley-Taylor method, reference evapo-transpiration (ETref) as input. The Royal Netherlands Mete-orological Institute (KNMI) delivered daily values of ETref, which we assumed to be spatially uniform over the model area. The potential evapotranspiration (ETpot) is calculated by multiplying ETref with a crop factor, which is related to the land use type and can vary throughout the season (Fed-des, 1987). The actual evapotranspiration (ETact) is equal or a fraction of ETpotdepending on the soil moisture conditions and the land use type (Eq. 1)
ETact = F R · ETpot (1)
in which FR is the called the Feddes reduction factor from now on. Figure 2 shows the so called Feddes-reduction curve (Feddes et al., 1978), which gives the relation between FR and the soil moisture pressure head. The values of the critical pressure heads (h1–h4) can be defined for each land use type. It must be noted that the choice of these values is one of the uncertainty sources in the model.
[image:3.595.57.276.99.222.2]762 J. M. Schuurmans et al.: Remotely sensed latent heat fluxes for model error diagnosis: a case study
20
ETact equals ETpot. Between h3 (h3l and h3h correspond to resp. ETpot = 1 mm d
-1and
1
ETpot = 5 mm d
-1) and h4 there is evapotranspiration reduction due to water defcit. After
2
(Feddes et al., 1978).
3
4
Figure 3. Spatial plot of ETact and ETpot [mm d
-1] as derived by SEBAL from ASTER and
5
MODIS images and by MetaSWAP as well as the bias corrected ETact SEBAL images and
6
FR for 8 June 2006.
7
[image:4.595.130.469.62.301.2]8
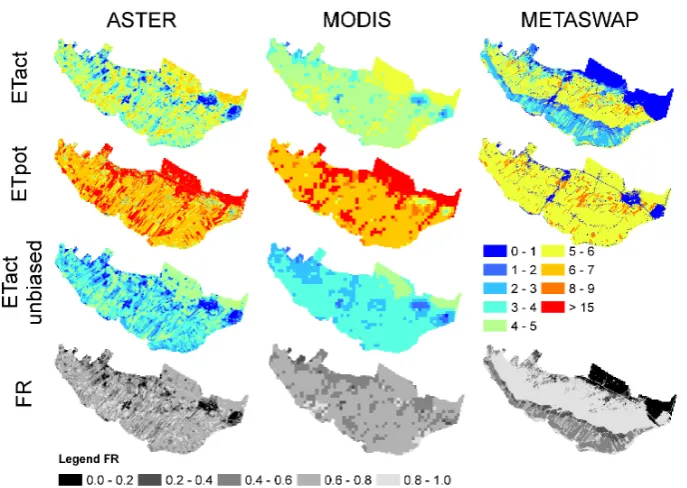
Fig. 3. Spatial plot of ETactand ETpot[mm d−1] as derived by SEBAL from ASTER and MODIS images and by MetaSWAP as well as the
bias corrected ETactSEBAL images and FR for 8 June 2006.
To investigate whether remotely sensed daily ETact can improve our hydrological model, we use both ASTER (Ad-vanced Spaceborne Thermal Emission and Reflection ra-diometer) and MODIS (MODerate resolution Imaging Spec-troradiometer) satellite measurements of summer 2006 in as-sociation with the Surface Energy Balance Algorithm for Land (SEBAL). For 8 June 2006 and 17 July we have both an ASTER and MODIS image of the study area that have a spatial resolution of respectively 15 m×15 m and 250 m×250 m.
SEBAL is based on the surface energy balance;
Rn = G0 +H +λ ρ E (2)
In which Rn [W m−2] is the net radiation; G is the soil heat flux; H [W m−2] is the sensible heat flux andλE [W m−2] is the latent heat flux that is associated with the ac-tual evapotranspiration (ETact) by the latent heat of vapo-razition (λ) and ρ is the density of water [kg m−3]. At satellite overpass, the instantaneous energy balance can be partly (Rn and G0) solved with satellite data and ground based meteorological data. The remaining problem is the division between the (instantaneous) sensible en latent heat flux. SEBAL computes the sensible heat using a so-called “self calibration” procedure. The temperature difference be-tween the land surface and the atmosphere at reference level (1T) that is needed to match the value of H at a given aerodynamic resistance is calculated. For the coldest pixel in the satellite image 1T= 0. For the warmest pixel it is assumed thatH=Rn–G0 and1T is solved iteratively us-ing the Monin-Obukhov Similarity Theory (MOST). After
that a linear 1T–Ts relationship (Ts is surface temperature based on satellite image) is fitted which is thus image spe-cific. For MOST the roughness length is needed. In this study that comes from a slightly modified roughness map of the Royal Netherlands Meteorological Institute. This map is based on the Dutch national land-cover database LGN which is the same land use map that is used for our hydrological model. SEBAL assumes that the instantaneous evaporative fraction (i.e. the division between the sensible en latent heat flux) equals the daily evaporative fraction. With the daily net radiation, that is calculated for each satellite pixel, and the daily soil heat flux, that is calculated with a sinus rela-tion, the daily actual evapotranspiration is calculated. The potential evapotranspiration is calculated by using a minimal stomatal resistance in the Penman-Monteith equation.
Figure 3 shows the spatial distribution of ETact, ETpot and FR for 8 June 2006 according to SEBAL (ASTER and MODIS) and MetaSWAP. Figure 4 shows the same for 17 July 2006. For both days SEBAL shows overall higher values of ETactand ETpotthan MetaSWAP. We comment on that in Sect. 4.2
For 8 June both SEBAL and MetaSWAP show little to no evapotranspiration reduction (high FR value), except for MetaSWAP in the northeastern part of the study area. The spatial variation of ETpot,m is due to the difference in crop factors. For major part of the study area (at least 80%) ETpot,mis equal to ETref, because the crop factor is 1.0. The built-up areas are clearly distinguishable, which is caused by the fact that built-up areas have a very low “crop factor” (0.05). The ASTER image reveals more spatial variation than
J. M. Schuurmans et al.: Remotely sensed latent heat fluxes for model error diagnosis: a case study 763
20
ETact equals ETpot. Between h3 (h3l and h3h correspond to resp. ETpot = 1 mm d
-1and
1
ETpot = 5 mm d
-1) and h4 there is evapotranspiration reduction due to water defcit. After
2
(Feddes et al., 1978).
3
4
Figure 3. Spatial plot of ETact and ETpot [mm d
-1] as derived by SEBAL from ASTER and
5
MODIS images and by MetaSWAP as well as the bias corrected ETact SEBAL images and
6
FR for 8 June 2006.
7
[image:5.595.128.472.59.303.2]8
Fig. 4. Same as Fig. 2 but for 17 July 2006.
the MODIS image, which is due to its higher spatial vari-ation. In both the ASTER and MODIS image, areas with forest and built-up areas are recognizable as areas with a rel-atively high and respectively low ETpotvalue.
For 17 July both SEBAL and MetaSWAP show evapotran-spiration reduction within the area, but their spatial distribu-tion differs. MetaSWAP shows a high spatial variability in ETactand the pattern resembles the soil type map (Fig. 1). In the northeast, the area at the high elevation with coarse sand and forest, ETactis very low, even zero at some places. In the middle part there is hardly any evapotranspiration reduction, and in the southeastern part there is again evapotranspiration reduction. The ETpot within MetaSWAP shows hardly any spatial variation, because the major part has the same crop factor, except for areas with maize, which have a crop fac-tor of 1.3 that time of year (was 1.0 on 8 June) and again the built-up areas with a “crop factor” of 0.05. In contrast to MetaSWAP, where there are clearly 3 regions, SEBAL shows more an overall evapotranspiration reduction. Both in the ASTER and MODIS images, built-up areas are recognizable as areas with a relatively low ETact.
3.4 Soil moisture
At 5 locations within the study area we measured soil ture (Fig. 1b: SK, SZ, GD, WL and LB). The soil mois-ture locations were selected such that they lie within differ-ent soil types. At each location we measured soil moisture at 5 depths: 5, 10, 15, 30 and 50 cm below surface. Mea-surements were done using 20 cm ECH2O probes (EC-20),
which use the capacitance technique (Bogena et al, 2007). Czarnomski et al. (2005) concluded that the EC-20 per-formed nearly as well as a TDR probe in a field experiment. All measurements were duplex with ∼1 m horizontal dis-tance between the sensors. The output of our ECH2O sen-sors, volumetric moisture content (VMC [cm3cm−3]), was measured with a temporal resolution of 5 min. For each lo-cation we performed a calibration with observed VMC.
Figure 5 shows for all soil moisture measurement locations (see Fig. 1) the measured and modeled volumetric moisture content at the 5 different depths. According to the measure-ments at location SK the upper layers (5 and 15 cm) are mod-eled too wet; 30 and 50 cm are modmod-eled well and 70 cm is again too wet. However, we experienced during fieldwork that these data should be used carefully. Besides the fact that the measurements are done in heavy clay, which can lead to significant attenuation effects (Bogena et al., 2007), we observed clay cracks that were formed in these soils during severe drought. For location SZ, the model is wetter than the measurements at all depths. The dynamics of the measure-ments are however modeled well for the depths 5 and 15 cm. In the deeper layers the measurements show much less dy-namics than the model shows. For location GD the model represents the measurements quite well during the wet peri-ods. However during drying out of the soil the model remains too wet. At location WL the model is too wet, except for the period in July where the modeled soil moisture at 5 and 15 cm is modeled dryer than was measured. In the forest, at location LB, the model is too dry for the upper layers. At 50 and 70 cm the model is slightly too wet, except for the
764 J. M. Schuurmans et al.: Remotely sensed latent heat fluxes for model error diagnosis: a case study
21
Figure 3. Same as Fig.2 but for 17 July 2006
1
2
3
Figure 5. Timeseries of VMC [cm3 cm-3] per measurment location and per depth according
4
to MetaSWAP (black solid line) and measurements (left side of pitch: grey solid lines, right
5
side of pitch: grey dotted line)
6
7
Fig. 5. Timeseries of VMC [cm3cm−3] per measurement location and per depth according to MetaSWAP (black solid line) and measure-ments (left side of pitch: grey solid lines, right side of pitch: grey dotted line).
[image:6.595.77.515.66.670.2]J. M. Schuurmans et al.: Remotely sensed latent heat fluxes for model error diagnosis: a case study 765
22
1
Figure 6. Bias in phreatic (A) and confined(B) groundwater during 2001-2006 [cm].
2
3
4
Figure 7. Spatial difference of the root zone storage [m] between unperturbed and updated
5
model run using either ASTER or MODIS images of 8 June and 17 July.
6
7
Fig. 6. Bias in phreatic (A) and confined (B) groundwater during 2001–2006 [cm].
dry period. It must be mentioned that especially the upper layer of LB contains a lot of organic material, which can de-crease the accuracy of measurement considerably (Bogena et al., 2007).
3.5 Groundwater
Our groundwater model has constant head boundaries, which are the output of a larger model (from which this model was cut) after it was run for 5 years (2001–2006). The results of this 5 years model run are compared with measurements from observation wells within the study area, of which most of them are measured twice a month. Figure 6 shows bubble plots of the bias (mean difference between model and mea-surement) in cm for respectively the phreatic and confined groundwater level. Positive bias values, meaning the model is too wet, are indicated as black dots, negative bias values (model too dry) are indicated as white dots. Figure 6 shows that the majority of the dots is black, indicating that the mod-eled groundwater level is too high.
4 Data assimilation
4.1 Method
The data assimilation method we used for this study is very comparable with the method used in a previous study (Schu-urmans et al., 2003). However for this study we have more data available to parameterize the statistical correction (Eq. 3). Each day a satellite image is available we have in-formation about ETactfrom both MetaSWAP (our hydrolog-ical model, see Sect. 3.1) and SEBAL (satellite based, see Sect. 3.3). We call this respectively ETact,mand ETact,sfrom now on. If we know the standard error of the MetaSWAP and SEBAL based ETact (resp. SEETact,m and SEETact,s), we can
make the following statistical correction of ETactper model node that gives us a new, updated value of ETact(ETact,new). With ETact,newwe prescribe per SVAT-unit a new FR (Eq. 1
and Fig. 2) and update the pressure head of the root zone in MetaSWAP.
ETact,new = ETact,m +
SE2ET
act,m
SEET2
act,m +SE
2 ETact,s
(3)
·
∼∼∼∼∼∼∼
ETact,s −ETact,m
The statistical correction weighs ETact,mand ETact,sbased on their confidence; if the standard error of ETact,mis high the updated value ETact,new will tend to ETact,s and vice versa. We hereby assume that (i) ETact,m is unbiased and (ii) the error in ETact,mis temporally variable but its variance is con-stant in time.
MetaSWAP and SEBAL use different methods to de-termine ETpot, the first is based on Makkink the latter on Penman-Monteith (Allen et al., 1998). We found that ETpot,s (ETpotfrom SEBAL) is overall higher than ETpot,m (ETpot from MetaSWAP). The reason for that is probably due to the fact that Makkink mainly depends on radiation whereas Penman-Monteith also takes into account the aero-dynamic term (the wind speed as well as the vapour pres-sure deficit), see Sect. 3.3. Droogers (2009) shows with daily data from 1998–2007 that Makkink reference evapotranspi-ration never exceeds 6 mm d−1in The Netherlands whereas Penman-Montheith reference evapotranspiration can be up to 8 mm d−1for the same days. Although we realize that ETpot,s may be more realistic than ETpot,mwe are interested in the reduction factor with which we want to update the modeled soil moisture. The values of ETact,s should therefore be in the range of the model (ETact,m). To achieve that we made a “bias” correction (Eq. 4), assuming that the spatial vari-ability of evapotranspiration reduction (FR, Eq. 1) shown by SEBAL is correct but the value of ETpot,s is biased. In Eq. (4) ETpot,mand ETpot,sare the spatial mean ETpot,mand ETpot,s. For 8 June we applied a bias correction of 2.5 and 2.74 mm d−1 for respectively ASTER and MODIS. For 17
[image:7.595.72.525.64.199.2]766 J. M. Schuurmans et al.: Remotely sensed latent heat fluxes for model error diagnosis: a case study July we applied a bias correction of 1.96 and 2.09 mm d−1
for respectively ASTER and MODIS.
∼∼∼∼∼∼∼
ETact,s = ETact,s ETpot,s
· ETpot,s +ETpot,m −ETpot,s (4) 4.2 Parameterization
To estimate SEETact,m we calculated ETact according to
MetaSWAP for the situation that we have the measured in-stead of the modeled VMC. Doing so we assume that the model concept of calculating ETact is correct and the mea-sured soil moisture is the truth. In this case we can esti-mate SEETact,m at five locations, as we have five soil
mois-ture measurement locations. At each location the VMC mea-surements are duplex at five different depths (5, 15, 30, 50, 70 cm). For each depth we took the mean of the duplex measurements. Because the model uses pressure heads in-stead VMC, we used the inverse Van Genuchten Equation (Van Genuchten, 1980), that calculates analytically the pres-sure head from VMC. We assume a uniform root distribution within the root zone and using the Feddes curve (Fig. 2) and Eq. (1) to derive a time series of ETactat each depth (Eq. 5). At the measurement locations, we only have two different root zone depths: 30 cm (SK, SZ, GD, WL) and 100 cm (LB).
ETact,rz = (5)
1
6·ETact,5cm+26·ETact,15cm+36·ETact,30cmfor rz=30 cm
1
20·ETact,5cm+202·ETact,15cm+203·ETact,30cm+204·ETact,50cm+1020·ETact,70cmfor rz=100 cm
With ETact,rzwe can determine the error in ETact,m(ETact,m– ETact,rz) for each soil moisture measurement location and calculate SEETact,m. The error in ETact,m as derived here
is a conservative estimation of the model error because the possible measurement error of the soil moisture probes are counted as model error. Using this method we assume that the relation between soil moisture and ETact given by the Feddes curve is correct but the modelled soil moisture is bi-ased. A better method to estimate SEETact,m would be to
de-termine the change in soil water storage. Measurements of VMC are not enough because assumptions on the percola-tion term are needed. Lysimeters could be an alternative.
We state that the derived SEETact,mat each location is
repre-sentative for a part of the model area (error zone), as we have only five measurement locations but want to apply the statis-tical correction method to all SVAT-units. Table 1 shows to which error zone the different soil types in the study area are classified, which is based on the soil physical parameters. Ta-ble 2 shows the values of SEETact,m, as well as the error zones
for which the five measurement locations are representative. We state that SEBAL images provide insight in the spa-tial pattern of ETact within an area and assume SEETact,s to
be spatially uniform. Because we had no measurements of ETact within the study area it was not possible to calculate the SEETact,s ourselves. However, data is available (source:
[image:8.595.307.548.99.145.2]www.waterwatch.nl) of a validation study in The Nether-lands where in 1995 weekly ETactmeasurements of SEBAL
Table 2. Standard error of the ETact,mper measurement location
and the related error zone (Fig. 1).
SK SZ GD WL LB
Error zone 1 2 3 4 5
SEETact,m(mm d
−1) 0.69 0.78 0.94 e-02 0.41 0.69
are compared to eddy-correlation measurements (306 mea-surements). This study shows a value for SEETact,s of 1.5–
1.9 mm week−1. Assuming this error is random, and choos-ing the upper bound, we get SEETact,s=
1.9
√
7= 0.72 mm day
−1. We now have the values for SEETact,m and SEETact,s with
which we can calculate ETact,newfor each modelnode (Eq. 3). Using ETpot,m(model based ETpot) we prescribe per SVAT-unit a new FR (Eq. 1 and Fig. 2) and update the pressure head of the root zone in MetaSWAP. Four different scenarios are possible:
– scen 1: FRm= 1 and FRnew>=1: no update of soil moisture because there was and is no evapotranspiration reduction;
– scen 2: FRm<1 and FRnew>=1: soil becomes wet-ter. In contrast to our previous study (Schuurmans et al., 2003) we do not take the reduction point (h3) but make a linear interpolation betweenh2andh3of the Feddes curve, based on the value of FRnew. If FRnew≥15 then the pressure head (h) is set toh2, if FRnew= 1,his set toh3(reduction point);
– scen 3: FRm= 1 and FRnew<1: soil becomes dryer; – scen 4: FRm<1 and FRnew<1: an update ofhtakes
place somewhere between h3 and h4 of the Feddes curve, meaning the soil becomes either dryer or wetter.
5 Results and discussion
5.1 Updated soil moisture results
Figure 7 shows the spatial difference of the root zone stor-age between the unperturbed and updated MetaSWAP run using either ASTER or MODIS images of 8 June 2006 and 17 July 2006. The difference is plotted 1 day after update, 10 days after update and at the end of the modeling period (1 November 2006). Negative values (indicated with blue) mean that the root zone storage in the updated model run is higher than in the unperturbed run, so MetaSWAP becomes wetter after update. The opposite is true for the positive dif-ference values, which are indicated with red.
For 8 June the overall modeled soil moisture in the lower area decreased after implementation of our data assimilation
J. M. Schuurmans et al.: Remotely sensed latent heat fluxes for model error diagnosis: a case study 767
22 1
Figure 6. Bias in phreatic (A) and confined(B) groundwater during 2001-2006 [cm]. 2
3
4
Figure 7. Spatial difference of the root zone storage [m] between unperturbed and updated 5
model run using either ASTER or MODIS images of 8 June and 17 July. 6
[image:9.595.131.469.64.302.2]7
Fig. 7. Spatial difference of the root zone storage [m] between unperturbed and updated model run using either ASTER or MODIS images
of 8 June and 17 July.
method, especially within the soil units 19 and 12. Consid-ering the time series of measured and modeled soil moisture at the 5 measurement locations (Fig. 5) this seems to be real-istic. However, the 5 measurement locations are point mea-surements and it is hard to identify their representativeness over the whole study area. In the higher region of the study area the modeled soil moisture is slightly increased. 17 July is in particular an interesting day as it shows evapotranspira-tion reducevapotranspira-tion for both MetaSWAP and SEBAL, but with a different spatial distribution. This day three different regions in the spatial pattern of the differences between MetaSWAP and SEBAL can be distinguished:
– region 1: the northeastern part where
∼∼∼∼∼∼∼
ETact,s > ETact,m;
– region 2: the middle part where ETact,m>
∼∼∼∼∼∼∼
ETact,s ; – region 3: the southwest part where
∼∼∼∼∼∼∼
ETact,s >ETact,m.
In region 1 both SEBAL and MetaSWAP show evapotran-spiration reduction but the amount of reduction showed by MetaSWAP is extremely high. Nevertheless Fig. 7 hardly shows an increase in the soil moisture content. This is due to the fact that ETact,new is a linear combination of ETact,m and unbiased ETact,s. Because ETact,m is extremely low, ETact,new is also low which means that the increase in soil moisture is only marginal. In region 2 soil moisture is re-duced, which seems plausible considering the modeled and
measured soil moisture (Fig. 5). In region 3 the modeled soil moisture is increased. Both SEBAL and MetaSWAP show evapotranspiration reduction but the SEBAL based reduction is lower. This is the most difficult area to decide whether this is plausible or not. The soil moisture measurement location SK is situated at the border of soil unit 19. This is an area with heavy clay that showed severe clay cracks during this period that in reality could reduce the evapotranspiration of grass (that roots mainly in the upper part). Besides, the soil moisture measurements of the upper layer should be handled with care.
5.2 Discussion
In areas with forest MetaSWAP shows for both days severe evapotranspiration reduction in contrast to SEBAL. It could be discussed whether SEBAL maybe overestimates ETact in areas with forest. However, increasing the crop factor in MetaSWAP is no solution for solving the evapotranspiration reduction in the northeastern part of the study area. We found that increasing the crop factor of forest only led to a faster dry out of the soil and thus lower ETactvalues in an earlier stage. This prevented us from increasing the crop factor of forest.
We hypothesize that the big difference between
∼∼∼∼∼∼∼
ETact,s and ETact,m in the northeast region of the study area (for-est dominated, groundwater level is∼60 m below surface) is caused by a conceptual error in MetaSWAP. Evapotran-spiration in forests is a complex process, mainly because of changes in root water uptake under stress. This has been the subject for many studies. The essence is that trees have
768 J. M. Schuurmans et al.: Remotely sensed latent heat fluxes for model error diagnosis: a case study special ways of water conservation allowing them to keep
evapotranspiration going during dry spells. Trees, but also some small plants like dandelion, radish and carrot, use wa-ter in a much more complex way than is implemented in this model, the so-called “hydraulic redistribution” or “hydraulic lift” (Warren et al., 2007; Lee et al., 2005; Dawson, 1996; Caldwell et al., 1998). This was also concluded by Feddes et al. (2001). Deep rooted plants take in water from deeper moist soil layers and exude that water during the night into the drier upper soil layers. Tap roots (a straight tapering root that grows vertically down) can also transfer rainwater from the surface to reservoirs deep underground and redistribute water upwards after the rains. Lee et al. (2005) found in Brazil that trees could store 10% of the annual precipitation as deep as 13 m. In some cases taproots can reach down more than 100 times the height of the plant above ground.
Despite the big difference between
∼∼∼∼∼∼∼
ETact,s and ETact,m in the northeastern part of the study area, the soil moisture content of the root zone becomes hardly any higher after data assimilation. It should therefore be questioned (i) whether ETact is a good variable to update the soil moisture content of the topsoil because in reality the evaporation process of forests is much more complex that involves soil moisture in deeper layers and (ii) a different, non-linear assimilation method should be applied.
6 Conclusions and outlook
The results of this study show that with the satellite based ETact images we can indicate areas with structural errors in our hydrological model. The first error is concept related: fixed root zone modelling is not correct for areas with deep groundwater tables. The second is flux related: for the lower areas too much seepage is calculated due to the geohydro-logical parameterization. In this case study, despite the lower spatial resolution of the MODIS images, they appeared just as useful as the ASTER images.
We showed that assimilation of ETactresulted in a spatial pattern of soil moisture adjustment that we consider to be realistic, apart from the area with forest and deep ground-water level. However, due to a lack of other spatially-distributed validation data it is hard to prove this. The ma-jor weakness of the assimilation scheme is the parameteri-zation of the standard error of ETact from the hydrological model (MetaSWAP) and SEBAL. Better insight in SEETact,m
could be given by using ground based ETact measurements (e.g. eddy-correlation system; scintillometer or lysimeter). The assumption of a spatial uniform SEETact,s might also be
incorrect as it is likely to be a structural component as well, mainly in forest. Due to a strong roughness, the super tem-perature signature of forest water stress is very low and so, more difficult to detect for SEBAL.
Only during periods with evapotranspiration reduction, there is a linkage between soil moisture and ETact, which
makes it useful to use satellite based ETact in order to im-prove the accuracy of soil moisture as calculated by our hy-drological model. Besides, the temporal resolution of satel-lite based ETactis not guaranteed to be the same as the return period of the (polar orbiting) satellite because of cloud con-ditions. This makes a regular online adjustment of modeled soil moisture content not feasible.
Data assimilation updates state variables of the hydrologi-cal model but does not solve the underlying cause of error in the hydrological model that leads to the difference be-tween modeled and remotely sensed ETact. Data assimila-tion should therefore not be considered as a replacement for model calibration or solution for structural model error.
Finally, we believe that a different land-plant-atmosphere interaction concept should be tested and implemented in MetaSWAP, as was also recognized by Feddes et al. (2001). Acknowledgements. The authors want to thank Wouten Meijninger
and Wim Bastiaanssen from WaterWatch for applying SEBAL to the satellite images as well as for their advice, Paul van Walsum from Alterra for his support with MetaSWAP and The Royal Netherlands Meteorological Institute (KNMI) for their rainfall and
evapotranspiration data. Inger de Groot and Chris Roosendaal
from Utrecht University are thanked for their support during field data collection. The reviewers are thanked for their comments that helped us to improve this article.
Edited by: P. van Oevelen
References
Allen, R. G., Pereira, L. S. , Raes, D., and Smith, M.: Crop evap-otranspiration: Guidelines for computing crop water require-ments, FAO Irrigation and drainage paper 56., FAO-Food and agriculture Organization of the United Nations, Rome, 1998. Allen, R. G., Bastiaanssen, W. G. M., Tasumi, M., and Morse,
A.: Evapotranspiration on the watershed scale using the SEBAL model and Landsat images, ASAE Meeting Presentation, paper number 01-2224, Sacramento, California, USA, 30 July–1 Au-gust, 2001.
Bastiaanssen, W. G. M.: Regionalization of surface flux densities and moisture indicators in composite terrain, A remote sensing approach under clear skies in Mediterranean climates, Ph.D. the-sis, Landbouwuniversiteit Wageningen, Wageningen, 1995. Bastiaanssen, W. G. M., Noordman, E. J. M., Pelgrum, H., Davids,
G., Thoreson, B. P., and Allen, R. G.: SEBAL model with re-motely sensed data to improve water-resources management un-der actual field conditions, J. Irrig. Drain. E-ASCE, 131, 85–93, 2005.
Berendsen, H. J. A. and Stouthamer, E.: Late Weichselian and Holocene palaeogeography of the Rhine-Meuse delta, The Netherlands, Palaeogeogr. Palaeocl., 161(3–4), 311–335, 2000. Bergstr¨om, S. and Graham, L. P.: On the scale problem in
hydro-logical modelling, J. Hydrol., 211, 253–265, 1998.
Bogena, H. R., Huisman, J. A., Oberd¨orster, C., and Vereecken, H.: Evaluation of a low-cost soil water content sensor for wireless network applications, J. Hydrol., 344, 32–42, 2007.
J. M. Schuurmans et al.: Remotely sensed latent heat fluxes for model error diagnosis: a case study 769
Busschers, F. S., Kasse, C., and Van Balen, R. T.: Late Pleis-tocene evolution of the Rhine-Meuse system in the Southern North Sea basin: imprints of climate change, sea-level oscilla-tion and glacio-isostacy, Quaternary Sci. Rev., 26, 3216–3248, 2007.
Caldwell, M. M., Dawson, T. E., and Richards, J.: Hydraulic lift: consequences of water efflux from the roots of plants, Oecologia, 113, 151–161, 1998.
Czarnomski, N. M., Moore, G. W., Pypker, T. G., Licata, J., and Bond, B. J.: Precision and accuracy of three alternative instru-ments for measuring soil water content in two forest soils of the Pacific Northwest, Can. J. Forest Res., 35, 1867–1876, 2005. Dawson, T. E.: Determining water use by trees and forests from
isotopic, energy balance and transpiration analyses: The role of tree size and hydraulic lift, Tree Physiol., 16, 263–272, 1996. De Bruin, H. A. R.: From Penman to Makkink (In Dutch), Proc.
And Inf. Vol. 39, TNO Committee of Hydrological Research, CHO-TNO The Hague, The Netherlands, 5–31, 1987.
De Wit, A. J. W. and Clevers, J. G. P. W.: Efficiency and accu-racy of per-field classifcation for operational crop mapping, Int. J. Remote Sens., 25(20), 4091–4112, 2004.
Droogers, P.: Improving actual evapotranspiration for strategic watermanagement: definition study (in Dutch), STOWA rap-port 2009-11, ISBN: 978.90.5773.428.1, STOWA, Utrecht, The Netherlands, 2009.
Feddes, R. A.: Crop factors in relation to Makkink reference-crop evapotranspiration, Comm. Hydrol. Res. TNO, The Hague, Proc. and Inf. 39, 33–44, 1987.
Feddes, R. A., Kowalik, P. J., and Zaradny, H.: Simulation of field water use and crop yields, Simulation monographs, Pudoc, Uni-versity of Wageningen, 1978.
Feddes, R. A., Hoff, H., Bruen, M., Dawson, T., de Rosnay, P., Dirmeyer, P., Jackson, R. B., Kabat, P., Kleidon, A., Lilly, A., and Pitman, A. J.: Modeling root water uptake in hydrological and climate models, B. Am. Meteorol. Soc., 82(12), 2797–2810, 2001.
Immerzeel, W. W. and Droogers, P.: Calibration of a distributed hydrological model based on satellite evapotranspiration, J. Hy-drol., 349, 411–424, 2008.
Kustas, W. P. and Norman, J. M.: Use of remote sensing for evap-otranspiration monitoring over land surfaces, Hydrolog. Sci. J. – Journal Des Sciences Hydrologiques, 41, 495–516, 1996. Lee, J. E., Oliveiria, R. S., Dawson, T. E., and Fung, I.: Root
func-tioning modifies seasonal climate, P. Natl. Acad. Sci. USA, 102, 17576–17581, 2005.
Makkink, G. F.: Testing the Panman formula by means of lysime-ters, J. Int. Water England, 11, 277–288, 1957.
McDonald, M. G. and Harbaugh, A. W.: A modular
three-dimensional finite-difference ground-water flow model, Open-File Report 83-875, US Geological Survey, p.528, 1988. Pipunic, R. C., Walker, J. P., and Western, A.: Assimilation of
re-motely sensed data for improved latent and sensible heat flux prediction: A comparative synthetic study, Remote Sens. Envi-ron., 112, 1295–1305, 2008.
Schuurmans, J. M., Troch, P. A., Veldhuizen, A. A., Bastiaanssen, W. G. M., and Bierkens, M. F. P.: Assimilation of remotely sensed latent heat flux in a distributed hydrological model, Adv. Water Res., 26, 151–159, 2003.
Schuurmans, J. M., Bierkens, M. F. P., Pebesma, E. J., and Uijlen-hoet, R.: Automatic prediction of high-resolution daily rainfall fields for multiple extents: the potential of operational radar, J. Hydrometeorol., 8, 1204–1224, 2007.
Su, Z.: The Surface Energy Balance System (SEBS) for estima-tion of turbulent heat fluxes, Hydrol. Earth Syst. Sci., 6, 85–100, doi:10.5194/hess-6-85-2002, 2002.
Van Dam, J. C.: Field-scale water flow and solute transport. SWAP model concepts, parameter estimation, and case studies, PhD-thesis, Wageningen University, Wageningen, The Netherlands, p.167, 2000.
Van Genuchten, M. Th.: A closed-form Eq for predicting the hy-draulic conductivity of unsaturated soils, Soil Sci. Soc. Am. J., 44, 892–898, 1980.
Van Oort, P. A. J., Bregt, A. K., de Bruin, S., and de Wit, A. J. W.: Spatial variability in classification accuracy of agricultural crops in the Dutch national land-cover database, Int. J. Geogr. Inf. Sci. 18, no. 6, September 2004, 611–626, 2004.
Van Walsum, P. E. V. and Groenendijk, P.: Quasi steady-state sim-ulation of the unsaturated zone in groundwater modeling of low-land regions, Vadose Zone J., 7, 769–781, 2008.
Warren, J. M., Meinzer, F. C., Brooks, J. R., Domec, J. C., and Coulombe, R.: Hydraulic redistribution of soil water in two old-growth coniferous forests: quantifying patterns and controls, New Phytol., 173, 753–765, 2007.
Winter, T. C., Rosenberry, D. O., and Sturrock, A. M.: Evaluation of 11 Eqs for determining evaporation for a small lake in the North Central United States, Water Resour. Res., 31(4), 983–993, 1995. W¨osten, J. H. M., De Vries, F., Denneboom, J., and Van Holst, A. F.: Generalization and soil physical translation of the Dutch soil map, 1:250.000, on behalf of the PAWN-study, Report nr. 2055, Stichting voor Bodemkartering, Wageningen, 1988.
![Fig. 3. Spatial plot of ET5 Figure 3. Spatial plot of ETact and ETpot [mm d-1] as derived by SEBAL from ASTER and 6 MODIS images and by MetaSWAP as well as the bias corrected ETact SEBAL images and act and ETpot [mm d−1] as derived by SEBAL from ASTER and MODIS images and by MetaSWAP as well as thebias corrected ETact SEBAL images and FR for 8 June 2006.](https://thumb-us.123doks.com/thumbv2/123dok_us/9263860.995566/4.595.130.469.62.301/spatial-figure-spatial-metaswap-corrected-derived-metaswap-corrected.webp)
![Fig. 5.4 Timeseries of VMC [cmFigure 5. Timeseries of VMC [cm3 cm-3] per measurment location and per depth according 3 cm−3] per measurement location and per depth according to MetaSWAP (black solid line) and measure-ments (left side of pitch: grey solid lines, right side of pitch: grey dotted line).](https://thumb-us.123doks.com/thumbv2/123dok_us/9263860.995566/6.595.77.515.66.670/timeseries-cmfigure-timeseries-measurment-according-measurement-according-metaswap.webp)
![Figure 7. Spatial difference of the root zone storage [m] between unperturbed and updated ETstant in time.termine ET(ETdue to the fact that Makkink mainly depends on radiationwhereas Penman-Monteith also takes into account the aero-dynamic term (the wind](https://thumb-us.123doks.com/thumbv2/123dok_us/9263860.995566/7.595.72.525.64.199/figure-spatial-difference-unperturbed-etstant-makkink-radiationwhereas-monteith.webp)

![Fig. 7. Spatial difference of the root zone storage [m] between unperturbed and updated model run using either ASTER or MODIS images5 Figure 7](https://thumb-us.123doks.com/thumbv2/123dok_us/9263860.995566/9.595.131.469.64.302/spatial-difference-storage-unperturbed-updated-modis-images-figure.webp)
