IN DECISION-MAKING
Thesis by Vanessa Janowski
In Partial Fulfillment of the Requirements for the Degree of
Doctor of Philosophy
CALIFORNIA INSTITUTE OF TECHNOLOGY
Pasadena, California 2012
ACKNOWLEDGEMENTS
I would like to thank everyone who has helped and supported me throughout my Ph.D.
To start, I would like to thank my undergraduate mentors, Arturo Bris and Christos Cabolis, for introducing me to economic research and for their support and advice over the years. I would also like to thank my mother, Jadwiga Rogowska, for introducing me to neuroscience and functional magnetic resonance imaging (fMRI). They helped me to embark on the path to a Ph.D.
I would like to thank Ralph Adolphs for helping to convince me to come to Caltech and taking an interest in my development as a graduate student. He showed me what a successful scientist is like and inspired me to pursue my research in a thoughtful, determined way.
I would also like to thank Peter Bossaerts, Pietro Ortoleva and Kota Saito for their help and advice along the way, as well as for serving on my committee. I would like to thank my co-authors Antonio Rangel, Colin Camerer, Eric Johnson, Martijn Willemsen and Erik Madsen for their contributions. Also, many thanks to Laurel Auchampaugh, Jenny Niese, Tiffany Kim, Barbara Estrada, Sheryl Cobb, and Victoria Mason for help with day-to-day logistics.
In addition, I gratefully acknowledge the National Science Foundation IGERT program as well as the HSS Department at Caltech for funding me through my Ph.D. Thanks also to the Kosciuszko Foundation and the Pulaski Scholarship for Advanced Studies for scholarships that helped support me during my Ph.D.
Thanks to all the members of the Rangel, Camerer and Adolphs labs who have not only provided mentorship and guidance, but also become my friends. I owe particular thanks to Cendri Hutcherson and Todd Hare, who helped me learn numerous fMRI techniques and never tired of my questions.
My time at Caltech was made enjoyable in large part thanks to many friends who became an important part of my life. In particular, I would like to thank Anush for putting up with me through both good and bad days and being a great partner in many adventures.
ABSTRACT
Neuroeconomics has produced a number of insights into economics, psychology, and neuroscience in its relatively short existence. Here, I show how neuroeconomics can inform these fields through three studies in social decision making and decision making under risk. Specifically, I focus on computational biases inherent in our daily decisions.
First, using functional magnetic resonance imaging (fMRI), I examine how we make decisions for others compared to ourselves. I find that overlapping areas of the ventromedial prefrontal cortex (vmPFC) are involved in both types of decisions, though decisions for others are modulated by areas involved in social cognition. Specifically, activity in the inferior parietal lobule (IPL) encodes a variable measuring the distance between others’ and our own preferences, suggesting that we may anchor our choices for others on our own preferences and attempt to modulate these preferences with what we know about others.
TABLE OF CONTENTS
Acknowledgements ... iii
Abstract ... vi
Table of Contents ... viii
Summary ... 10
Chapter I: Empathic Choice Involves vmPFC Value Signals that are Modulated by Social Processing Implemented in IPL ... 13
Introduction ... 14
Methods ... 18
Results ... 27
Discussion ... 44
References ... 47
Appendix ... 53
Chapter II: Variation in Loss Aversion is Associated with Differential Attention to Losses ... 67
Introduction ... 68
Methods ... 71
Results ... 76
References ... 91
Appendix ... 96
Chapter III: Display and Search Dynamics in Multi-Attribute Choice ... 103
Introduction ... 105
Methods ... 109
Results ... 120
Discussion ... 137
References ... 139
SUMMARY
In recent years, the field of neuroeconomics has shed insight on a number of traditional economics questions. While neuroscience has benefited from the collaboration with economics, there is still disagreement about the degree to which neuroscience can inform economics. In this thesis, I conduct three experiments to show how neuroeconomics can help address questions that remain unanswered with traditional economic methods.
others and ourselves. It follows that deficits in empathy and general social cognition might impair the ability to make sound empathic decisions, which could interfere with everyday social interaction.
In Chapter 2 I use eye-tracking to investigate the role of attention in loss aversion. While there is much evidence showing that individuals exhibit loss aversion in many domains, the mechanisms behind loss aversion remain unknown. Based on recent research showing that differences in attention affect the computation and comparison of values during simple choice, I hypothesize that differences in loss aversion across and within individuals could be modulated by differential attention to losses. I find that more loss averse subjects pay more relative attention to losses, and my results suggest a model in which attention must be included to make any inferences on choice. My results have important implications for the role of attentional processes in choice: systematic biases in fixations could lead to different choices. Moreover, as biases such as loss aversion can lead to deficits in decision-making, our findings raise the interesting possibility that we may be able to modulate our attention to make better choices.
differences in search patterns depending on how attributes of each choice are visually arranged. These search patterns subsequently impact choice through the differential weighting and integration of the attributes. Higher-placed attributes for a given item will receive more attention and thus greater weighting in an overall value for the item. My results have important implications for a number of applications, including store display arrangement, product attribute emphasis and the organization of features on a website.
CHAPTER 1
Empathic
Choice Involves vmPFC Value Signals that are Modulated
by Social Processing Implemented in IPL
INTRODUCTION
Humans make different types of decisions. Self-oriented decisions mostly affect ourselves and are guided by the goal of maximizing our own well-being. Examples include what to have for lunch or which clothing to purchase. Pro-social decisions involve tradeoffs between our own well-being and the well-being of others. Examples include a donation to charity and purchasing a gift for a friend. Empathic decisions entail decisions made on behalf of other people, with the goal of choosing what is best for them, and without having to sacrifice our own resources. Examples include the myriad of choices that parents make for their children, the decisions of a politician trying to make good choices on behalf of his or her constituents, and economic agents (e.g., in real estate or entertainment) who strive to commit their clients’ time and money to activities the clients prefer. Although a substantial amount of progress has been made in understanding self-oriented (Rangel, Camerer et al. 2008; Rushworth and Behrens 2008; Kable and Glimcher 2009; Rangel and Hare 2010) and pro-social decisions (Fehr and Camerer 2007), much less is known about the computational and neurobiological basis of empathic choice.
With respect to basic decision-making, a large body of work has begun to characterize in detail the computations involved in self-oriented decisions. For example, human neuroimaging studies have shown that activity in areas such as ventromedial prefrontal cortex (vmPFC) correlates with the value of stimuli at the time of choice (Kable and Glimcher 2007; Plassmann, O'Doherty et al. 2007; Tom, Fox et al. 2007; Valentin, Dickinson et al. 2007; Hare, O'Doherty et al. 2008; Plassmann, O'Doherty et al. 2008; Rolls, McCabe et al. 2008; Boorman, Behrens et al. 2009; FitzGerald, Seymour et al. 2009; Hare, Camerer et al. 2009; Hare, Camerer et al. 2009; Litt, Plassmann et al. 2009). Similar results have been found in non-human primate electrophysiology studies (Wallis and Miller 2003; Padoa-Schioppa and Assad 2006; Padoa-Schioppa and Assad 2008; Kennerley, Dahmubed et al. 2009; Kennerley and Wallis 2009; Padoa-Schioppa 2009). Activity in vmPFC has also been associated with the computation of stimulus values during pro-social choices (Moll, Krueger et al. 2006; Harbaugh, Mayr et al. 2007; Tankersley, Stowe et al. 2007; Hsu, Anen et al. 2008; Hare, Camerer et al. 2010; Tricomi, Rangel et al. 2010). Importantly, however, none of these previous studies include instances of empathic choice.
paradigms, have shown that areas such as the inferior frontal gyrus (IFG), inferior parietal lobule (IPL), and dorsomedial prefrontal cortex (dmPFC) play a critical role in empathy computations (Mitchell 2009; Zaki, Weber et al. 2009; Decety 2010; Shamay-Tsoory 2011). Importantly, the previous literature on empathy has also not covered the case of empathic choice, since the tasks used involved the observation and evaluation of other’s emotional states, but not decision-making on their behalf. A related literature has studied the neurobiological basis of mentalizing (often called theory of mind, ToM), and has found that areas such as medial prefrontal cortex (mPFC) and the temporo-parietal junction (TPJ) play a critical role in this process (Saxe and Kanswisher 2003; Mitchell, Banaji et al. 2005; Saxe and Wexler 2005; Mitchell, Macrae et al. 2006; Saxe 2006; Mitchell 2009).
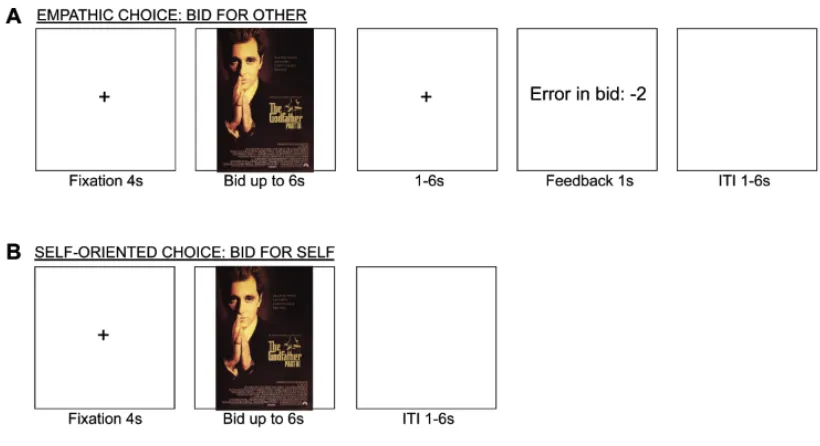
Here we present the results of a simple human functional magnetic resonance imaging study (fMRI) in which subjects made otherwise identical decisions (purchasing DVDs) in either a self-oriented context, by buying them for themselves with their own funds, or in an empathic context, by buying them for an unknown third party, with this party’s funds. This allowed us to investigate two basic questions regarding empathic decision-making.
the basic elements of the decision making system, such as the computation of stimulus value signals in vmPFC, but that their computation during empathic choice requires the activation of regions, such as IPL and TPJ, that are known to play a critical role in empathy and mentalizing.
METHODS
Subjects. 32 normal-weight, American or Canadian, male subjects participated in the experiment (age: mean = 22.8, SD = 3.9). All subjects were right-handed, healthy, had normal or corrected-to-normal vision, had no history of neurological or metabolic illnesses, and were not taking any medication that interferes with the performance of fMRI. All subjects were informed about the experiment and gave written consent before participating.
Stimuli. Subjects viewed 100 high-resolution color images of DVD covers of popular films from the last 15 years. They included comedies (e.g., “Austin Powers”), action films (e.g., “Swordfish”), dramas (e.g., “Magnolia”) and thrillers (e.g., “Panic Room”).
Task. There were two types of subjects in the experiment: one passive subject and thirty-two active subjects. The role of the passive subject was to be the recipient of the active subjects’ decisions.
choice task in which they made purchase decisions on behalf of the passive subject (Fig. 1A). They were given a budget of $10 that belonged to the passive subject (any unspent funds were returned to him) and were given a summary sheet containing a photograph and some biographic information about the passive subject (see Appendix for detailed instructions). They were then shown images of 100 different DVDs and had to make a decision regarding how much to bid for each one of them on behalf of the subject. Bids were made using a six-point scale of $0, 2, 4, 6, 8 and 10. After every bid subjects received feedback equal to the amount by which they had overbid or underbid relative to the passive subject’s values (feedback = active subject’s bid – passive subject’s bid). Active subjects did not receive any form of compensation for making accurate bids. Instead, the instructions simply told them to try to maximize the passive subject’s well-being. The mapping of bids to response buttons was counterbalanced across subjects.
DeGroot et al. 1964). The active subjects knew that the outcome of the auction would be implemented, and that the person for whom they were bidding would receive any DVD purchased plus any remaining cash from the $10. Note that since only one trial was selected to count, the subjects did not have to worry about spreading the $10 dollars across the different films, and could treat every decision as if it were the only one. No deception was used in the experiment. The passive subject actually received DVDs when the subject’s decision led to a purchase of the DVD.
During the second day of scanning, active subjects participated in the self-oriented version of the task (Fig. 1B). In this case they performed a similar task, except that now they made purchase decisions for themselves out of a $10 cash endowment that belonged to them. A randomly selected trial was again chosen, and the associated decision implemented, at the conclusion of the two sessions. At the end of the second session, subjects were asked to fill out a questionnaire detailing which DVDs they owned or had seen. In order to control for any potential order effects on bidding, the DVDs were shown in the same order as in the first experimental visit.
About task order. Given the difficulty in guessing another’s film preferences, we were concerned that subjects would exhibit an artificial tendency to use their own preferences to make the purchase decisions for the other. In order to minimize this concern, we decided not to counterbalance the order of the two tasks, and to introduce a long multi-month lag between them. The results described below suggest that we were successful in avoiding a full self-valuation bias during the empathic decisions. However, this raises the natural concern of order confounds. To address this concern we carried out a companion behavioral experiment (see SOMs for details) in which we directly compared the effect of order on bidding behavior. For each individual we carried out a linear regression of bid-for-other on bid-for-self and bid-for-other-bid, separately for self-oriented and empathic choice trials. We found no significant differences across the two order conditions (min p=0.29, t-test), which rules out the order confound.
minutes each. The first two sessions were performed on a separate date than the latter two sessions. Whole-brain high-resolution T1-weighted structural scans (1 x 1 x 1 mm) were acquired for each subject and coregistered to their mean functional EPI images. The structural scans were averaged across subjects to permit anatomical localization of the functional activations at the group level.
Image analysis was performed using Statistical Parametric Mapping software (SPM5; Wellcome Department of Imaging Neuroscience, Institute of Neurology, London, UK). We preprocessed the data in the following way. First, slice-timing correction centered at the middle T2 scan was applied, followed by realignment to the first volume. We then applied spatial normalization to the standard Montreal Neurological Institute (MNI) EPI template with a resampled voxel size of 3 mm2 and performed spatial smoothing using a Gaussian kernel with full width at half maximum of 8 mm. Intensity normalization and high-pass temporal filtering were also applied to the data.
GLM 1. This general linear model was designed to identify the similarities and differences between empathic and self-oriented choices. It was estimated in three different steps.
For inference purposes, all results are reported at p < 0.05 whole brain corrected at the cluster level (using the corrected cluster size threshold algorithm by Thomas Nichols; http://www.sph.umich.edu/~nichols/JohnsGems5.html). The only exception is activity in the vmPFC for which, due to the strong prior hypotheses, we report activity at p<0.05 small volume cluster corrected (using an anatomical mask of the vmPFC area that included both sides of the medial orbitofrontal cortex and the rectus gyrus).
GLM 2. This model was very similar to GLM 1, except that activity at decision during empathic choices was modulated by two variables: bid-for-self and bid-for-other orthogonalized with respect to bid-for-self. All omitted details are as in GLM 1.
GLM 3. This model was very similar to GLM 1, except that activity at decision during empathic choices was modulated by two variables: bid-for-other and bid-for-self orthogonalized with respect to bid-for-other. All omitted details are as in GLM 1.
Psychophysiological interactions model (PPI). The goal of this analysis was to identify areas exhibiting differential connectivity with vmPFC during empathic and self-oriented choices. The model was estimated in the following steps.
First, we extracted individual average time-series of BOLD activity within an individually defined region of vmPFC, given by a 4mm sphere surrounding each individual’s peak activation for the contrast ‘R2 MINUS baseline’ in GLM-1 within the anatomical mask of the vmPFC shown in Fig. 1C. We removed any variance from this time series associated with the motion regressors. The resulting time courses were deconvolved using standard procedures (Gitelman, Penny et al. 2003).
functional connectivity with the vmPFC seed region during empathic choices. Regressor 2 does the same for self-oriented choices.
Third, we calculated the following single subject contrasts: C1) Regressor 1 vs. baseline, C2) Regressor 2 vs. baseline, and C3) Regressor 1 vs. Regressor 2.
Fourth, we conducted a second level analysis by calculating a one-sample t-test on the single subject contrast coefficients.
RESULTS
First we discuss tests designed to investigate if the same basic neural circuitry is involved in making self-oriented and empathic decisions, and to characterize the key differences.
s, SD = 0.47; paired t-test p< 0.05). This is consistent with the hypothesis that empathic decisions involve the deployment of extra processes.
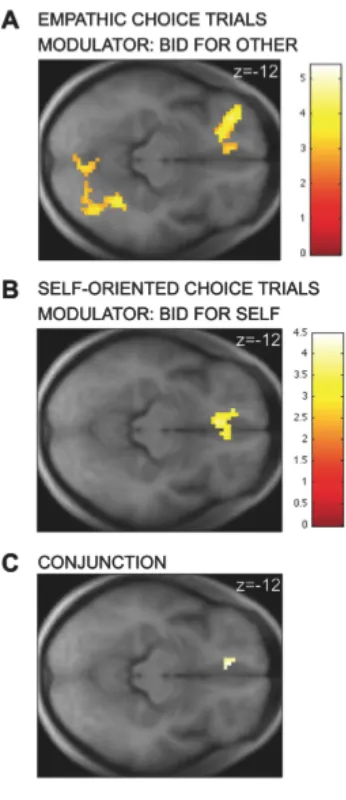
Common value coding in vmPFC. We hypothesized that a common area of vmPFC is involved in computing the stimulus values (SVs) assigned to DVDs at the time of decision in both the self-oriented and empathic trials. We focused our attention on vmPFC because a large number of studies have found SV signals in this area (see introduction). The bids-for-self provide a trial-by-trial measure of the SVs computed in bids-for-self-oriented trials, whereas the bids-for-other provide a similar measure for empathic decisions.
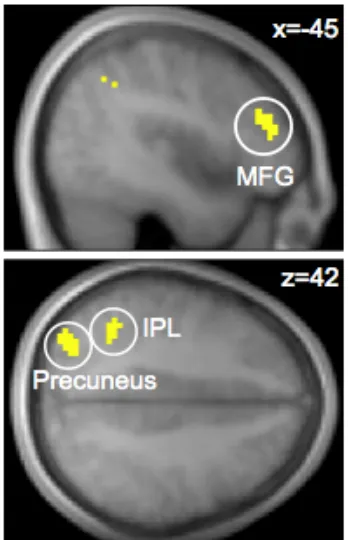
Fig. 2. A) Activity in vmPFC correlated with the bids-for-other during empathic choices (p <
0.05, SVC). B) Activity in vmPFC also correlated with the bids-for-self during self-oriented choices
(p < 0.05, SVC). C) Conjunction analysis: activity in a common area of vmPFC correlated with the
[image:30.612.237.410.227.627.2]Table 1. Areas exhibiting a positive correlation with bid-for-other during empathic choice (GLM 1)
Region Side k T MNI coordinates
x y z
Ventral striatum L/R 153 5.39 -9 6 -6
Middle frontal gyrus L 248 4.85 -27 33 -15
Precuneus / Inferior parietal lobule L 255 4.78 -39 -57 42 Fusiform / Middle occipital gyrus R 632 4.52 30 -66 0
Posterior cingulate L 240 4.50 -6 -42 15
vmPFC* L 21 3.57 -9 42 -15
Height threshold: T = 2.74, p < 0.05, whole brain cluster corrected. Extent threshold: k = 109 voxels, p < 0.005.
Table 2. Areas exhibiting a positive correlation with bid-for-self during self-oriented choice (GLM 1)
Region Side k T MNI coordinates
x y z
Inferior parietal lobule L 295 4.47 -45 -36 39 Middle frontal gyrus L 617 4.43 -39 36 12
Precuneus L 135 4.07 -39 -72 30
vmPFC* L/R 105 3.79 -6 27 -12
Height threshold: T = 2.74, p < 0.05, whole brain cluster corrected. Extent threshold: k = 105 voxels, p < 0.005.
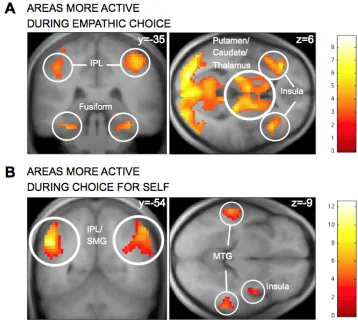
Differences in the network involved in empathic vs. self-oriented choices. We also hypothesized that empathic choice would require the activation of additional regions, such as IPL and TPJ, that are known to be involved in social cognition. We tested this hypothesis in two steps.
First, using GLM 1, we looked for regions that exhibit higher average activity during empathic choices, and areas that exhibit higher average activity during self-oriented choices. A large cluster of regions exhibited stronger activity during empathic choices, including bilateral inferior parietal lobule, bilateral middle frontal gyri, bilateral anterior insula (Fig. S4A, Table 3). We also found regions exhibiting stronger activity during self-oriented choices, including bilateral supramarginal gyri, middle temporal gyrus, right posterior insula and superior temporal gyrus (Fig. S4B, Table 3).
In contrast, no regions exhibited stronger functional connectivity with vmPFC during self-oriented choices at our omnibus threshold. Interestingly, the regions of IPL that exhibit stronger functional connectivity with vmPFC overlap with those that exhibit stronger average activity during empathic trials (Fig. 3B).
Fig. 3. A) Areas of IPL exhibiting stronger connectivity with the vmPFC valuation region
during empathic choices than during self-oriented decisions. B) Region of IPL exhibiting both
stronger functional connectivity with vmPFC and higher average (unmodulated) activity during
empathic choices. C) Region of IPL exhibiting both stronger functional connectivity with vmPFC
during empathic choices and a correlation with the difference preference measure. The contrasts are
[image:35.612.242.404.278.596.2]in self-oriented vs. empathic choice (GLM 1)
Region Side k T MNI coordinates
x y z
Self-oriented > Empathic
Inf parietal/Supramarginal gyrus L 471 12.6 -51 -54 36
Inf parietal/Supramarginal gyrus R 409 7.06 51 -57 42
Middle temporal gyrus L 149 5.71 -63 -33 -9
Middle temporal gyrus R 165 5.44 57 -27 -24
Cingulate gyrus L 173 5.16 -9 -18 27
Middle frontal gyrus R 218 4.71 39 12 57
Insula/Superior temporal gyrus R 167 4.38 48 -6 0
Empathic > Self-oriented
Middle occipital gyrus/cuneus L 11460 -8.90 -24 -90 3
Putamen/caudate/thalamus L * -8.63 -6 9 -3
Middle occipital gyrus/cuneus R * -7.94 3 -93 9
Putamen/caudate/thalamus R * -7.20 18 -27 3
Inf parietal lobe/Postcentral gyrus R * -7.07 36 -27 69
Precentral/middle frontal gyrus L * -7.04 -18 -75 51
Fusiform/middle temporal gyrus L * -6.51 -39 -63 -18
Insula/Inf frontal gyrus L * -6.23 -36 33 6
Midbrain L * -6.16 -18 -24 -3
Precentral/middle frontal gyrus R * -5.45 15 -72 54
Midbrain R * -5.36 18 -24 3
Inf parietal lobe L * -5.13 -27 -30 75
Insula/Inf frontal gyrus R 180 -5.04 45 21 3
*Part of a larger cluster.
Table 3. Regions exhibiting stronger average (unmodulated) activation
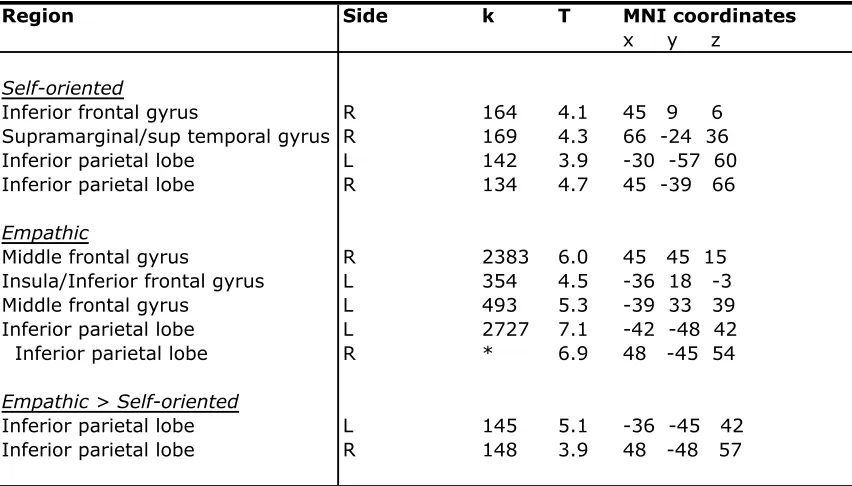
Table 4. Areas exhibiting positive task related functional connectivity with the vmPFC (PPI analysis)
Region Side k T MNI coordinates
x y z
Self-oriented
Inferior frontal gyrus R 164 4.1 45 9 6
Supramarginal/sup temporal gyrus R 169 4.3 66 -24 36
Inferior parietal lobe L 142 3.9 -30 -57 60
Inferior parietal lobe R 134 4.7 45 -39 66
Empathic
Middle frontal gyrus R 2383 6.0 45 45 15
Insula/Inferior frontal gyrus L 354 4.5 -36 18 -3
Middle frontal gyrus L 493 5.3 -39 33 39
Inferior parietal lobe L 2727 7.1 -42 -48 42
Inferior parietal lobe R * 6.9 48 -45 54
Empathic > Self-oriented
Inferior parietal lobe L 145 5.1 -36 -45 42
Inferior parietal lobe R 148 3.9 48 -48 57
Height threshold: T = 2.58, p < 0.05, whole brain cluster corrected. Extent threshold: k = 102 voxels, p < 0.005.
Next, we investigated the extent to which stimulus value signals are computed using self-simulation, other-self-simulation, or other-learning, during empathic choices.
No behavioral evidence for other-learning. Under other-learning, the quality of other should improve over time. A good measure of the quality of the individual’s bids-for-other is given by
correlation(bid-for-other, other-bid) – correlation(bid-for-self, other-bid) (1).
The first term measures the extent to which the subject’s bids-for-other correlates with the other’s preferences. The second term corrects for the fact that the first term might be artificially large if both individuals tend to like the same movies. The mean quality statistic was 0.06 (S.E.= 0.017, p<.0001, t-test). Contrary to the other-learning model, we found no significant difference between the first and second half of trials (p=0.72, pairwise t-test), which provides evidence against other-learning.
self-oriented choice) and those that they made for the other (during empathic choice) provides a behavioral test of the extent to which the stimulus values were consistent with the self- versus the other-simulation models. The self-simulation model predicts a very high correlation between the bids-for-self and the bids-for-other. In contrast, the other-simulation model predicts a much lower correlation between the two types of bids.
One critical difficulty in carrying out this test is that, regardless of how the bids are computed, they may be correlated because individual preferences are not independent (for example, no one seems to like certain movies). This problem can be circumvented through the following two steps.
Second, we estimated a related regression in which the independent variable was still bid-for-other, but the right-hand-side regressors were bid-for-self and other-bid orthogonalized with respect to bid-for-self. This alternative orthogonalization is useful because now the relative magnitude of the other-bid regression coefficient provides a lower bound on the contribution of other-simulation processes. Both coefficients were again statistically significant (other-bid: mean=.24, SE=.018, p<.0001; bid-for-self: mean=0.81, SE=0.03, p<.0001; t-tests).
Together with the previous result, the two regressions suggest that subjects computed stimulus values during empathic trials using a mixture of self-simulation and other-simulation processes. The relative magnitude of the regressors also suggests that the self-simulation component played a stronger role in our task.
GLM 2 the bid-for-other was orthogonalized with respect to the bid-for-self, and in GLM 3 the opposite orthogonalization was carried out.
We computed the average regression coefficients for bid-for-self and bid-for-other in both models within the vmPFC region that correlates with stimulus values in both empathic and self-oriented choice. We found that all regressors were significantly positive (p<.0001 in all cases, t-test). For completeness, we carried out similar ROI tests in all of the areas that correlated with stimulus values in either empathic or self-oriented choices and found similar results.
These results provide further neurobiological evidence that stimulus values during empathic choice are computed using a mixture of the self- and other-simulation processes.
difference = bid-for-other – bid-for-self (2).
This signal is computationally useful because it would allow subjects to compute their estimate of the value that the other places on the DVDs by computing their own value for it, and then carrying out the additive (and signed) adjustment given by the difference signal.
Table 5. Areas exhibiting a positive correlation with the difference signal during empathic choice (GLM 4)
Region Side k T MNI coordinates
x y z
Inferior parietal lobe/precuneus L 242 5.22 -39 -54 42
Middle frontal gyrus L 121 4.47 -39 45 -6
DISCUSSION
The results presented here provide the following insights about the computational and neurobiological basis of empathic choice. First, empathic choices engage the vmPFC valuation system used in self-oriented decisions, and these value signals seem to be modulated by activity in regions of IPL known to play a critical role in social processes such as empathy. Second, the stimulus values used to make empathic choices are computed using a mixture of self-simulation and other-simulation. Third, during empathic choices, activity in the IPL encodes a variable measuring the distance between the other’s and own preferences. This variable could be used to compute the value of DVDs for other starting from the one’s own value, which provides a hint for how the mixture of self- and other-simulation are implemented.
other. This result parallels a recent finding in an fMRI study of charitable donations (Hare, Camerer et al. 2010), which found that the value signals in vmPFC were modulated by an area of posterior superior temporal cortex commonly associated with mentalizing.
The results also have potential practical applications in psychology and economics. They suggest that the ability to make sound empathic decisions might depend on the ability to compute value signals in vmPFC that give sufficient weight to the differences between others and ourselves. It follows that deficits in empathy and general social cognition might impair the ability to make sound empathic decisions, which could interfere with everyday social interaction. Additional evidence for the role of vmPFC in these types of processes comes from lesion studies (Krajbich, Adolphs et al. 2009).
REFERENCES
Becker, Gordon, Morris H. DeGroot and Jacob Marschak. (1964). "Measuring utility by a single-response sequential method." Behavioral Science9: 226-232.
Boorman, Erie. D., Timothy E. Behrens, Mark W. Woolrich, et al. (2009). "How green is the grass on the other side? Frontopolar cortex and the evidence in favor of alternative courses of action." Neuron62(5): 733-743.
Decety, Jean. (2010). "To What Extent is the Experience of Empathy Mediated by Shared Neural Circuits?" Emotion Review2(3): 204-207.
Fehr, Ernst and Colin F. Camerer. (2007). "Social neuroeconomics: the neural circuitry of social preferences." Trends Cogn Sci11(10): 419-427.
FitzGerald, Thomas H. B., Ben Seymour and Raymond J. Dolan. (2009). "The role of human orbitofrontal cortex in value comparison for incommensurable objects." J Neurosci29(26): 8388-8395.
Gitelman, Darren R., William D. Penny, John Ashburner and Karl J. Friston. (2003). "Modeling regional and psychophysiologic interactions in fMRI: the importance of hemodynamic deconvolution." Neuroimage19(1): 200-207.
Harbaugh, William T., Ulrich Mayr and Daniel R. Burghart. (2007). "Neural responses to taxation and voluntary giving reveal motives for charitable donations." Science
316(5831): 1622-1625.
Hare, Todd A., Colin F. Camerer and Antonio Rangel. (2009). "Self-control in decision-making involves modulation of the vMPFC valuation system." Science 324: 646-648.
Hare, Todd A., John O'Doherty, Colin F. Camerer, et al. (2008). "Dissociating the role of the orbitofrontal cortex and the striatum in the computation of goal values and prediction errors." J Neurosci28(22): 5623-5630.
Hsu, Ming, Cedric Anen and Steven R. Quartz. (2008). "The right and the good: distributive justice and neural encoding of equity and efficiency." Science
320(5879): 1092-1095.
Kable, Joseph W. and Paul W. Glimcher. (2007). "The neural correlates of subjective value during intertemporal choice." Nat Neurosci10(12): 1625-1633.
Kable, Joseph W. and Paul W. Glimcher. (2009). "The neurobiology of decision: consensus and controversy." Neuron63(6): 733-745.
Kennerley, Steven W., Aspandiar F. Dahmubed, Antonio H. Lara and Jonathan D. Wallis. (2009). "Neurons in the frontal lobe encode the value of multiple decision variables." J Cogn Neurosci21(6): 1162-1178.
Kennerley, Steven W. and Jonathan D. Wallis. (2009). "Evaluating choices by single neurons in the frontal lobe: outcome value encoded across multiple decision variables." Eur J Neurosci29(10): 2061-2073.
Litt, Ab, Hilke Plassmann, Baba Shiv and Antonio Rangel. (2011). "Dissociating valuation and saliency signals during decision making." Cereb Cortex21: 95-102. Marks, Gary and Norman Miller. (1987). "Ten years of research on the false-consensus
effect: An empirical and theoretical review." Psyc Bull 102: 72-90.
Mitchell, Jason P. (2009). "Inferences about mental states." Philosophical transactions of the Royal Society of London. Series B, Biological sciences364(1521): 1309-1316. Mitchell, Jason P., Mahzarin R. Banaji and C. Neil Macrae. (2005). "The link between
social cognition and self-referential thought in the medial prefrontal cortex." Journal of Cognitive Neuroscience17(8): 1306-1315.
Mitchell, Jason P., Todd F. Heatherton and C. Neil Macrae. (2002). "Distinct neural systems subserve person and object knowledge." Proc Natl Acad Sci U S A 99(23): 15238-15243.
Mitchell, Jason P., C. Neil Macrae and Mahzarin R. Banaji. (2006). "Dissociable medial prefrontal contributions to judgments of similar and dissimilar others." Neuron
50(4): 655-663.
Moll, Jorge, Frank Krueger, Roland Zahn, et al. (2006). "Human fronto-mesolimibic networks guide decisions about charitable donations." PNAS 103(42): 15623-15628.
Padoa-Schioppa, Camillo. (2009). "Range-adapting representation of economic value in the orbitofrontal cortex." J Neurosci29(44): 14004-14014.
Padoa-Schioppa, Camillo and John A. Assad. (2008). "The representation of economic value in the orbitofrontal cortex is invariant for changes of menu." Nat Neurosci
11(1): 95-102.
Plassmann, Hilke, John O'Doherty and Antonio Rangel. (2007). "Orbitofrontal cortex encodes willingness to pay in everyday economic transactions." J Neurosci27(37): 9984-9988.
Plassmann, Hilke, John O'Doherty and Antonio Rangel. (2010). Aversive goal values are negatively encoded in the medial orbitofrontal cortex at the time of decision making. Journal of Neuroscience, 30: 10799-10808.
Rangel, Antonio, Colin F. Camerer and P. Read Montague. (2008). "A framework for studying the neurobiology of value-based decision making." Nat Rev Neurosci
9(7): 545-556.
Rangel, Antonio and Todd A. Hare (2010). "Neural computations associated with goal-directed choice." Curr Opin Neurobiol20(2): 262-270.
Rolls, Edmund R., Ciara McCabe and Jerome Redoute. (2008). "Expected Value, Reward Outcome, and Temporal Difference Error Representations in a Probabilistic Decision Task." Cereb Cortex18: 652-663.
Ross, Lee, David Greene and Pamela House. (1977). "The false consensus effect: An egocentric bias in social perception and attribution processes." J Exp Soc Psy13(3): 279-301.
Saxe, Rebecca. (2006). "Uniquely human social cognition." Curr Opin Neurobiol 16(2): 235-239.
Saxe, Rebecca and Nancy Kanswisher. (2003). "People thinking about thinking people: The role of the temporo-parietal junction in “theory of mind"." Neuroimage19(4): 1835-1842.
Saxe, Rebecca and Anna Wexler (2005). "Making sense of another mind: The role of the right temporo-parietal junction." Neuropsychologia43(10): 1391-1399.
Shamay-Tsoory, Simone G. (2011). "The neural bases for empathy." The Neuroscientist : a review journal bringing neurobiology, neurology and psychiatry 17(1): 18-24. Tankersley, Dharol, C. Jill Stowe and Scott A Huettel. (2007). "Altruism is associate with
an increased neural response to agency." Nature Neuroscience10(2): 150-151. Tom, Sabrina M., Craig R. Fox, Christopher Trepel and Russell A. Poldrack. (2007). "The
Neural Basis of Loss Aversion in Decision-Making Under Risk." Science 315: 515-518.
Tricomi, Elizabeth, Antonio Rangel, Colin F. Camerer and John P. O’Doherty. (2010). "Neural evidence for inequality-averse social preferences." Nature 463(7284): 1089-1091.
Valentin, Vivian V., Anthony Dickinson, and John P. O'Doherty. (2007). "Determining the neural substrates of goal-directed learning in the human brain." J Neurosci27(15): 4019-4026.
APPENDIX
CONTROL BEHAVIORAL EXPERIMENT
Twenty subjects (mean age: 21.85, SE: 0.76), with the same demographic characteristics required for the main fMRI experiment, participated in a control behavioral study. None of the subjects had previously participated in the fMRI experiment. The experiment was almost identical to the fMRI task, except for the following differences. First, half of the subjects completed the empathic choice task first and the self-oriented choice task second; the other half of the subjects completed the tasks in the opposite order. Second, the inter-trial interval was reduced to 1s, as was the interval between bids and feedback in empathic choice trials. Third, subjects completed both tasks on the same day.
Fig. S1. Results of the companion behavioral experiment
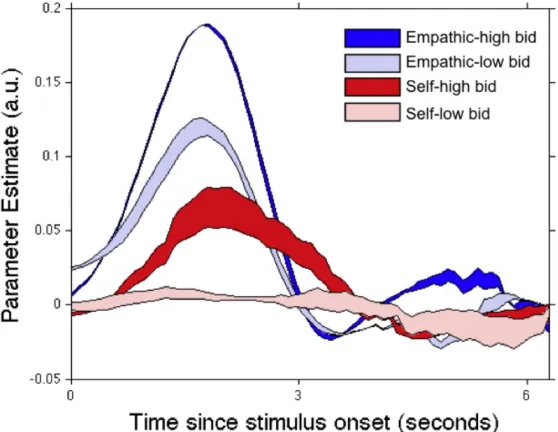
TIME COURSE ANALYSIS FOR vmPFC
time series into ten time bins per TR, and smoothed it using cubic spline interpolation. Fourth, we then estimated a finite impulse response model that included separate regressors for the following conditions: 1) empathic choice trials for which the bid-for-other was above average for those trials, 2) empathic choice trials for which the bid-for-other was below average, 3) self-oriented choice trials for which the bid-for-self was above average, 4) self-oriented choice trials for which the bid-for-self was below average. The model was estimated at each time bin within a 20 second window starting at the onset of the DVD cue. Finally, the parameter estimates for each condition were averaged across participants at each time point. Fig. S2 depicts the results of the analysis.
EXPERIMENTAL INSTRUCTIONS FOR SELF-ORIENTED CHOICE
TASK
In this experiment you will be bidding on a number of DVDs. To enable this, please note that $10 has been placed on the table in front of you. This money is yours to use for this experiment. Whatever money you do not use will be yours to keep at the conclusion of the experiment.
In each round of the experiment, you will see the cover of a DVD displayed on the screen. Please look carefully at the DVD and decide how much you would be willing to pay for the DVD on a scale from $0 to $10, in increments of $2. So the possible bids are $0, $2, $4, $6, $8, and $10. If you already own the DVD, bid as if you do not own it. When you are ready, enter your bid for that item using the relevant key on the keypad. If you take longer than 6 seconds to enter a bid, one will randomly be selected for you. You should bid in the following way: press “z” for $0, “2” for $2, “4” for $4, “6” for $6, “8”
for $8, and “0” for $10.
will generate a random number from 0 to 10. If this number is larger than or equal to your bid for the DVD in the selected round, you do not purchase the DVD and keep the entire $10. If the number is less than your bid, you pay the amount of the random number for the DVD, obtain the DVD, and keep the rest of the $10. Note that if a DVD you already own is selected, you will simply keep the $10 and will not have to buy the DVD.
For example, let’s say trial number 22 was selected, and that in this trial you were shown a picture of the DVD “The Godfather” and entered a bid of $6. Let’s say the random number drawn was 8. In this case, you would not be able to buy the DVD and would keep the entire $10. However, if the number drawn were 4, you would purchase the DVD for $4 and keep the remaining $6.
You will now go through five practice rounds to ensure you have understood the instructions. These practice rounds will not have any consequences for the actual experiment and they will not be used in selecting a random round at the end. Please observe the DVD carefully and enter a bid when you are ready, but within 6
EXPERIMENTAL INSTRUCTIONS FOR EMPATHIC CHOICE TASK
In this experiment you will be asked to think about the preferences of another person (whom you will learn about shortly) and how much that person would be willing to pay for a number of DVD titles that will be shown to you.
Todd came to our lab last year and went through 100 rounds of the following experiment. In each round, he was shown a DVD cover and was asked how much he would be willing to pay for that DVD from $0 to $10 in increments of $2 (e.g., either $0, $2, $4, $6, $8, or $10). We used a type of auction that ensured that Todd was telling the truth.
This experiment will also consist of 100 rounds. In each round of the experiment, you will see the cover of a DVD displayed on the screen for 6 seconds. This DVD cover is EXACTLY the same one seen by Todd. So for each DVD that you will see, we know how much Todd was willing to pay for it.
Your task in this experiment will be to try to guess the amount that Todd was willing to pay for each DVD shown.
entered for you randomly. You should bid in the following way: press “z” for $0, “2” for $2, “4” for $4, “6” for $6, “8” for $8, and “0” for $10.
After you have entered your choice, you will see a fixation screen with a “+” sign for 1 second. After this fixation screen, in order to help you to get to know Todd better, you will be told how far off your guess was from Todd’s actual bid. For example, if your guess was $6 while Todd’s guess was $4, you will be told that the error in your guess was 2. If your guess was $6 while Todd’s guess was $10, you will be told that the error in your guess was -4. Your goal is to minimize the absolute value of the error – you want to obtain errors as close to 0 as possible for your guesses.
Following the feedback, after several seconds you will be shown another DVD cover, and you will complete the same task again for each round of the experiment.
After you have completed all rounds of the experiment, ONE of the rounds will be selected at random. The computer will generate a random number from 0 to 10. If this number is larger than your bid for the DVD in the selected round, you do not purchase the DVD with Todd's money, and we give the entire $10 to Todd. If the number is less than or equal to your bid, you pay out from Todd's money the amount of the random number for the DVD, and Todd obtains the DVD and keeps the rest of the $10.
For example, let's say trial number 22 was selected, and that in this trial you were shown a picture of the DVD "The Godfather" and thought that Todd would be willing to pay $6 for the DVD. Let's say the random number drawn was 8. In this case, Todd would not be able to buy the DVD and would keep the entire $10. However, if the number drawn were 4, Todd would have to purchase the DVD for $4 and keep the remaining $6.
CHAPTER
2
Variation in Loss Aversion is Associated with Differential Attention to
Losses
INTRODUCTION
Little, however, is known about the mechanisms responsible for individual variations in loss aversion. A number of studies have shown that loss aversion can be affected by framing (Gneezy & Potters, 1997; Thaler, Tversky, Kahneman, & Schwartz, 1997). Some studies have proposed that loss aversion may be due to some basic hedonic property of our reaction to losses, or to an error in judgment caused by an exaggeration of losses’ actual proportion (Camerer, 2005; Kermer, Driver-Linn, Wilson, & Gilbert, 2006; Novemsky & Kahneman, 2005). It is difficult to distinguish the drivers of loss aversion from purely behavioral data alone because different cognitive processes might result in the same outward behavior. For example, it may be that some people are more loss averse than others because they spend more time evaluating the potential downside of their decisions (say, a day of their company’s revenue) compared to the upside (a boost to the company’s brand), or because they may be more fearful to face a loss in one domain (a new mate) than in another (a new job). Behavioral data can be integrated with psychophysiological methods to shed light on the mechanisms behind differences in loss aversion across individuals, as well as variation within individuals.
employment choice paradigm (Tversky & Kahneman, 1991) and suggest that framing may lead to directional comparisons that distort attribute valuations and thus choice. Krajbich et al. (2010) found that visual fixations drive value computation and integration in a simple binary choice task: the amount of time subjects spent looking at their options had a critical effect on choice. Armel and Rangel (2008) found that willingness to pay for appetitive items increases significantly with computation time, while the opposite is true for aversive items. Similarly, changing the relative amount of time that subjects fixate on an item while making a choice can change the probability the item is chosen (Armel, Beaumel, & Rangel, 2008). Busemeyer et al. (1993) develop a cognitive, dynamic model of decision making called decision field theory (DFT), which describes how preferences might evolve over time before a choice is made. The approach encompasses a range of information accumulation models and has been shown to account for a wide range of phenomena, including the relation between choice and decision time as well as preference reversals (Busemeyer & Diederich, 2002). Glöckner et al. (2011) use an eye-tracking task in which participants select between two non-negative outcome gambles to test several models of information search. They find that choice proportions are in line with the predictions of cumulative prospect theory, and their process data indicate support for decision field theory models.
values for losses compared to gains might be constructed and integrated differently both across and within individuals. Given the effects of attention on the computation and comparison of values during simple choices in these and other studies, we hypothesized that differences in loss aversion across and within individuals might be driven by differential attention to losses compared to gains. We tested this hypothesis by using an eye-tracking decision making experiment in which subjects made binary choices between risky options and a constant sure outcome.
METHODS
Subjects. Twenty-two California Institute of Technology students participated in the experiment (age: mean = 24.3, SD = 4.7; 9 female). Two subjects were excluded because the eye-tracker had difficulty in capturing their gaze. All subjects had normal or corrected-to-normal vision. All subjects were informed about the experiment and gave written consent before participating.
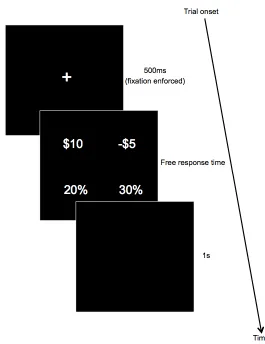
values always appeared on top, while the percentages appeared on bottom, though the locations of gain and loss were randomized. In each trial, subjects made a choice to accept or reject the gamble in favor of a constant sure outcome of $0. Subjects were instructed to press “1” if they strongly accepted the gamble, “2” if they weakly accepted the gamble, “3” if they weakly rejected the gamble and “4” if they strongly rejected the gamble. Subjects completed 384 trials of the task, with a break every 100 trials. The gain outcomes for the lotteries were drawn from the set {$2, 4, 6, 8, 10, 12} and corresponding losses were obtained by multiplying the gain outcomes by a factor ranging from [-¼,-2] in increments of ¼ in a factorial design pairing each gain with each multiplier, yielding a total of 48 gain-loss combinations. These parameters were chosen based on a parameter recovery exercise to find lottery values that were efficient for measuring changes in loss aversion (see Sokol-Hessner et al., 2009). Eight percentage pairings (in which the combined percentages were less than 100%, to increase task difficulty) for each of these combinations resulted in a total of 48*8 = 384 trials. Subjects were paid a show-up fee and experiment completion fee. In addition, five randomly selected trials were implemented for real money at the conclusion of the experiment.
Fig. 1. (a) The time course of a sample trial. Subjects are forced to fixate at the center of the
screen for 500ms. They are then presented with the lottery, divided into its gain and loss
components and the relative probability of obtaining each underneath, and are given as much time
as they want to make their choice. After selection, subjects see a blank screen for 1s before the next
[image:73.612.188.453.209.553.2]Data Analysis. We defined four regions of interest (ROIs), or square boxes surrounding each of the four numbers appearing on the screen during each trial. The ROIs were located in the upper left, lower left, upper right and lower right quadrants of the screen. The eye tracker recorded whether the subjects’ fixations fell into one of the ROIs or was not recorded (a missing fixation). On average, the latency period (time elapsed between stimulus appearance and first recorded fixation) was 247.50 ms (SD = 45.74 ms). The latency period was assumed to be due to peripheral attentional processes involved in first fixation selection and not part of the decision time. Subjects spent 11.94% (SD = 5.12%) of each trial looking at a point other than one of the four ROIs. Missing fixations during the trial were treated as follows:
1) If the missing fixations were recorded between fixations to the same item, then those missing fixations were changed to that item and assumed to be response time. For example, a fixation pattern of “upper left, missing, upper left” would become “upper left, upper left, upper left.”
2) If the missing fixations were recorded between fixations to different items, then those missing fixations were discarded and not counted in response time.
Prospect Theory Model. We estimated the parameters of a prospect theory model for each subject (Tversky & Kahneman, 1992). The subjective utility of a lottery L is defined by four parameters: the gain or loss amount x, the percentage chance of receiving that amount p(x); the loss aversion coefficient 𝜆, and the curvature of the utility function 𝛼
(representing risk aversion due to the presence of diminishing sensitivity to changes in value as the absolute value increases). The subjective utility of each lottery was estimated with Equation (1), while Equation (2) translates the difference between the subjective value of the lottery and the subjective value of the certain amount (0) into a probability of gamble acceptance using the logit sensitivity 𝜇:
𝑢 (𝐿) = 𝑝 𝑥 ∙𝑥! , 𝑥≥ 0
−𝜆∙ 𝑝 𝑥 ∙ 𝑥 ! , 𝑥< 0 (1)
𝑝 𝑎𝑐𝑐𝑒𝑝𝑡 = !
!!!!!!!"#$%&!!!"#$%&'
(2)
𝑙 𝛼,𝜆,𝜇 𝑦 = !"#𝑦!log 𝑝(𝑎𝑐𝑐𝑒𝑝𝑡) +(1−
!!! 𝑦!)log 1−𝑝 𝑎𝑐𝑐𝑒𝑝𝑡 (3)
where 𝛼, 𝜆 and 𝜇 are the parameters to be estimated, y is the subject response, i is the trial number, and p(accept) is as defined in Eq. 2. The Nelder-Mead Simplex Method as implemented in Matlab 2007a was used to obtain estimates for each parameter. If the estimated parameters were close to the actual ones used to create the simulated data, then we could say that the modeling procedure could ‘‘recover’’ parameter values accurately. We used this method of creating our stimuli to improve our ability to accurately recover a range of parameter values from actual participants given the choices made and therefore increase the power of statistical tests to detect differences across and within subjects.
RESULTS
Fig. 1.(b) Psychometric choice curve.
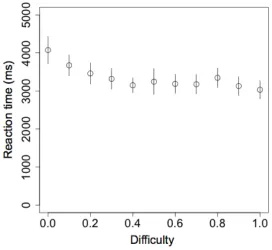
Fig. 1.(c) Reaction time as a function of difficulty (the absolute value of the subjective value of
Fig. 1. (d) Number of fixations as a function of difficulty (the absolute value of the subjective
Attentional biases across subjects. Consistent with the first hypothesis, we found that more loss averse subjects paid more relative attention to losses. The loss aversion coefficient 𝜆 is positively correlated with the relative time spent looking at losses compared to gains (mixed effects regression estimate: 0.08, p=0.02; Fig. 2A).
To calculate the magnitude of this effect across subjects, we performed the following analysis. We took the 5% and 95% individual loss aversion coefficients across subjects, 𝜆!% and 𝜆!"%, respectively, according to the distribution of the relative time spent looking at losses compared to gains. We divided the difference 𝜆!%−𝜆!"% by the difference between the maximum and minimum loss aversion coefficients, 𝜆!"#− 𝜆!"#, to obtain a statistic indicating the percentage of the differences in loss aversion across individuals that is accounted for by value-independent differences in attention: 72.5%.
Across subjects, the correlation between 𝜆 and the total time spent looking at the loss amount was 0.49 (p=0.03), while the correlation between 𝜆 and the total time spent looking at the gain amount was 0.17 (p=0.49). The correlation between 𝜆 and the difference in the percent of time spent looking at the loss amount vs. the gain amount was 0.51 (p=0.02).
below the median. We then estimated the model parameters for each subject in each of the samples independently. We found that the mean difference in 𝜆 between the below and above median samples is 0.12 (SD = 0.026, p=0.02). Fig. 2B shows a scatter plot of the difference in lambda vs. the difference in percent time looking at losses in the two samples (mixed effects regression estimate: 0.06, p=0.05).
To calculate the magnitude of this effect within subjects, for each subject, we looked at the 5% and 95% probability of accepting the lottery, 𝑝!% and 𝑝!"%, as a function of the difference in time spent looking at gains compared to losses. The percent of the variation in
𝜆 that is explained by their fixation is then given by dividing the difference 𝑝!% – 𝑝!"% by
the difference in the time spent looking at gains compared to losses for each individual. On average, we found that the percentage of variation in the probability of accepting the lottery explained by the amount of time spent looking at the loss amount vs. the gain amount is 6.25% (SE = 2.09%). Fig. 2C shows a histogram of the individual percentage variations.
In addition, we found a strong relationship between the last fixation and choice. Specifically, for the last fixation only, subjects spent more time looking at gains compared to losses as expected value increased (mixed effects regression estimate: 28.64, p=0.0001; Fig. 3A). There is thus a bias toward the chosen item.
out that our main effect is simply due to subjects paying more attention to large gains or losses compared to smaller ones, we examine whether the time spent looking at gains compared to losses is a function of the expected value of the lottery. If subjects were paying more attention to more attractive options (e.g., large gains), we would expect this relationship to be positive, resulting in an upward sloping curve. However, we find that there is a nearly flat relationship between expected value and time spent looking at gains compared to losses (mixed effects regression estimate: 2.42, p=0.05; Fig. 3B). While the relationship is significant, it is extremely small and cannot account for the effect. Note that as the last fixation displays a choice bias, the last fixation has been discarded here.
We also examine several additional fixation properties. First, the probability that the first fixation was to the upper left was much higher than for any of the other areas (Fig. S2A). This is likely a cultural artefact from reading left to right and top to bottom. As a result, the first fixation was more likely to be to either the gain or loss amount, while later fixations were more likely to be to the probabilities (Fig. S2B). The last five fixations did not show any bias towards area (Fig. S2C) or type (Fig. S2D). Fixation duration was relatively constant regardless of the item location (Fig. S3A) or type (Fig. S3B).
DISCUSSION
Our study provides insight into how we process risk. The results describe the nature of the attentional processes that guide choice in a simple lottery task. Specifically, we show that attention plays a key role in differences in loss aversion both across and within subjects. Our results suggest a model in which attention must be included to make any inferences on choice. In addition, our data also demonstrate that prospect theory can account for a number of correlations between choice and fixation patterns.
An important question raised by our results is the directionality of the relationship between attention and loss aversion. Is it that more loss averse individuals pay more attention to losses, or that paying more attention to losses causes one to become more loss averse? Several related studies have shown that it is possible to bias choices by exogenously manipulating relative fixation durations and that the fixation process may have a causal effect on the value comparison process (Armel et al., 2008; Shimojo, Simion, Shimojo, & Scheier, 2003). Willemsen et al. (2011) use a path model relating gain vs. loss frames and reference options to information acquisition and choice. They find that the framing of gains vs. losses as well as reference points affect attentional differences, and these changes significantly affect both search and choice. However, the evidence in this study is not sufficient to establish a causal relationship between attention and loss aversion. An experiment manipulating subjects’ fixations to establish causality is thus a promising idea for future research. Another topic for future study is how changes in emotional states, such as stress, may change loss aversion and thus risk aversion. Understanding how loss aversion changes within individuals in different contexts can further uncover the mechanisms driving loss aversion.
An additional question that was not tackled in this paper is how such choices might be implemented in the brain. One brain region that is likely to be involved is the medial orbitofrontal cortex (mOFC), which has been found to encode value at the time of choice in a number of different studies and contexts. Tom et al. (2007) found that activity in mOFC during a monetary risky choice task correlated with stimulus values consistent with the predictions of prospect theory. Furthermore, the authors found that the same area of mOFC correlates with both positive and negative potential outcomes. Similarly, Plassmann et al. (2010) found that mOFC activity correlates with the appetitiveness and aversiveness of foods. Levy et al. (2010) further showed that the mOFC encodes subjective values in choice under risk as well as ambiguity. Basten et al. (2010) found evidence that the brain weighs costs against benefits by combining neural benefit and cost signals into a single representation of value that is accumulated over time, in accordance with perceptual diffusion models. Most recently, Lim et al. (2011) showed that value computations in the mOFC and the ventral striatum are fixation-dependent: activity in the these areas correlates with the difference in value between attended and unattended items. The question of how attention influences these computations and whether these signals are driven by attentional processes elsewhere in the brain remains an open question.
REFERENCES
Armel, K. C., Beaumel, A. and Rangel, A. (2008). Biasing simple choices by manipulating relative visual attention. Judgment and Decision Making, 3(5), 396-403.
Armel, K. C. and Rangel, A. (2008). The impact of computation time and experience on decision values. American Economic Review, 98(2), 163-168. doi: Doi 10.1257/Aer.98.2.163
Barberis, N. and Huang, M. (2001). Mental accounting, loss aversion, and individual stock returns. The Journal of Finance, 56(4), 1247-1292.
Basten, U., Biele, G., Heekeren, H. R. and Fiebach, C. J. (2010). How the brain integrates costs and benefits during decision making. Proceedings of the National Academy of Sciences, 107, 21767-21772.
Benartzi, S. and Thaler, R. H. (1995). Myopic loss aversion and the equity premium puzzle. Quarterly Journal of Economics, 110, 73-92.
Busemeyer, J. R. and Diederich, A. (2002). Survey of decision field theory. Mathematical Social Sciences, 43, 345-370.
Busemeyer, J. R. and Townsend, J. T. (1993). Decision field theory: a dynamic-cognitive approach to decision making in an uncertain environment. Psychological Review, 100(3), 432-459.
Camerer, C., Babcock, L., Loewenstein, G. and Thaler, R. (1997). Labor supply of New York City cabdrivers: One day at a time. Quarterly Journal of Economics, 112(2), 407-441.
Chen, M. K., Lakshminarayanan, V. and Santos, L. R. (2006). How basic are behavioral biases? Evidence from capuchin monkey trading behavior. Journal of Political Economy, 114(3), 517-537.
Glockner, A. and Herbold, A. K. (2011). An Eye-tracking Study on Information Processing in Risky Decisions: Evidence for Compensatory Strategies Based on Automatic Processes. Journal of Behavioral Decision Making, 24(1), 71-98. doi: Doi 10.1002/Bdm.684
Gneezy, U. and Potters, J. (1997). An experiment on risk taking and evaluation periods. Quarterly Journal of Economics, 112(2), 631-645.
Hardie, B. G. S., Johnson, E. J. and Fader, P. S. (1993). Modeling Loss Aversion and Reference Dependence Effects on Brand Choice. Marketing Science, 12(4), 378-394.
Johnson, J. G. and Busemeyer, J. R. (2007). A computational model of the attentional processes used to generate decision weights in risky decision making. Under revision for Cognition.
Kahneman, D. and Tversky, A. (1979). Prospect Theory - Analysis of Decision under Risk. Econometrica, 47(2), 263-291.