Copyright © 2001, American Society for Microbiology. All Rights Reserved.
Comparative Performance of Three Viral Load Assays on
Human Immunodeficiency Virus Type 1 (HIV-1) Isolates
Representing Group M (Subtypes A to G) and Group O:
LCx HIV RNA Quantitative, AMPLICOR HIV-1 MONITOR
Version 1.5, and Quantiplex HIV-1 RNA Version 3.0
PRISCILLA SWANSON,1VINCENT SORIANO,2SUSHIL G. DEVARE,1ANDJOHN HACKETT, JR.1*AIDS Research and Retrovirus Discovery, Abbott Laboratories, Abbott Park, Illinois 60064,1and
Service of Infectious Diseases, Instituto de Salud Carlos III, Madrid, Spain2
Received 12 September 2000/Accepted 29 November 2000
The performance of the LCx HIV RNA Quantitative (LCx HIV), AMPLICOR HIV-1 MONITOR version 1.5 (MONITOR v1.5), and Quantiplex HIV-1 RNA version 3.0 (bDNA v3.0) viral load assays was evaluated with 39 viral isolates (3 A, 7 B, 6 C, 4 D, 8 E, 4 F, 1 G, 4 mosaic, and 2 group O). Quantitation across the assay dynamic ranges was assessed using serial fivefold dilutions of the viruses. In addition, sequences of gag -encoded p24 (gagp24),pol-encoded integrase, andenv-encoded gp41 were analyzed to assign group and subtype and to assess nucleotide mismatches at primer and probe binding sites. For group M isolates, quantification was highly correlated among all three assays. In contrast, only the LCx HIV assay reliably quantified group O isolates. The bDNA v3.0 assay detected but consistently underquantified group O viruses, whereas the MON-ITOR v1.5 test failed to detect group O viruses. Analysis of target regions revealed fewer primer or probe mismatches in the LCx HIV assay than in the MONITOR v1.5 test. Consistent with the high level of nucleotide conservation is the ability of the LCx HIV assay to quantify efficiently human immunodeficiency virus type 1 group M and the genetically diverse group O.
Clinical management of human immunodeficiency virus type 1 (HIV-1) infection and implementation of treatment strate-gies rely on the quantitative measurement of HIV-1 RNA in plasma (26, 35). A variety of quantitative viral load assays have been developed; they differ in sensitivity, dynamic range, target region, sample volume, specimen preparation, methods of nu-cleic acid amplification, and detection (20a, 21, 22, 28). Most of these tests were calibrated against a well-characterized stan-dard stock of subtype B HIV-1 RNA prepared by the Viral Quality Assurance Laboratory of the AIDS Clinical Trials Group (43). Although the majority of viral load monitoring is currently performed in North America and Europe, where HIV-1 group M subtype B infections predominate, subtype B represents only about 3% of HIV-1 infections worldwide. With the continued evolution of the HIV-1 epidemic, increasing numbers of non-subtype-B infections are being identified in Europe and the United States (1, 3, 7, 17). In France, a study of blood donors from 1985 to 1995 revealed an increase in the prevalence of non-subtype-B infections from 4% to more than 20% over the 10-year period (4). Moreover, as a result of coinfection of individuals with viral strains of more than one subtype, increasing numbers of intersubtype recombinant forms of HIV-1 are being observed (31, 34). Intergroup (group M-group O) recombinant viral strains have also been identified (30, 40). In fact, of the completely sequenced HIV-1 genomes,
nearly 20% have a mosaic structure consisting of at least two subtypes (33).
Given the continued global expansion of non-subtype-B and recombinant forms of HIV-1, it is important that commercial nucleic acid-based tests detect and quantify accurately even the most genetically divergent HIV-1 strains. The impact of ge-netic variation on quantification by viral load assays has been well documented and may include underquantification or even complete lack of detection (2, 8, 10, 18, 19, 24, 29). Recombi-nation between distantly related strains may further contribute to the emergence of HIV-1 variants that are not detected efficiently by current molecular tests.
Comparison of viral load assays has been complicated by the lack of universal standards and/or quality control panels that encompass non-B subtypes. A panel of 30 HIV-1 isolates rep-resenting group M subtypes A to G was recently developed and characterized at the Walter Reed Army Institute of Research (WRAIR, Bethesda, Md.) (20, 27). Ultimately, calibrated stan-dards prepared from these or similar isolates will be used to evaluate the performance of viral load assays.
In the present study, we evaluated the performance of three commercial HIV-1 ultrasensitive viral load assays, LCx HIV RNA Quantitative assay (LCx HIV; Abbott Laboratories, Ab-bott Park, Ill.), AMPLICOR HIV-1 MONITOR version 1.5 ultrasensitive test (MONITOR v1.5; Roche Diagnostics, Branchburg, N.J.), and Quantiplex HIV-1 RNA version 3.0 assay (bDNA v3.0; Bayer Diagnostics, Emeryville, Calif.), with dilution series of 39 virus isolates. The viruses represent HIV-1 group M subtype A to G and group O strains and include the WRAIR clade panel. In addition,gag-encoded p24 (gagp24), * Corresponding author. Mailing address: Abbott Laboratories,
D-9NG, Bldg. AP20, 100 Abbott Park Rd., Abbott Park, IL 60064-6015. Phone: (847) 938-0457. Fax: (847) 937-1401. E-mail: john.hackett @add.ssw.abbott.com.
862
on May 15, 2020 by guest
http://jcm.asm.org/
pol-encoded integrase (pol IN), and env-encoded gp41 (env
gp41) immunodominant region (IDR) sequences were charac-terized for each isolate to more definitively establish group and subtype designations and to evaluate the degree of genetic diversity at primer and probe binding sites.
MATERIALS AND METHODS
Viral isolates.WRAIR, provided 30 of the HIV-1 group M isolates, including 1 A, 6 B, 5 C, 3 D, 8 E, 3 F, 1 G, and 3 circulating recombinant forms (CRF), through generous donations from Merlin Robb and Nelson Michael. Virus concentrations were determined by electron microscopy (EM), p24 antigen con-centration, and quantitative viral load analysis (20, 27). An additional nine isolates, including seven HIV-1 group M isolates (two A, one B, one C, one D, one F, and one mosaic) and one group O isolate, were obtained through a Collaborative Research and Development Agreement with the Centers for Dis-ease Control and Prevention (Atlanta, Ga.); the other group O isolate was received from Serologicals, Inc., Atlanta, Ga. Cell-free virus stocks from the 39 HIV-1 isolates were prepared by SRA Technologies, Rockville, Md.
Molecular characterization of the viral isolates.Three regions of the HIV-1 genome were targeted for sequence analysis:gagp24 (399 nucleotides [nt]),pol IN (864 nt), andenvgp41 IDR (369 nt). Each virus stock was diluted 100-fold in HIV-1-seronegative human plasma. Total nucleic acid was extracted from 200l of each sample using a QIAamp blood kit (Qiagen Inc., Chatsworth, Calif.). Primers and conditions used for reverse transcription (RT)-PCR amplification of gagp24,polIN, andenvgp41 IDR and for automated sequence analysis and phylogenetic analysis have been described previously (5, 6, 14, 39, 41).
Preparation of the clade dilution panel.A 273-member panel was prepared by diluting each of the 39 virus isolates in defibrinated HIV-1-seronegative human plasma to achieve a target concentration of approximately 4.5 to 5.5 log10HIV-1
RNA copies/ml (31,623 to 316,223 copies/ml), followed by six fivefold serial dilutions of each isolate. Panels were distributed into 1.2-ml aliquots and stored at⫺70°C until testing.
HIV-1 load determination. (i) LCx HIV assay.The LCx HIV assay was per-formed according to the manufacturer’s specifications. This competitive RT-PCR assay targets thepolIN region of HIV-1 (20a, 39). With the 1.0-ml sample preparation protocol, the upper limit of quantitation (ULQ) and the lower limit of quantitation (LLQ) are 1,000,000 (6.0 log10) copies/ml and 50 (1.7 log10)
copies/ml, respectively.
(ii) MONITOR v1.5 test.MONITOR v1.5 test was performed at LabCorp (Research Triangle Park, N.C.) according to the manufacturer’s instructions. The procedure requires 0.5 ml of plasma and uses RT-PCR to target thegagp24 region of HIV-1 (38). The ULQ and LLQ are 75,000 (4.88 log10) copies/ml and
50 (1.7 log10) copies/ml, respectively.
(iii) bDNA v3.0 assay.bDNA v3.0 assay was performed at the Instituto de Salud Carlos III (Madrid, Spain) according to the manufacturer’s instructions. The procedure requires 1.0 ml of plasma and relies on signal amplification technology. In this assay, HIV-1 RNA is hybridized to a series of oligonucleotide probes complementary to highly conserved regions of the HIV-1polgene (9). The ULQ and LLQ are 500,000 (5.7 log10) copies/ml and 50 (1.7 log10) copies/ml,
respectively.
RESULTS
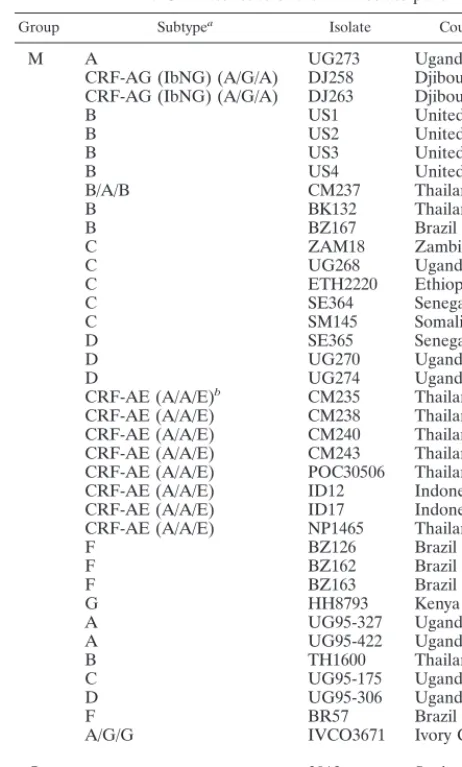
Genetic analysis of viral isolates.Thirty-nine HIV-1 isolates were used to evaluate the three commercial viral load assays. The country of origin and group and subtype assignments for each isolate are shown in Table 1. Subtypes for the WRAIR isolates (27) were based on limited sequence analysis of re-gions of thegagand/orenvgenes obtained from proviral DNA. The complete genome sequence was available for only four of the samples: CRF-AG (IbNG), DJ263; C, ETH2220; CRF-AE, CM240; and G, HH8793. To increase the integrity of group and subtype assignments three distinct regions (gag p24/pol
IN/envgp41 IDR) of the genome were sequenced from each isolate. Based on the phylogenetic analysis (data not shown), the panel was composed of the following group M subtypes: three A, seven B, six C, four D, eight CRF-AE, four F, one G, and four intersubtype recombinants (two CRF-AG [IbNG],
one A/G/G, and one B/A/B); it also contained two group O viruses. Of note, the additional sequence information obtained for isolate CM237, previously reported as subtype B, revealed that it is an intersubtype A-B recombinant withpolIN derived from subtype A.
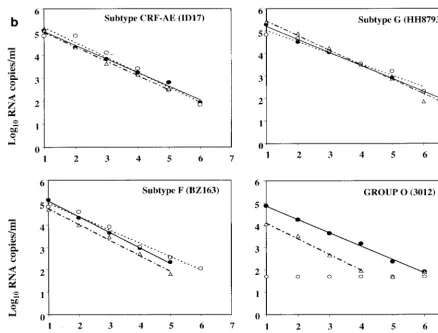
[image:2.612.318.549.81.465.2]Viral load determination.To assess the linearity of quanti-fication across the dynamic ranges of the viral load assays, seven dilutions each of the 39 viral isolates were prepared with HIV-1-seronegative human plasma. Concentrations of the se-rial fivefold dilutions were expected to target from the ULQ to below the LLQ (50 RNA copies/ml) of all three assays. All 273 dilution panel members were evaluated in each of three com-mercial assays: LCx HIV assay, MONITOR v1.5 test, and bDNA v3.0 assay. The linear regression of each isolate dilution series was calculated from panel members quantified within the assay dynamic ranges. Results for representative HIV-1 group M subtypes A through G and group O are shown in Fig. 1a and b. For all 37 group M isolates, a linear decrease in quantification was observed across each dilution series in all three assays. No subtype-specific deficiency was apparent for
TABLE 1. Characteristics of the viral-isolate panel
Group Subtypea Isolate Country
M A UG273 Uganda
CRF-AG (IbNG) (A/G/A) DJ258 Djibouti CRF-AG (IbNG) (A/G/A) DJ263 Djibouti
B US1 United States
B US2 United States
B US3 United States
B US4 United States
B/A/B CM237 Thailand
B BK132 Thailand
B BZ167 Brazil
C ZAM18 Zambia
C UG268 Uganda
C ETH2220 Ethiopia
C SE364 Senegal
C SM145 Somalia
D SE365 Senegal
D UG270 Uganda
D UG274 Uganda
CRF-AE (A/A/E)b CM235 Thailand
CRF-AE (A/A/E) CM238 Thailand
CRF-AE (A/A/E) CM240 Thailand
CRF-AE (A/A/E) CM243 Thailand
CRF-AE (A/A/E) POC30506 Thailand
CRF-AE (A/A/E) ID12 Indonesia
CRF-AE (A/A/E) ID17 Indonesia
CRF-AE (A/A/E) NP1465 Thailand
F BZ126 Brazil
F BZ162 Brazil
F BZ163 Brazil
G HH8793 Kenya
A UG95-327 Uganda
A UG95-422 Uganda
B TH1600 Thailand
C UG95-175 Uganda
D UG95-306 Uganda
F BR57 Brazil
A/G/G IVCO3671 Ivory Coast
O 3012 Spain
08692A United States aMosaic forms and CRF are listed by subtype ofgag/pol/env.
bDenoted as subtype E by Michael et al. (27).
VOL. 39, 2001 COMPARATIVE PERFORMANCE OF THREE VIRAL LOAD ASSAYS 863
on May 15, 2020 by guest
http://jcm.asm.org/
any of the assays. Correlation coefficients for the LCx HIV assay, MONITOR v1.5 test, and bDNA v3.0 assay ranged from 0.9786 to 0.999, 0.9765 to 0.9985, and 0.9736 to 0.999, respec-tively. In contrast, group-specific differences between the as-says were readily apparent. Relative to the LCx HIV assay, bDNA v3.0 detected but consistently underquantified both group O isolates by 0.7 to 1.21 log10copies/ml across the assay dynamic range. MONITOR v1.5 failed to detect any of the group O panel members.
In a comparison of the LCx HIV assay and the MONITOR v1.5 test, 209 of 273 samples (76.6%) were quantified by both assays. Of the 209, 20 had viral loads above the ULQ of the MONITOR v1.5 test. The 189 dilutions with viral loads falling within the dynamic ranges of both assays are plotted in Fig. 2. All group M isolates were quantified efficiently by both assays. The observed correlation was 0.9494, with a slope of 0.9587. Viral loads determined for all 189 dilutions were within one log10copy/ml between the assays; in fact, 175 of 189 viral loads (92.6%) were within 0.5 log10. Ten individual dilutions, includ-ing 4 A, 1 C, 1 CRF-AE, and 4 CRF-AG (IbNG), were quan-tified at 0.51 to 0.85 log10copies/ml higher in the MONITOR v1.5 test than in the LCx HIV assay. Relative to the LCx HIV assay, the MONITOR v1.5 test underquantified four individual dilutions (three subtype CRF-AE and one subtype B) by 0.52
to 0.75 log10copies/ml. The most notable difference between the assays was the inability of the MONITOR v1.5 test to detect either of the group O dilution series.
When the LCx HIV assay was compared to the bDNA v3.0 assay, 207 of 273 samples (75.8%) were quantified by both assays. Six samples were above the ULQ of the bDNA v3.0 assay. Figure 3 depicts a scatter diagram of the 201 dilutions with viral loads within the dynamic ranges of both assays. The observed correlation was 0.9498, with a slope of 0.8348. With two exceptions, viral loads were within one log10 copies/ml between the assays; moreover, for 172 of 201 dilutions (85.6%), results were within 0.5 log10. For 13 individual dilu-tions, including 3 A, 5 C, 4 CRF-AG (IbNG), and 1 A/G/G, viral loads were 0.52 to 0.85 log10 copies/ml higher in the bDNA v3.0 assay than in the LCx HIV assay. The bDNA v3.0 assay underquantified 14 individual dilutions (1 C, 1 D, 4 CRF-AE, 2 F, 1 mosaic, and 5 group O) by 0.51 to 1.0 log10 copies/ml relative to the LCx HIV assay. Although the bDNA v3.0 assay detected group O samples, the values were consis-tently underestimated compared to those from the LCx HIV assay. In fact, two group O panel members were underquan-tified by 1.21 log10RNA copies/ml relative to the results from the LCx HIV assay.
Of the 201 of 273 samples (73.6%) quantified by both the FIG. 1. Representative fivefold dilution series of HIV-1 group M and group O isolates. (a) Group M subtypes A, B, C, and D. (b) Group M subtypes CRF-AE, F, and G and group O. Log10RNA copies per milliliter are plotted versus the dilution series order, whereby numbers 1 through
7 correspond to neat, 1:5, 1:25, 1:125, 1:625, 1:3,125, and 1:15,625 dilutions, respectively. Quantitative values and linear regression trend lines for each of the three commercial viral load tests are shown as follows: solid circle and solid line, LCx HIV assay; open circle and dotted line, MONITOR v1.5 test; and triangle and dotted-dashed line, bDNA v3.0 assay.
on May 15, 2020 by guest
http://jcm.asm.org/
MONITOR v1.5 test and the bDNA v3.0 assay, 21 had viral loads above the ULQ of one or both assays. Figure 4 shows a scatter diagram of the 180 dilutions with viral loads within the dynamic ranges of both tests. The correlation was 0.9663, with a slope of 1.1088. Viral loads for all dilutions were within 1 log10copies/ml between the assays, and 90.6% of them were within 0.5 log10. Relative to MONITOR v1.5, bDNA v3.0 un-derquantified 13 individual dilutions (2 A, 1 C, 2 D, 1 CRF-AE, and 7 F) by 0.52 to 0.77 log10 copies/ml. Viral loads determined by the bDNA v3.0 assay were 0.55 to 0.84 log10 copies/ml higher for four individual dilutions (one C, two CRF-AE, and one G) than were those determined by the MONI-TOR v1.5 test.
Nucleotide mismatches at primer and probe sites.Genetic characterization of the viral isolates included sequence analysis ofpolIN andgagp24, target regions of the LCx HIV assay and the MONITOR v1.5 test, respectively. This characterization provided the opportunity to examine nucleotide conservation within primer and probe binding sites for these assays. Fewer mismatches were observed for the LCx HIV assay than for the MONITOR v1.5 test (Table 2). For group M isolates, the LCx HIV assay had a mean number of total nucleotide mismatches of 1.0 (range, 0 to 3 mismatches). In contrast, the MONITOR v1.5 test had three times more total nucleotide mismatches, with a mean of 3.2 changes (range, 0 to 8). At the forward primer, reverse primer, and probe sites, the mean numbers of
nucleotide mismatches for group M samples were 0.6, 0.3, and 0.1, respectively, in the LCx HIV assay and 1.2, 0.6, and 1.3 in the MONITOR v1.5 test. For the two group O samples, the LCx HIV assay had a total of 5 mismatches, in contrast to a mean of 22 (range, 21 to 23) changes observed with the MON-ITOR v1.5 test. In the LCx HIV assay, the largest number of mismatches was observed for the forward primer and group O sequences (mean and range, four). For the 39polIN sequences examined, 92.3% of samples had two or fewer total nucleotide mismatches at the primer and probe binding sites in the LCx HIV assay. In contrast, only 38.5% of thegagp24 sequences had two or fewer mismatches at the MONITOR v1.5 test primer and probe binding sites.
DISCUSSION
[image:4.612.82.521.70.403.2]First-generation HIV-1 quantitative tests were developed and standardized by use of sequence information derived pri-marily from subtype B infections. Because nucleic acid-based assays depend on hybridization, primer and probe mismatches with non-subtype-B isolates can significantly reduce the effi-ciency of quantification, thus severely limiting the utility of these tests. Within the last few years, viral load assays with improved performance characteristics for non-subtype-B HIV-1 variants have become available. The ultrasensitive MONITOR v1.5 test has incorporated a new primer set, modifications in FIG. 1—Continued.
VOL. 39, 2001 COMPARATIVE PERFORMANCE OF THREE VIRAL LOAD ASSAYS 865
on May 15, 2020 by guest
http://jcm.asm.org/
cycling conditions, and increased sample volume, resulting in significant improvement in subtype detection and assay sensi-tivity (13, 42). The ultrasensitive LCx HIV assay utilizes RT-PCR and targets a highly conserved region ofpolIN to provide subtype-independent quantification (20a, 39). The addition of a new target probe set, optimization of the buffer to increase signal, and incorporation of isoC and isoG into the probe binding regions have resulted in enhanced bDNA v3.0 assay specificity and sensitivity (25). Recently, increasing emphasis has been placed on the development of assays capable of quan-tifying both group M and group O strains (11, 39; H. Schiltz, C. Wild, N. Kilgore, P. Singh, M. Chorley, and M. Garcia-Mei-jide, Abstr. 7th Conf. Retroviruses Opportunistic Infections, p. 220, 2000).
The availability of well-characterized viral isolates composed of different subtypes is valuable for comparing the perfor-mance of viral load assays. A panel of 30 isolates representing HIV-1 group M subtypes A to G was assembled by WRAIR (20, 27). A current limitation of this panel is that in most cases, the subtype was designated based on limited sequence infor-mation. Assignment of a subtype based on analysis of an indi-vidual region of the genome can be unreliable, particularly for isolates derived from regions where multiple subtypes cocircu-late (34). Thus, when target regions differ between assays, such a subtype designation may not be predictive of the ability of each test to quantify HIV-1 accurately. In fact, based on ad-ditional data for thegagp24 andpolIN regions generated in this study, isolate CM237, previously designated as subtype B based onenv, was shown to be a B/A/B (gag, pol, env) recom-binant virus. Complete genome characterization would
in-crease the value of the panel and would allow examination of nucleotide mismatches regardless of assay target region.
Of interest, although the viral loads determined by the three assays were in close agreement, they were 0.5 to 1.5 log10 copies/ml lower than the theoretical virion counts predicted by either EM or p24 antigen measurements. This finding high-lights a critical issue in the construction of quality control panels, namely, the method(s) used to calibrate virus stocks. For the WRAIR panel, determination of p24 antigen concen-tration and virus particle count by EM were previously shown to be highly correlated (27). Based on our data, use of multiple quantitative assays to establish a nominal value would be the most reliable method of calibrating virus stocks to be used for nucleic acid testing.
[image:5.612.114.494.68.333.2]In the present study, dilution series of 39 virus isolates were quantified using three commercial ultrasensitive viral load as-says: LCx HIV assay, MONITOR v1.5 test, and bDNA v3.0 assay. For group M isolates (subtypes A to G), there was a high degree of correlation between quantified values obtained across the dynamic ranges for all three tests, and no subtype-specific differences were observed. These data are consistent with the results obtained with HIV-1-infected plasma, showing broad subtype specificity of the LCx HIV assay and improved subtype detection by MONITOR v1.5 relative to earlier-gen-eration tests, particularly for subtypes A, E, F, and G (2, 39, 42). As observed previously, there was close agreement be-tween the MONITOR v1.5 test and the bDNA v3.0 assay for subtype B specimens (12, 16). Our data extend the observation to other group M subtypes (A to G) and to circulating inter-subtype recombinant forms of the virus. These results contrast FIG. 2. Comparison of HIV-1 group M virus isolate dilution panel members quantified by the LCx HIV assay and the MONITOR v1.5 test. Group (Grp) O dilution panel members were not quantified by MONITOR v1.5 but are shown for comparison. The lower limit of quantification is shown by broken lines at 1.7 log10RNA copies/ml (50 copies/ml).
on May 15, 2020 by guest
http://jcm.asm.org/
with results obtained with earlier versions of these assays (10, 18).
When dilution profiles of each isolate were examined, all quantified isolates had linear correlation coefficients of better than 0.97 for all three assays. For group M isolates, values quantified across the assay dynamic ranges were within 1 log difference among the three commercial tests. Although there was a tendency of MONITOR v1.5 to underquantify high-end panel members relative to the other tests, the molecular basis for this reduction is unclear. At the low end of the titration series (near 50 copies/ml LLQ), 8 to 12% of the group M dilution panel members were quantified by a single assay. Since quantitative assays are less precise around the LLQ and values fluctuate statistically, single-replicate testing of samples with low viral titers may not predict accurately the virus concentra-tions in these dilution panel members.
Although HIV-1 group O strains are endemic to West Cen-tral Africa and represent a small proportion of total HIV infections, they have attained a relatively widespread distribu-tion, having been identified in France, Spain, Germany, Bel-gium, and the United States (15, 32, 36, 37). Moreover, the recent identification of intergroup (M-O) recombinant strains (30, 40) raises the possibility that genetically divergent sub-genomic regions of group O viruses may become even more widespread when placed in the context of group M genomes. This type of recombination has the potential to dramatically increase the effective global distribution of HIV-1 group O. Thus, it has become increasingly important that viral load assays accurately quantify even the most genetically divergent HIV-1 variants.
Of the three assays examined, only the LCx HIV assay
dem-onstrated the ability to detect and reliably quantify group O viruses. The linear quantification of the two group O strains by the LCx HIV assay is consistent with its performance with group O virus-infected plasma samples (39). The performance of the bDNA v3.0 assay with serial dilutions of group O isolates was considerably less robust. Relative to the LCx HIV assay, values ranged from 0.7 to 1.2 log10copies/ml lower with the bDNA v3.0 assay, and several of the low-end dilutions were not detected. Thus, although the bDNA v3.0 assay is capable of detecting high-titer group O viruses, the accuracy of quantifi-cation is suspect, limiting its utility for monitoring group O virus-infected patients (23). The MONITOR v1.5 test failed to detect any of the group O dilutions analyzed. This result is particularly striking when one considers that both the LCx HIV and the bDNA v3.0 assays measured⬎4 log copies of virus/ml at the lowest dilution of group O isolate 3012, yet the MON-ITOR v1.5 test failed to detect this dilution panel member.
Sequence characterization of the viral isolates included the target regions of the MONITOR v1.5 test (gagp24) and the LCx HIV assay (polIN). For the group M isolates examined, a higher degree of nucleotide conservation was observed for the LCx HIV assay primer and probe sites. A maximum of three total mismatches were observed in the LCx HIVpolIN target region, compared to eight total mismatches in the MONITOR v1.5 gag p24 target region. The isolates had two or fewer mismatches in 100, 97, and 100% of cases for the forward primer, reverse primer, and probe in the LCx HIV assay and 62, 100, and 92% of cases in the MONITOR v1.5 test, respec-tively. The maximum number of mismatches in the MONI-TOR v1.5 test was observed with subtypes A, F, G, and CRF-AE. A similar analysis of 290 genetically diverse HIV-1-FIG. 3. Comparison of HIV-1 group M and O virus isolate dilution panel members quantified by the LCx HIV assay and the bDNA v3.0 assay. The lower limit of quantification is shown by broken lines at 1.7 log10RNA copies/ml (50 copies/ml).
VOL. 39, 2001 COMPARATIVE PERFORMANCE OF THREE VIRAL LOAD ASSAYS 867
on May 15, 2020 by guest
http://jcm.asm.org/
infected plasma samples revealed up to five total nucleotide mismatches in the primer and probe binding sites in the LCx HIV assay, whereas up to 12 were identified in the MONITOR v1.5 test (39). The CRF-AG (IbNG) isolate, DJ263, trended slightly lower in the LCx HIV assay than in either the MON-ITOR v1.5 test or the bDNA v3.0 assay, particularly at the high end of the dynamic range, but there was no apparent molecular basis for the difference in quantification. The subtype A isolate, UG273, also trended slightly lower in the LCx HIV assay. For this isolate, three nucleotide mismatches were identified within the reverse primer binding site, although none was present at the critical 3⬘end of the primer.
Analysis of the primer and probe target regions in the
ge-netically divergent group O isolates revealed a significant dif-ference between the assays. Whereas the LCx HIV assay had up to 5 total mismatches at primer and probe binding sites, the MONITOR v1.5 test had 21 to 23 mismatches. The large number of nucleotide mismatches provides a molecular basis for the observed inability of MONITOR v1.5 to detect group O samples.
[image:7.612.118.489.70.340.2]Based on the quantification of 37 dilution series of geneti-cally diverse group M isolates, the LCx HIV assay, MONITOR v1.5 test, and bDNA v3.0 assay perform equivalently for group M strains. All group M subtypes (A to G) showed linear dilu-tion profiles across the assay dynamic ranges. In contrast to group M isolates, group O isolates were efficiently quantified FIG. 4. Comparison of HIV-1 group M virus isolate dilution panel members quantified by the MONITOR v1.5 test and the bDNA v3.0 assay. Group O dilution panel members were not quantified by MONITOR v1.5 but are shown for comparison. The lower limit of quantification is shown by broken lines at 1.7 log10RNA copies/ml (50 copies/ml).
TABLE 2. Nucleotide mismatches at primer and probe binding sites for the LCx HIV assay and the MONITOR v1.5 test
Assay or test Primer or probe
Mean (range) no. of nucleotide mismatches for: Group M subtype
Group O
A B C D CRF-AE F G
LCx HIV HIV-1 forward 0 0.1 (0–1) 1.0 (0–2) 0 1 (1) 1 (1) 1 (1) 4 (4)
HIV-1 probe 0 0 0.2 (0–1) 0 0.1 (0–1) 0 0 0
HIV-1 reverse 1 (0–3) 0.4 (0–2) 0.2 (0–1) 0 0 1 (1) 0 1 (1)
Total 1 (0–3) 0.6 (0–2) 1.3 (0–3) 0 1.1 (1–2) 2 (2) 1 (1) 5 (5)
MONITOR
v1.5 SK145 forward 3.3 (3–4) 0 0 0 3 (3) 0.5 (0–1) 2 (2) 9.5 (9–10)
SK102 probe 2 (2) 0.4 (0–1) 2.2 (2–3) 0.2 (0–1) 0.9 (0–1) 2.5 (2–3) 4 (4) 7.5 (7–8)
SKCC1B reverse 0.7 (0–1) 0.3 (0–1) 0.3 (0–1) 1.2 (1–2) 0 2 (2) 2 (2) 5 (5)
Total 6 (6) 0.7 (0–1) 2.5 (2–4) 1.5 (1–2) 3.9 (3–4) 5 (4–6) 8 (8) 22 (21–23)
on May 15, 2020 by guest
http://jcm.asm.org/
[image:7.612.55.551.577.718.2]by only the LCx HIV assay. The bDNA v3.0 assay detected but consistently underquantified group O isolates, and the MON-ITOR v1.5 test failed to detect them. Based on these data, the LCx HIV assay provides a desirable alternative to existing commercial assays for monitoring viral loads. The high level of nucleotide conservation within the target region allows quan-tification of even the most genetically diverse HIV-1 isolates, those of group O. In an era of increasing numbers of infections with recombinant forms of HIV-1 and an ever-changing global distribution of subtypes, the subtype- and group-independent performance of the LCx HIV assay makes it a valuable method for monitoring of patients.
ACKNOWLEDGMENTS
We thank Paloma Ferna´ndez and Conchita Solano for excellent technical assistance and Catherine Brennan, John Robinson, and Sha-ron Muldoon for critical review of the manuscript.
Support for viral load testing was provided by Abbott Laboratories.
REFERENCES
1.Alaeus, A., T. Leitner, K. Lidman, and J. Albert.1997. Most HIV-1 genetic subtypes have entered Sweden. AIDS11:199–202.
2.Alaeus, A., K. Lidman, A. So¨nnerborg, and J. Albert.1997. Subtype specific problems with quantification of plasma HIV-1 RNA. AIDS11:859–865. 3.Arnold, C., K. L. Barlow, J. V. Perry, and J. P. Clewley.1995. At least five
HIV-1 sequence subypes (A, B, C, D, A/E) occur in England. AIDS Res. Hum. Retrovir.11:427–429.
4.Barin, F., A.-M. Courouce, J. Pillonel, and L. Buzelay.1997. Increasing diversity of HIV-1Mserotypes in French blood donors over a 10-year period
(1985-1995). AIDS11:1503–1508.
5.Brennan, C. A., J. K. Lund, A. Golden, J. Yamaguchi, A. S. Vallari, J. F. Phillips, P. K. Kataaha, J. B. Jackson, and S. G. Devare.1997. Serologic and phylogenetic characterization of HIV-1 subtypes in Uganda. AIDS11:1823– 1832.
6.Brennan, C. A., J. Hackett, Jr., L. Zekeng, J. K. Lund, A. S. Vallari, R. K. Hickman, L. Gu¨rtler, L. Kaptue, J. Von Overbeck, H. Hampl, and S. G. Devare.1997. Sequence of gp41envimmunodominant region of HIV type 1 group O from West Central Africa. AIDS Res. Hum. Retrovir.13:901–904. 7.Brodine, S. K., J. R. Mascola, P. J. Weiss, S. I. Ito, K. R. Porter, A. W. Artenstein, F. C. Garland, F. E. McCutchan, and D. S. Burke.1995. Detec-tion of diverse HIV-1 genetic subtypes in the USA. Lancet346:1198–1199. 8.Christopherson, C., J. Sninsky, and S. Kwok.1997. The effects of internal primer-template mismatches on RT-PCR: HIV-1 model studies. Nucleic Acids Res.25:654–658.
9.Collins, M. L., B. Irvine, D. Tyner, E. Fine, C. Zayati, C. Chang, T. Horn, D. Ahle, J. Detmer, L.-P. Shen, J. Kolberg, S. Bushnell, M. S. Urdea, and D. Ho. 1997. A branched DNA signal amplification assay for quantification of nu-cleic acid targets below 100 molecules/ml. Nunu-cleic Acids Res.25:2979–2984. 10. Coste, J., B. Montes, J. Reynes, M. Peeters, C. Segarra, J.-P. Vendrell, E. Delaporte, and M. Segondy.1996. Comparative evaluation of three assays for the quantitation of human immunodeficiency virus type 1 RNA in plasma. J. Med. Virol.50:293–302.
11. de Baar, M. P., A. M. van der Schoot, J. Goudsmit, F. Jacobs, R. Ehren, K. H. M. van der Horn, P. Oudshoorn, F. de Wolf, and A. de Ronde.1999. Design and evaluation of a human immunodeficiency virus type 1 RNA assay using nucleic acid sequence-based amplification technology able to quantify both group M and O viruses by using the long terminal repeat as target. J. Clin. Microbiol.37:1813–1818.
12. Elbeik, T., E. Charlebois, P. Nassos, J. Kahn, F. M. Hecht, D. Yajko, V. Ng, and K. Hadley.2000. Quantitative and cost comparison of ultrasensitive human immunodeficiency virus type 1 RNA viral load assays: Bayer bDNA Quantiplex versions 3.0 and 2.0 and Roche PCR Amplicor Monitor version 1.5. J. Clin. Microbiol.38:1113–1120.
13. Erali, M., and D. R. Hillyard.1999. Evaluation of the ultrasensitive Roche Amplicor HIV-1 Monitor assay for quantitation of human immunodeficiency virus type 1 RNA. J. Clin. Microbiol.37:792–795.
14. Hackett, J., Jr., L. Zekeng, C. A. Brennan, J. K. Lund, A. S. Vallari, R. K. Hickman, L. Gu¨rtler, L. Kaptue´, and S. G. Devare.1997. Genetic analysis of HIV type 1 group O p24gag sequences from Cameroon and Equatorial Guinea. AIDS Res. Hum. Retrovir.13:1155–1158.
15.Hampl, H., D. Sawitzky, M. Sto¨ffler-Meilicke, A. Groh, M. Schmitt, J. Eberle, and L. Gu¨rtler.1995. First case of HIV-1 subtype O infection in Germany. Infectioin23:369–370.
16. Highbarger, H. C., W. G. Alvord, M. K. Jiang, A. S. Shah, J. A. Metcalf, H. C. Lane, and R. L. Dewar.1999. Comparison of the Quantiplex version 3.0
assay and a sensitized Amplicor Monitor assay for measurement of human immunodeficiency virus type 1 RNA levels in plasma samples. J. Clin. Mi-crobiol.37:3612–3614.
17. Holguı´n, A., B. Rode´s, U. Dietrich, and V. Soriano.1999. Human immuno-deficiency viruses type 1 subtypes circulating in Spain. J. Med. Virol.59:189– 193.
18. Holguı´n, A., C. De Mendoza, and V. Soriano.1999. Comparison of three different commercial methods for measuring plasma viraemia in patients infected with non-B HIV-1 subtypes. Eur. J. Clin. Microbiol. Infect. Dis. 18:256–259.
19. Jackson, J. B., E. M. Piwowar, J. Parsons, P. Kataaha, G. Bihibwa, J. Onecan, S. Kabengera, S. D. Kennedy, and A. Butcher.1997. Detection of human immunodeficiency virus type 1 (HIV-1) DNA and RNA sequences in HIV-1 antibody-positive blood donors in Uganda by the Roche AMPLICOR assay. J. Clin. Microbiol.35:873–876.
20. Jagodzinski, L. L., D. L. Wiggins, J. L. McManis, S. Emery, J. Overbaugh, M. Robb, S. Bodrug, and N. L. Michael.2000. Use of calibrated viral load standards for group M subtypes of human immunodeficiency virus type 1 to assess the performance of viral RNA quantitation tests. J. Clin. Microbiol. 38:1247–1249.
20a.Johanson, J., K. Abravaya, W. Caminiti, D. Erickson, R. Flanders, G. Leckie, E. Marshall, C. Mullen, Y. Ohhashi, R. Perry, J. Ricci, J. Salituro, A. Smith, N. Tang, M. Vi, and J. Robinson.The Abbott LCx HIV RNA quantitative assay: a new ultrasensitive assay for quantitation of HIV-1 RNA in plasma. J. Virol. Methods, in press.
21. Kern, D., M. Collins, T. Fultz, J. Detmer, S. Hamren, J. J. Peterkin, P. Sheridan, M. Urdea, R. White, T. Yeghiazarian, and J. Todd.1996. An enhanced-sensitivity branched-DNA assay for quantification of human im-munodeficiency virus type 1 RNA in plasma. J. Clin. Microbiol.34:3196– 3202.
22. Kievits, T., B. van Gemen, D. van Strijp, R. Schukkink, M. Dircks, H. Adriaanse, L. Malek, R. Sooknanan, and P. Lens.1991. NASBA™
isother-mal enzymatic in vitro nucleic acid amplification optimized for the diagnosis of HIV-1 infection. J. Virol. Methods35:273–286.
23. Lerma, J. G., V. Soriano, A. Mas, M. E. Quin˜ones-Mateu, E. J. Arts, and W. Heneine.2000. Quantitation of human immunodeficiency virus type 1 group O load in plasma by measuring reverse transcriptase activity. J. Clin. Micro-biol.38:402–405.
24. Loussert-Ajaka, I., D. Descamps, F. Simon, F. Brun-Ve´zinet, M. Ekwalanga, and S. Sarogosti.1995. Genetic diversity and HIV detection by polymerase chain reaction. Lancet346:912–913.
25. Manegold, C., C. Krempe, H. Jablonowski, L. Kajala, M. Dietrich, and O. Adams.2000. Comparative evaluation of two branched-DNA human immu-nodeficiency virus type 1 RNA quantification assays with lower detection limits of 50 and 500 copies per milliliter. J. Clin. Microbiol.38:914–917. 26. Mellors, J. W., C. R. Rinaldo, Jr., P. Gupta, R. M. White, J. A. Todd, and
L. A. Kingsley.1996. Prognosis in HIV-1 infection predicted by the quantity of virus in plasma. Science272:1167–1170.
27. Michael, N. L., S. A. Herman, S. Kwok, K. Dreyer, J. Wang, C. Christopher-son, J. P. Spadoro, K. K. Y. Young, V. Polonis, F. E. McCutchan, J. Carr, J. R. Mascola, L. L. Jagodzinski, and M. L. Robb.1999. Development of calibrated viral load standards for group M subtypes of human immunode-ficiency virus type 1 and performance of an improved AMPLICOR HIV-1 MONITOR test with isolates of diverse subtypes. J. Clin. Microbiol.37: 2557–2563.
28. Mulder, J., N. McKinney, C. Christopherson, J. Sninsky, L. Greenfield, and S. Kwok.1994. Rapid and simple PCR assay for quantitation of human immunodeficiency virus type 1 RNA in plasma: application to acute retro-viral infection. J. Clin. Microbiol.32:292–300.
29. Parekh, B., S. Phillips, T. C. Granade, J. Baggs, D. J. Hu, and R. Respess. 1999. Impact of HIV type 1 subtype variation on viral RNA quantitation. AIDS Res. Hum. Retrovir.15:133–142.
30. Peeters, M., F. Liegeois, N. Torimiro, A. Bourgeois, E. Mpoudi, L. Vergne, E. Saman, E. Delaporte, and S. Saragosti.1999. Characterization of a highly replicative intergroup M/O human immunodeficiency virus type 1 recombi-nant isolated from a Cameroonian patient. J. Virol.73:7368–7375. 31. Quin˜ones-Mateu, M. E., and E. J. Arts.1999. Recombination in HIV-1:
update and implications. AIDS Rev.1:89–100.
32. Rayfield, M. A., P. Sullivan, C. I. Bandea, L. Britvan, R. A. Otten, C. P. Pau, D. Pieniazek, S. Subbarao, P. Simon, C. A. Schable, A. C. Wright, J. Ward, and G. Schochetman.1996. HIV-1 group O virus identified for the first time in the United States. Emerg. Infect. Dis.2:209–212.
33. Robertson, D. L., F. Gao, B. Hahn, and P. M. Sharp.1997. Intersubtype recombinant HIV-1 sequences, p. 25–30.InB. Korber, B. Foley, T. Leitner, F. McCutchan, B. Hahn, J. W. Mellors, G. Myers, and C. Kuiken (ed.), Human retroviruses and AIDS. Part III. Los Alamos National Laboratory, Los Alamos, N. Mex.
34. Robertson, D. L., J. P. Anderson, J. A. Bradac, J. K. Carr, B. Foley, R. K. Funkhouser, F. Gao, B. H. Hahn, M. L. Kalish, C. Kuiken, G. H. Learn, T. Leitner, F. McCutchan, S. Osmanov, M. Peeters, D. Pieniazek, M. Salminen, P. M. Sharp, S. Wolinsky, and B. Korber.2000. HIV-1 nomenclature pro-posal. Science288:55–57.
VOL. 39, 2001 COMPARATIVE PERFORMANCE OF THREE VIRAL LOAD ASSAYS 869
on May 15, 2020 by guest
http://jcm.asm.org/
35.Saag, M. S., M. Holodniy, D. R. Kuritzkes, W. A. O’Brien, R. Coombs, M. E. Poscher, D. M. Jacobsen, G. M. Shaw, D. D. Richman, and P. A. Volberding. 1996. HIV viral load markers in clinical practice. Nat. Med.2:625–629. 36.Simon, F., I. Loussert-Ajaka, F. Damond, S. Saragosti, F. Barin, and F.
Brun-Ve´zinet.1996. HIV type 1 diversity in northern Paris, France. AIDS Res. Hum. Retrovir.12:1427–1433.
37.Soriano, V., M. Gutie´rrez, G. Garci´a-Lerma, O. Aguilera, A. Mas, R. Bravo, M. L. Pe´rez-Labad, M. Baguero, and J. Gonza´lez-Lahoz.1996. First case of HIV-1 group O infection in Spain. Vox. Sang.71:66.
38. Sun, R., J. Ku, H. Jayakar, J.-C. Kuo, D. Brambilla, S. Herman, M. Rosen-straus, and J. Spadoro.1998. Ultrasensitive reverse transcription-PCR assay for quantitation of human immunodeficiency virus type 1 RNA in plasma. J. Clin. Microbiol.36:2964–2969.
39. Swanson, P., B. J. Harris, V. Holzmayer, S. G. Devare, G. Schochetman, and J. Hackett, Jr.2000. Quantification of HIV-1 group M (subtypes A-G) and group O by the LCx HIV RNA quantitative assay. J. Virol. Methods89:97– 108.
40. Takehisa, J., L. Zekeng, E. Ido, I. Mboudjeka, H. Moriyama, T. Miura, M.
Yamashita, L. G. Gu¨rtler, M. Hayami, and L Kaptue´.1998. Various types of HIV mixed infections in Cameroon. Virology245:1–10.
41. Tanuri, A., P. Swanson, S. Devare, O. J. Berro, A. Savedra, L. J. Costa, J. G. Telles, R. Brindeiro, C. Schable, D. Pieniazek, and M. Rayfield.1999. HIV-1 subtypes among blood donors from Rio de Janeiro, Brazil. J. Acquir. Im-mune Defic. Syndr. Hum. Retrovirol.20:60–66.
42. Triques, K., J. Coste, J. L. Perret, C. Segarra, E. Mpoudi, J. Reynes, E. Delaporte, A. Butcher, K. Dreyer, S. Herman, J. Spadoro, and M. Peeters. 1999. Efficiencies of four versions of the AMPLICOR HIV-1 MONITOR test for quantification of different subtypes of human immunodeficiency virus type 1. J. Clin. Microbiol.37:110–116.
43. Yen-Lieberman, B., D. Brambilla, B. Jackson, J. Bremer, R. Coombs, M. Cronin, S. Herman, D. Katzenstein, S. Leung, H. J. Lin, P. Palumbo, S. Rasheed, J. Todd, M. Vahey, and P. Reichelderfer.1996. Evaluation of a quality assurance program for quantitation of human immunodeficiency virus type 1 RNA in plasma by the AIDS Clinical Trials Group virology laboratories. J. Clin. Microbiol.34:2695–2701.