8. S
ITE
1215
1Shipboard Scientific Party
2BACKGROUND AND OBJECTIVES
Site 1215 (26°01.77′N, 147°55.99′W, 5396 meters below sea level [mbsl]; Fig. F1) is the northernmost of seven sites drilled on the 56-Ma-crust transect during Ocean Drilling Program (ODP) Leg 199. It will be used to investigate paleoceanographic processes in the northern sub-tropical early Eocene Pacific Ocean. Site 1215 is situated north of the Molokai Fracture Zone on typical abyssal hill topography in an area of thin but continuous sediment cover (Fig. F2). Based on magnetic linea-tions, basement age at Site 1215 should be in the youngest part of Anomaly An26R, or ~58 Ma (Cande et al., 1989; timescale of Cande and Kent, 1995). The Cenozoic history of sedimentation in this region was poorly constrained prior to Leg 199 drilling because the nearest Deep Sea Drilling Project (DSDP) or ODP drill site (DSDP Leg 5) is >1000 km away. Based on data from these early rotary coring activities (together with magnetic anomaly maps, a program of shallow-penetration piston coring, and seismic profiling), we expected the sedimentary sequence at Site 1215 to comprise red clays (a mixture of wind-blown dust and au-thigenic precipitates) overlying a basal carbonate section deposited when the site was near the ridge crest in the late Paleocene and early Eocene.
The broad paleoceanographic objectives of drilling the sedimentary sequence anticipated at Site 1215 are as follows: (1) to help define the shift in the Intertropical Convergence Zone through the Paleogene by following the change in eolian-dust composition and flux through time (red clays); (2) to help define the North Equatorial Current and North Pacific subtropical gyre processes (basal carbonates); and (3) sampling of the Paleocene/Eocene (P/E) boundary, one of the most climatologi-cally critical intervals of Cenozoic time. Recovery of deep-sea sediments from this time interval was a high priority because the P/E boundary has never been sampled in the central tropical Pacific Ocean.
160°W 150° 140° 130°
0° 10° 20° 30° N
0 500 1000
Site 1215 Site 1216 Site 1217 Site 1218 Site 1219 Site 1220 Site 1221 Site 1222 Site 40 Site 42 Site 43
Site 69 Site 70 Site 71 Site 72 Site 160 Site 161 Site 162 Site 163 Site 573 Site 574 Site 575 Honolulu
Molokai F.Z.
Clipperton F .Z. Clarion F.Z.
Site 1216 Site 1217 Site 1218 Site 1222 Site 1221 Site 1220 Site 1215
Molokai Fracture Z one
Clario n Fracture Zone
Mahi M ahi Fracture Zone
Site 1219
Clipperton Fractu re Zone 574 573 575 161 162 163 40 42 43 70 71 72 0° 10° 20° 5° 15° 25° N
150°W 145° 140° 135°
km
Leg 199 sites DSDP sites
F1. Site location map, p. 22.
PAT15-Line 4 Bandpass N S 3 km Tw o-w a y tr a veltime (ms) Hour Minute 6600 6700 6800 6900 7000 7100 7200 7300 7400 7500
X Line 6 X Line 7 EW9709-GC21 Site 1215
Basement
P2?
F2. Seismic reflection profile,
p. 23.
1Examples of how to reference the
whole or part of this volume.
2Shipboard Scientific Party
addresses.
Results from Site 1215 will also provide important information to test whether there was significant motion of the Hawaiian hotspot, with respect to the Earth’s spin axis, during the early Cenozoic. At 56 Ma, the backtracked location based upon a hotspot reference frame (Gripp and Gordon, 1990, for 0- to 5-Ma Pacific hotspot rotation pole; Engebretson et al., 1985, for older poles) is ~11°N, 117°W. If significant hotspot motion or true polar wander occurred since 57 Ma (Petronotis et al., 1994), this drill site could have been much closer to the equator.
SUMMARY
Site 1215 (26°1.77′Ν, 147°55.99′W) is located north of the Molokai
Fracture Zone in 5396 m water depth. It is situated on typical abyssal hill topography in an area of thin but continuous sediment cover. Based on magnetic lineations, basement age at this site should be in the youngest part of Anomaly An26r, or ~58 Ma. This site was the northern-most of the transect drilled on crust of this age during Leg 199. Double advanced piston corer (APC)/extended core barrel (XCB) coring at Site 1215 recovered a sedimentary section from red clays at the seafloor to hydrothermal sediments immediately above basalt. The 70-m-thick sed-iment section consists of pelagic red clay (Unit I; ~0–26 meters below seafloor [mbsf]) overlying 42 m of clayey calcareous ooze with chert (Unit II; ~26–68 mbsf) and a thin basal unit of hydrothermal sediment (Unit III; ~68–70 mbsf) over basalt. The upper and lower units of the section are unzoned biostratigraphically, but calcareous fauna and flora and magnetostratigraphy indicate that Unit II is complete (to the zone/ chron level) from the lower Eocene to the upper Paleocene section (NP8–NP12; C25n–C23n; ~56.2–52 Ma). Porosity values increase steadily with depth from ~73%, near the seafloor, to ~91% at the base of the red-clay unit (25.8 mbsf) and then decrease steadily to values near 58% at the base of the Unit II carbonates (67.2 mbsf). The one sample analyzed from lithologic Unit III hydrothermal sediments has a porosity of ~82%. Interstitial pore water profiles from Site 1215 primarily reflect the dissolution of biogenic silica, alteration of underlying basalt, and extremely low levels of labile organic matter available for oxidation.
Highlights
Red-Clay Transition
A light to dark color change occurs in the upper portion of lithologic Unit I (red clay) and has been observed in cores of pelagic clay through-out the north central Pacific Ocean. Light absorption spectroscopy (LAS), elemental solid-phase chemistry, and both discrete and gamma ray attenuation (GRA) bulk density data from Site 1215 indicate a downcore transition from illite to smectite, between ~5 and 10 mbsf, consistent with a change in the source of wind-blown dust from Asia (illite rich) to America (smectite rich) during late Miocene time.
Composite Lower Eocene Section of Clay–Calcareous Ooze
Cycles
combined with biostratigraphic time control, is consistent with a cli-matic forcing related to precession (~19,000- to 23,000-yr period). In
the calcium carbonate (CaCO3)–bearing sediments, both nannofossil
as-semblages and planktonic foraminifers are strongly affected by dissolu-tion, but the former provide well constrained biostratigraphic control. The benthic foraminifers present are characterized by hyaline calcare-ous tests, are better preserved than the planktonic foraminifers, and are promising for shore-based paleoecological and paleooceanographic studies.
First P/E Boundary Section from the Central Tropical Pacific
Ocean
An interval of dark-brown (10YR 2/2) nannofossil clay at ~54.7 mbsf in Hole 1215A (interval 199-1215A-8H-3; 128–148 cm) is interpreted to represent the first P/E boundary section to be recovered from the cen-tral tropical Pacific Ocean. Calcareous nannofossil biostratigraphy indi-cates that the boundary occurs in NP9, and the P/E Benthic Extinction Event (BEE) is observed between ~54.5 and ~55.5 mbsf.
OPERATIONS
Port Call—Honolulu
Leg 199 began at 2200 hr on 23 October 2001, when the first line was passed ashore at Pier 32A in Honolulu, Hawaii. At 0830 hr on 28 Octo-ber, after five days of port call activities, the last line was released, and the transit to the first site of the leg began.
Transit to Site 1215 (PAT-15D)
After clearing the harbor under the pilot’s instructions, the vessel transited the Honolulu channel, passing within a couple nautical miles of Diamond Head. After proceeding into the open ocean, the vessel speed decreased slightly because the transit direction was directly into a 6 m sea/swell. Toward the afternoon of 29 October, the wind and sea conditions began to moderate, and the vessel motion decreased with a concomitant increase in speed. At 1945 hr on 30 October, the vessel speed was reduced to 5 kt, and a 5-mi 3.5-kHz survey was made over proposed Site PAT-15D. The 625-nmi voyage to Site 1215 required 58.5 hr at an average speed of 10.7 kt.
Site 1215
At the conclusion of the 3.5-kHz survey, the thrusters were extended, and the vessel returned to the site coordinates using the Global Posi-tioning System interface to the dynamic posiPosi-tioning system. At 2100 hr on 30 October, the vessel was over the prospective site, and the drilling crew began the assembly of the bottom-hole assembly (BHA). A beacon was deployed at 2144 hr.
Hole 1215A
dual elevator stool) was obtained. After the BHA was made up, the drill string was then deployed to a depth of 5042 mbrf, at which point the armature shaft of the forward M89 traction (drawworks) motor broke. A spare motor was installed, tested, and fully operational by 2400 hr on 31 October 2001.
Hole 1215A was spudded with the APC at 0145 hr on 1 November. The seafloor depth, indicated by the recovery of the initial core, was 5406.3 mbrf. Piston coring advanced to 69.2 mbsf where the formation became too indurated to continue with the APC system. APC coring re-sulted in 68.22 m of core recovered from a 69.2 m hole (98.6%
recov-ery) (Table T1). Cores 4H through 9H were oriented with one Adara
heat flow measurement attempted at 29.7 mbsf (Core 4H). Further heat flow measurements were not made because the cutting structure of the Adara shoe was damaged by chert, and it was obvious that additional runs in this formation would further deplete the limited stock of this hardware.
The XCB was deployed and advanced from 69.2 to 75.4 mbsf. Most of the 80 rotating min for this core were used to advance the last half meter. When the core barrel was retrieved, several basalt fragments were removed from the core catcher, indicating that the objective of coring into basaltic basement was achieved. The one XCB core in Hole 1215A advanced 6.2 m with a recovery of 0.05 m (0.8% recovery). Overall, 68.27 m of core was recovered from 75.4 m of cored section at Hole 1215A.
Hole 1215B
After Hole 1215A operations ceased, the bit was pulled above the sea-floor, and the vessel was offset 20 m south of Hole 1215A. Hole 1215B was spudded with the APC at 0900 hr on 2 November. A seafloor depth of 5406.0 mbrf was inferred by the recovery in the initial core. Piston coring advanced to APC refusal at a depth of 57.0 mbsf with 58.23 mbrf of core recovered (102.2% recovery). Cores 3H through 8H were ori-ented. The XCB was used to advance the hole from 57.0 to 82.8 mbsf. Contact with basement was confirmed when basalt fragments were moved from the core catcher of Core 11X. Only 0.72 m of core was re-covered from the 25.8-m XCB-cored interval (2.8% recovery). Overall,
the average recovery for Hole 1215B was 71.2% (Table T1).
After coring operations ceased in Hole 1215B, the drill string was re-covered and the BHA was dismantled in preparation for the transit to Site 1216. The beacon was successfully recalled and recovered. After the drilling equipment was secured, the vessel departed for Site 1216 at 1430 hr on 3 November.
LITHOSTRATIGRAPHY
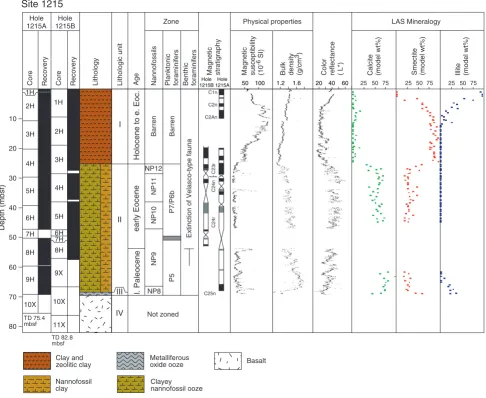
Drilling at Site 1215 recovered a 70-m section dominated by pelagic
clay and clayey nannofossil ooze (Fig. F3). Twenty-six meters of pelagic
clay of early Eocene and younger age overlies 42 m of clayey calcareous ooze and 2 m of basal hydrothermal sediment. The sedimentary section is divided into three lithologic units on the basis of sedimentary facies, and a fourth unit, basalt, lies below. Sediments in Hole 1215B are more disturbed by piston coring through the cherty horizons than those in Hole 1215A, so this description is largely based on results from Hole 1215A.
T1. Coring summary, p. 43.
1H 2H 3H 4H 5H 6H 7H 8H 9X 10X 11X 1H 2H 3H 4H 5H 6H 7H 8H 9H 10X TD 75.4 mbsf TD 82.8 mbsf
Core Lithology Lithologic unit Age Magneticsusceptibility(10
-6 SI) Bulkdensity (g/cm
3) Magneticstratigraphy Color reflectance( L*) NannofossilsPlanktonicforaminifersBenthicforaminifers
Recovery Core Depth (mbsf) Recovery Hole 1215A Hole
1215B Zone Physical properties Site 1215 I II IV III Basalt Clay and zeolitic clay Clayey nannofossil ooze Metalliferous oxide ooze Nannofossil clay
Holocene to e. Eoc.
Barren
Barren
Extinction of Velasco-type fauna
early Eocene l. Paleocene NP12 NP11 NP10 NP9 P5 P7/P6b NP8 Not zoned
501001.21.6 204060
Hole 1215BHole 1215A C24n C24r C25n C23r
25 50 75
Illite(model wt%)
25 50 75
Calcite(model wt%)
25 50 75
Smectite(model wt%)
LAS Mineralogy C1n C2n C2An 10 20 30 40 60 70 80 50
Unit I
Intervals: 1215A-1H, 0 cm, through 4H-4, 109 cm, and 199-1215B-1H, 0 cm, through 4H-4, 55 cm
Depths: 0–25.8 mbsf (Hole 1215A) and 0–29 mbsf (Hole 1215B) Age: Holocene to early Eocene
Lithology: clay and clay with zeolites
Unit I is dominated by clay. The upper few meters are dark yellowish brown (10YR 4/4 and 10YR 3/4) and grade down over an interval of ~100 cm at 5 mbsf to very dark-brown (10YR 2/2) clay. The rich chocolate color of most of Unit I is the dominant characteristic of the unit. Zeolites are common in the interval from ~9 to 24 mbsf, with lithologies of zeolitic clay and clay with zeolites. Zeolites are abundant in thin layers that presumably represent altered volcanic ash. Ash, in the form of clear glass and less commonly brown glass, is present throughout. The most prominent ash/zeolite layer is a strong yellow-brown color (10YR 5/6) and occurs at ~8 mbsf in Hole 1215A and 8.2 mbsf in Hole 1215B. Black chert is present in the bottom 1.5 m of Unit I (24.3–25.8 mbsf) as nod-ules and angular fragments broken by the piston coring process. In Unit I, in contrast to nearly all prior attempts, cherts were recovered together with their host sediments. The dark clays of Unit I are sometimes mot-tled with slightly lighter colors, denoting the burrows, and a faint centi-meter-scale layering is often evident on the digitally enhanced color scans but not on the analog core photographs. A faint, 10-cm-thick horizon of nannofossil clay is present 25 cm above the base of the unit. The lower contact of Unit I is sharp and is present at the top of a much lighter-colored ooze.
Unit II
Intervals: 199-1215A-4H-4, 109 cm, through 9H-5, 150 cm, and 199-1215B-4H-4, 55 cm, through 10X
Depths: 25.8–67.2 mbsf (Hole 1215A) and 29–76 mbsf (Hole 1215B) Age: early Eocene to latest Paleocene
Lithology: clayey nannofossil ooze and nannofossil clay
Unit II consists of alternating intervals of brown (10YR 3/4 to 10YR 5/ 3) clayey nannofossil ooze and darker nannofossil clay (dark brown, 10YR 2/2, to dark grayish brown, 10YR 4/2). The cyclic variations are on length scales of ~20–50 cm and extend throughout the unit. An interval of dark-brown (10YR 2/2) nannofossil clay at ~54.7 mbsf in Hole 1215A (interval 199-1215A-8H-3, 128–148 cm) may represent the P/E boundary event that is characterized elsewhere by a negative carbon isotopic ex-cursion (Dickens et al., 1995). Immediately above this dark layer, sedi-ment flow-in occurs and disturbs the material in Section 199-1215A-8H-3 from 128 cm up to ~40 cm. The lower boundary of the dark layer is sharp; below it the sediments are disturbed by the coring process but re-tain a coherent stratigraphy.
6H, about half of Core 5H, and two-thirds of Core 8H. Disturbance in Hole 1215B was generally worse than in Hole 1215A.
Unit III
Intervals: 199-1215A-9H-6, 0 cm, through 9H-CC and traces in Core 199-1215B-10X
Depths: 67.2–69.2 mbsf (Hole 1215A) and traces (Hole 1215B) Age: latest Paleocene
Lithology: metalliferous oxide ooze
Unit III is a very dark-brown (10YR 2/2) metalliferous sediment. It is a nearly pure oxide ooze (see “Solid-Phase Geochemistry,” p. 16, in “Geochemistry”) (Table T12; Fig. F15) containing little clay and no ash or fossils. This thin unit immediately overlies the basalt of Unit IV.
Unit IV
Intervals: Cores 199-1215A-10X and 199-1215B-11X
Depths: 69.2 mbsf (Hole 1215A) and 76.2 mbsf (Hole 1215B) Age: late Paleocene
Lithology: basalt
Three pebbles were recovered from the bottom of Hole 1215A and two from the base of Hole 1215B. The pebbles are brownish gray aphanitic basalt, the largest of which was ~3 cm in diameter. Two pebbles had por-tions of a glassy margin.
Discussion/Summary
The sedimentary section at Site 1215 records ~5 m.y. of early Paleo-gene biogenic deposition, followed by 51 m.y. of pelagic clay accumula-tion. The light to dark color change in the upper portion of Unit I has been observed in cores of pelagic clay throughout the north central Pa-cific Ocean and may represent a change in the source of the dust that makes up the clays from China above to North America below (Kyte et al., 1993). The lower Eocene oozes display a cyclicity, probably driven by Milankovitch processes. The P/E boundary is quite distinct, is associ-ated with a clay-rich layer, and is nicely fossiliferous at Site 1215. At the base of the sediments, the hydrothermal oozes record the final phase of hydrothermal activity at the nearby ridge axis.
BIOSTRATIGRAPHY
Calcareous Nannofossils
Two holes were cored at Site 1215, recovering red clays of unknown Cenozoic age (Unit I) and underlying late Paleocene and early Eocene nannofossil clay (Unit II) (see “Lithostratigraphy,” p. 4). A maximum penetration of 82.8 m was reached in Hole 1215B (Fig. F4). In the CaCO3-bearing sediments (Unit II), nannofossil assemblages are all
strongly affected by dissolution, resulting in fragmentation and/or loss of many characteristic morphological features such as central areas in placolith and zygodisc assemblages. Dissolution has largely prevented secondary calcite overgrowth of critical groups in lower Paleogene bio-stratigraphy, such as the Rhomboaster-Tribrachiatus lineage and discoast-ers, whose features are commonly obscured by secondary calcite over-growths in less dissolved assemblages.
The calcareous nannofossil-bearing section recovered at Site 1215 en-compasses the interval from the lower Eocene Zone NP12 (CP10) to the upper Paleocene Zone NP8 (CP7). The distribution of calcareous nanno-fossil datums is given in Table T2.
The youngest nannofossil assemblage encountered contained age di-agnostic forms such as Discoaster lodoensis (5–7 rays) and Tribrachiatus orthostylus (indicating Zone NP12) from Sample 199-1215A-4H-5, 67 cm, to 4H-6, 66 cm. The latter sample showed evolutionary early vari-ants of D. lodoensis. Other typical Zone NP12 assemblage components are Chiasmolithus solitus, Coccolithus pelagicus, Discoaster barbadiensis, Discoaster binodosus, Discoaster falcatus (8–10 rays), Sphenolithus morifor-mis, Sphenolithus radians, and Toweius spp.
The transition from red clays to carbonate-bearing sediments in Core 199-1215A-4H is complicated by a short interval showing reversed stratigraphic order. Three samples investigated from Section 199-1215A-4H-4 (taken at the 83-, 110-, and 145-cm levels) are character-ized by the absence of D. lodoensis and the presence of T. orthostylus, in-dicating Zone NP11 (CP9b). Sample 199-1215A-4H-4, 137 cm, however, contained rare D. lodoensis, suggesting that the transition sediment from the red clays to the carbonate-bearing sediments is, in part, a re-working product of Zone NP11–age sediments.
The NP10/NP11 (CP9a/CP9b) boundary was observed in the upper half of Section 199-1215A-5H-5, where the crossover in abundance be-tween Tribrachiatus contortus and T. orthostylus is present. The evolution-ary transition from Sphenolithus anarrhopus to S. radians was observed between Samples 199-1215A-5H-2, 80 cm, and 5H-1, 80 cm. Discoaster diastypus appeared between Samples 199-1215A-1, 119 cm, and 6H-2, 122 cm. These two samples also contain the transition from Tribrachi-atus bramlettei to T. contortus. The first occurrence of T. bramlettei was observed between Samples 199-1215A-6H-5, 85 cm, and 6H-CC, mark-ing the NP9/NP10 boundary. The former sample showed rare T. bram-lettei together with Rhomboaster spp. and evolutionary intermediate forms.
Core 1215A-7H only recovered two chert pieces. In Core 199-1215A-8H, sediments are highly disturbed (see “Lithostratigraphy,”
p. 4). Flow-in occurred from the top of the core through Section 199-1215A-8H-3, 121 cm, and the nannofossil assemblages, observed in scattered samples from this interval, showed a mixing of NP11 to NP9 assemblages. In samples from Sections 199-1215A-8H-4 to 8H-6, par-tially dissolved assemblages belonging to the lower part of Zone NP9 were observed, with common Discoaster multiradiatus and abundant
Core Recovery 1H 2H 3H 4H 5H 6H 7H 8H 9X 10X 11X Core Depth (mbsf) Recovery Hole 1215A Hole 1215B 1H 2H 3H 4H 5H 6H 7H 8H 9H 10X TD 75.4 mbsf TD 82.8 mbsf Eocene Paleoc. upper lower Barren
Calcerous nannofossils Planktonicforaminifers
Series Not zoned P6b P7/ P5 Benthicforaminifers
Extinction of Velasco-type fauna
Barren Not zoned 0 10 20 30 40 60 70 80 50 NP12 NP11 NP10 NP9 NP8
F4. Distribution of
biostrati-graphic zones and datum events, p. 25.
T2. Distribution of calcareous
Fasciculithus spp. (e.g., Fasciculithus schaubii, Fasciculithus richardii, Fasci-culithus involutus, and Fasciculithus tympaniformis).
Despite the strong dissolution of the nannofossil assemblage in Core 199-1215A-9H, it was possible to place the NP8/NP9 boundary, defined by the first occurrence of D. multiradiatus, between Samples 199-1215A-9H-5, 30 cm, and 199-1215A-9H-5, 70 cm. The lowermost fossiliferous Sample, 199-1215A-9H-6, 10 cm, taken from metalliferous sediments in Unit III, contains few, poorly preserved nannofossils. Discoaster mohleri, Dis-coaster okadai, and Ericsonia robusta are present in that sample, indicat-ing Zone NP8.
Sample 199-1215B-10H-CC belongs to Zone NP9, with common D. multiradiatus, common Fascicultihus spp., common Toweius eminens,
and few Ellipsolithus macellus and Ericsonia subpertusa.
Planktonic Foraminifers
Planktonic foraminifers in Hole 1215A cores are highly affected by dissolution; therefore, their biostratigraphic utility is limited. At best, samples contain reasonably diverse (~12 species), poorly to moderately well preserved tropical assemblages of early Eocene–late Paleocene planktonic foraminifers, whereas in other samples planktonic forms are completely absent or only the most dissolution resistant species remain (Table T3). Our plan was to focus our efforts on producing a planktonic foraminifer biostratigraphy for Hole 1215A only, and to this end we se-lected one sample per section from the lightest-colored samples, which we assumed had the highest carbonate content. However, the core catcher samples from Hole 1215B turned out to have considerably bet-ter preservation than nearly all of the inbet-tervals sampled in Hole 1215A, so our analysis includes data from both holes.
Planktonic foraminifers were absent from a sample of water and mud collected from the core top that was dominated by radiolarians. The dark-brown clays of lithologic Unit I (0–25.8 mbsf, Hole 1215A) are also barren of planktonic foraminifers (Fig. F4). Planktonic species are recog-nizable from Sample 199-1215A-4H-6, 64–66 cm, in the clayey nanno-fossil ooze of Unit II, following the color change from dark to lighter brown sediments below Sample 199-1215A-4H-5, 120–122 cm (27.40 mbsf). Preservation is generally poor and assemblages are heavily af-fected by dissolution. Therefore, only broad zonal ranges could be as-signed (Fig. F4).
Samples 199-1215A-4H-7, 46–48 cm, 4H-CC, and 5H-1, 12–14 cm, contain heavily encrusted and rather poorly preserved representatives of the genus Acarinina, including Acarinina soldadoensis, Acarinina nitida, Acarinina coalingensis, and Globanomalina pseudoimitata, indicat-ing a broad late Paleocene–early Eocene age (Zones P4c–P7). Also present in these, and all subsequent planktonic foraminifer–containing samples, is a small (63 to 125 µm), unidentified four-chambered species (referred to here as cf. Tenuitella sp.), which possesses an umbilical-ex-traumbilical aperture and a relatively high spire. This form appears to have a delicate wall, possibly microperforate, yet the species persists even when all other elements of the planktonic assemblage have dis-solved.
Preservation improves downhole in the middle-lower part of Core 199-1215A-5H, resulting in slightly more diverse assemblages indicative of an early Eocene age. In addition to the acarninids listed above, vari-ous species belonging to the genus Morozovella are present in these sam-ples, including Morozovella gracilis, Morozovella formosa, Morozovella
T3. Distribution of planktonic
aequa and Morozovella subbotinae, Morozovella marginodentata, and Moro-zovella lensiformis. Occasional specimens of Chiloguembelina wilcoxensis, Subbotina praecentralis, and Subbotina sp. were also recorded. Because of differential preservation and sporadic occurrence of morozovellids, only broad zonal ranges can be assigned. Samples 199-1215A-4H-CC through 5H-CC are placed in the zonal range P7–P6b based on the pres-ence of M. formosa. Samples from the middle of Cores 199-1215A-5H through 9H also contain M. aequa, and these suggest a slightly older zonal range between Zones P6b and P5.
Core catcher samples from Cores 199-1215B-4H through 8H contain slightly better preserved assemblages than those from Hole 1215A. The top of Zone P5 lies in the core gap between Cores 199-1215B-5H and 7H (47.86–52.57 mbsf), as suggested by the presence of M. acuta in Samples 1215B-7H-CC and 8H-CC, whereas the overlying Sample 199-1215B-5H-CC has M. formosa and M. lensiformis. We have not identified any samples indicative of Subzone P6a but cannot determine whether there is an unconformity in the section or merely the dissolution of marker species.
Samples from Section 199-1215A-9H-1, 70–72 cm, through 9H-CC (60.4–69.1 mbsf) contain mainly benthic foraminifers with a few heavily encrusted planktonic specimens of Globanomalina pseudoimitata
and are consistent with the late Paleocene age determined from calcare-ous nannofossils and benthic foraminifers.
Benthic Foraminifers
Benthic foraminifers were analyzed mainly in core catcher samples from Holes 1215A and 1215B (Table T4). Three additional samples (199-1215A-8H-1, 90.5–92.5 cm; 8H-3, 50.5–52.5 cm; and 8H-4, 13.5–15.5 cm) were analyzed to constrain the level of the P/E boundary BEE. Benthic foraminifers are abundant and generally moderately well pre-served, except for samples from Sections 199-1215A-1H-CC through 3H-CC, 9H-CC, and 199-1215B-1H-CC through 8H-CC, all of which are barren. The benthic foraminifers present are characterized by hyaline calcareous tests. Agglutinated forms are rare. The distribution of benthic species is presented in Table T4. The highest stratigraphic oc-currence of the Velasco-type benthic foraminifers, which are the char-acteristic deepwater benthic forms of the Paleocene (Van Morkhoven et al., 1986), is shown in Figure F4.
Benthic foraminiferal assemblages from Samples 199-1215A-4H-CC through 6H-CC are characterized by lower diversities than other sam-ples, and Nuttallides truempyi, Abyssamina inflata, and Abyssamina poagi
account for up to 70% of the total assemblage. Cibicidoides species are commonly present, but they are small in size. A high abundance of abysamminid species suggests a 3000- to 5000-m paleodepth, according to Tjalsma and Lohmann (1983). The assemblages characterized by lower diversity and predominance of Nuttallides truempyi represent the early Eocene assemblage of the benthic fauna. Sample 199-1215A-8H-CC contains much of the Velasco-type assemblage, such as Aragonina velascoensis, Gyroidinoides globosus, Pullenia coryelli, and Gavelinella bec-cariiformis, which are common in upper Maastrichtian to Paleocene sed-iments. Thus, this sample can be assigned a Paleocene age. Of these spe-cies, A. velascoensis and P. coryelli are considered to have a lower bathyal to abyssal depth habitat (Van Morkhoven et al., 1986). Neoeponides hill-ebrandti and Anomalinoides praeacuta are deeper elements among the as-semblage (Tjalsma and Lohmann, 1983). These lines of evidence
sug-T4. Distribution of benthic
gest that the Paleocene and Eocene fauna grew in lowermost bathyal and abyssal depths.
The main composition of the benthic foraminifer assemblages from Hole 1215B are similar to those from Hole 1215A. However, benthic for-aminifers are rare in Sample 199-1215B-5H-CC, which contains a high abundance of planktonic foraminifers. The planktonic to benthic fora-minifer ratio of this sample is ~54:1. It is assumed that this high ratio is not a direct result of paleodepth but may be attributed to dissolution of benthic foraminifers. The Paleocene assemblage of Sample 199-1215B-8H-CC is more diverse in comparison with that of Sample 199-1215A-8H-CC and contains Osangularis velascoensis and agglutinated species such as Tritaxia globulifera, Spiroplectammina jarvisi, as well as Dorothia trochaoides. These species are also included in the Velasco-type fauna and indicate lowermost bathyal and abyssal depths.
The BEE was observed between Samples 199-1215A-8H-3, 50.5–52.5 cm, and 8H- 4, 13.5–15.5 cm. The Velasco-type foraminifers (such as
Pullenia coryelli, Aragonina velacoensis, Gavelinella beccariiformis, and Gy-roidinoides globosus) are common and indicate that the assemblage pre-dates the extinction event. Roughly 30% of the Velasco-type assem-blage became extinct at this site. The assemassem-blage after the extinction is dominated by Nuttallides truempyi (46% of the total assemblage vs. 14% before the BEE). Diversity continues to decline between Samples 199-1215A-8H- 3, 50.5–52.5 cm, and 8H-1, 90.5–92.5 cm.
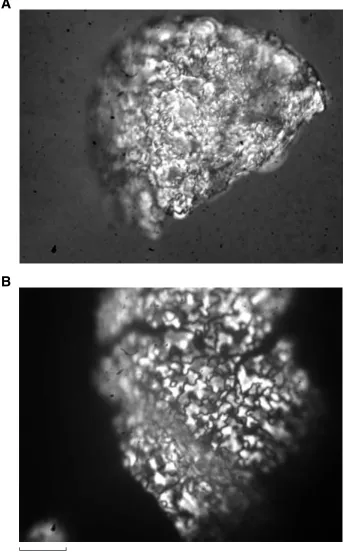
It is noted that the Paleocene foraminiferal walls are particularly well preserved, in contrast to the early Eocene foraminifers. Optical wall tex-ture of the Paleocene Abyssamina quadrata shows clear crystal bound-aries, whereas that of the Eocene A. quadrata shows slightly recrystal-lized boundaries (Fig. F5).
PALEOMAGNETISM
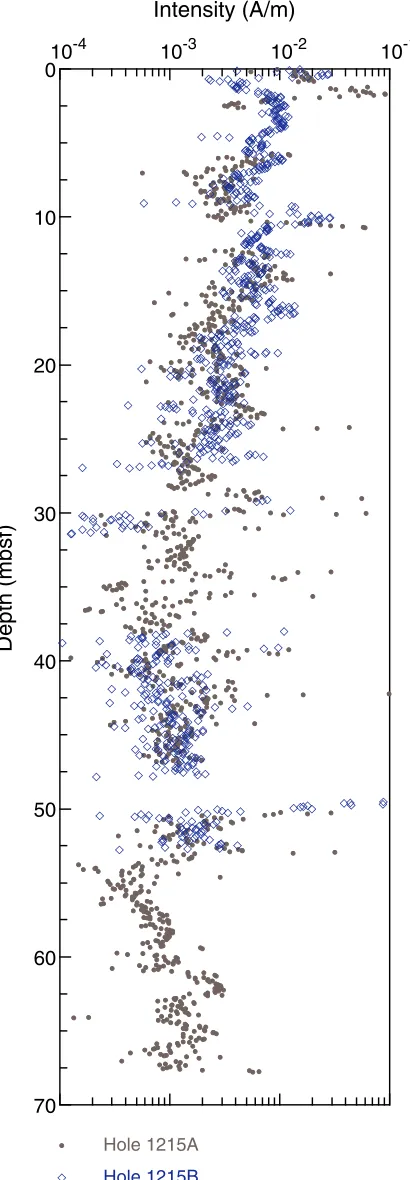
All archive-half core sections from Holes 1215A and 1215B, except those where the sediment was clearly disturbed, were measured on the shipboard pass-through cryogenic magnetometer. A total of 83 core sec-tions were measured from 15 of the 21 cores recovered in the two holes. The natural remanent magnetization (NRM) was measured at 5-cm in-tervals in each core section, followed by four–five steps of alternating-field (AF) demagnetization up to a maximum peak alternating-field of 20 mT. The maximum peak field was set at this level to avoid compromising the ar-chive sections for possible shore-based (U-channel or discrete sample) studies. In addition, 34 discrete samples were taken to conduct more detailed progressive demagnetization. Several of the measured cores from the middle and bottom parts of the holes are in poor condition, primarily because of drilling disturbance. This deformation has the po-tential to render the pass-through magnetometer data useless as a result of the averaging of divergent magnetic vectors when drilling slurry is in the instrument’s sensing region. Most of the cores, however, displayed consistent remanent magnetization directions. NRM magnetization in-tensities were in the order of 10–1 to 10–2 A/m and decreased to ~10–3 to
10–2 A/m after partial AF demagnetization (Fig. F6). A large group of
NRM inclinations showed steep downward directions (~70°), indicative of a drilling-induced overprint. This overprint was effectively removed with AF demagnetization, typically disappearing by the 10- to 15-mT demagnetization step. Most magnetic directions did not reach a stable point between 5 and 20 mT, suggesting that the characteristic remanent
20.6 µm A
B
F5. Test walls of Abyssamina
quadrata, p. 26.
10-4 10-3 10-2 10-1
0
10
20
30
40
50
60
70 Hole 1215A Hole 1215B
Intensity (A/m)
Depth (mbsf)
F6. Magnetization intensities after
magnetization (ChRM) has been only partially isolated. As a result, more detailed shobased measurements will be necessary to obtain re-liable magnetization directions.
Orientation
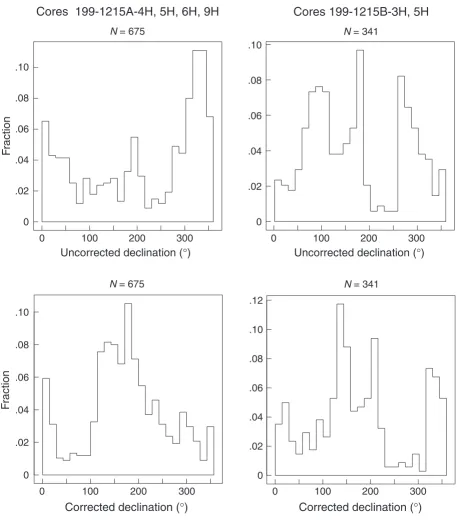
The Tensor tool was used to orient cores starting from Cores 199-1215A-4H and 199-1215B-3H. The orientation was successful in align-ing the declination between most cores. Figure F7 illustrates the distri-bution of declination prior to orientation and the improved grouping after applying the Tensor correction. The Tensor tool reorientation of declinations was very useful in assessing polarity changes in the Eocene unit because the magnetic inclination is very shallow and cannot be used by itself to establish polarity changes.
Discrete Sample Analysis
Oriented discrete samples (8-cm3 cubic plastic boxes) were collected
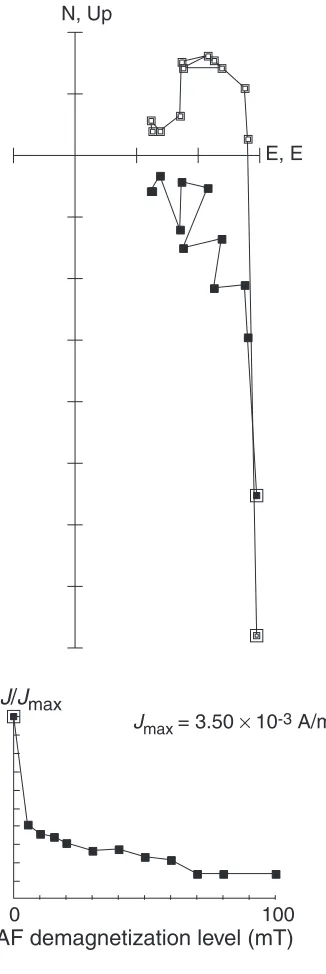
from every undisturbed section from Hole 1215A. These samples were subjected to stepwise AF demagnetization up to 100 mT to assess the magnetic stability of the sediments and estimate the demagnetization step suitable for removing the secondary magnetization (Fig. F8). Many samples show a strong and steep magnetic overprint, though an AF de-magnetization of 20 mT is typically sufficient to determine the polarity.
Magnetic Polarity Stratigraphy
In the measured archive halves of Hole 1215A, the 20-mT AF demag-netization directions have inclination values clustering around 29° with a large scatter (σ = 21), indicating that only part of the overprint was successfully removed. The magnetic declinations of the oriented cores are also quite scattered (Fig. F7) and mostly directed toward the south.
Paleomagnetic data acquired from several sections of Cores 199-1215A-8H and 199-1215B-4H were discarded because of excessive drill-ing disturbance, in part related to the presence of chert nodules (see
“Unit II,” p. 5, in “Lithostratigraphy”). In many places, it was noted that identifiable bedding features in these sediments were highly de-formed, having been pushed downward at the edges of the core. If these cores are to produce a reliable magnetic stratigraphy, it must come from postcruise analyses of discrete samples taken in the middle part of the core.
In those parts of the record where the remanence directions are not noisy, it is possible to interpret the inclination and declination, after 20-mT AF cleaning, in terms of polarity zones (Fig. F9). The inclination in the uppermost 8 m of Hole 1215A can be interpreted as a record of C1n (Brunhes Chron), C1n.r1 (Jaramillo Subchron), C2n (Olduvai Sub-chron), and the top of C2An (Gauss Chron). This is the only part of lithologic Unit I where a chronology of the sedimentary record can be obtained. As cores were oriented below 20 mbsf in Hole 1215A, the magnetic polarity was determined using the virtual geomagnetic pole latitude, which combines the information from both inclination and declination. From the base of Hole 1215A, we identify Chron C25n fol-lowed by Chron C24r, which contains the P/E boundary. At 35.5 mbsf a normal chron is tentatively interpreted as C24n. The normal chron be-tween 29 and 25 mbsf is then interpreted as C23n. Alternatively, the in-terval between 35.5 and 25 mbsf could span through Chron C24n
be-Corrected declination (°) Uncorrected declination (°)
Cores 199-1215A-4H, 5H, 6H, 9H Cores 199-1215B-3H, 5H
Corrected declination (°)
.10 .08 .06 .04 .02 0
0 100 200 300
Uncorrected declination (°)
0 100 200 300
N = 341 N = 675
.10 .08 .06 .04 .02 0
N = 341 N = 675
.10 .08 .06 .04 .02 0 .10 .08 .06 .04 .02 0 .12
0 100 200 300 0 100 200 300
F
raction
F
raction
F7. Comparison of uncorrected
and corrected declinations, p. 28.
J/Jmax
Jmax = 3.50 × 10⁻³ A/m
0
AF demagnetization level (mT)
100 N, Up
E, E
Sample 199-1215A-9H-5, 49 cm
F8. AF demagnetization of a
dis-crete sample, p. 29.
C24n
C25n C23n
-80 -40 0 40 80
VGP latitude (°)
Depth (mbsf) 20 30 40 50 60 70 P olar ity Chron C1n C1r.2r C1r.1r C2n C2r C2An
-80 -40 0 40 80
Inclination (°)
0 5 10 15 20 25 P olar ity Chron C1r.1n
cause it comprises two short intervals of reversed magnetization (Cande and Kent, 1995).
Hole 1215B has a more scattered record than Hole 1215A because of the presence of disturbed sediment, which hampers the unambiguous correlation with the geomagnetic polarity timescale (GPTS). At the base of Hole 1215B ~53 mbsf, we identify a positive chron that is also ob-served in Hole 1215A. Because there appears to be no correlation of this chron to the GPTS, it might represent one of several cryptochrons in Chron C24r (Cande and Kent, 1995). We interpret the reversed polarity interval between 49 and 39 mbsf as Chron C24r (also in good agree-ment with Hole 1215A). Core 199-1215B-4H is completely disturbed (see “Unit II,” p. 5, in “Lithostratigraphy”) and hence not usable for pa-leomagnetic analysis. Five geomagnetic field reversals were found be-tween 19 and 31 mbsf and are tentatively interpreted as Chrons C22n, C22r, C23n, C23r, and part of C24n. Similarly to Hole 1215A, we iden-tify C1n (Brunhes Chron), C2n (Olduvai Subchron), and C2An (Gauss Chron) based only on the inclination record. From 8 mbsf to the top of lithologic Unit II (nannofossil ooze), the record cannot be interpreted in terms of polarity chrons.
ChRM directions for the AF-demagnetized discrete samples show a mean inclination of 21.8° and –45° for normal and reversed directions, respectively. The corresponding paleolatitudes are 11.3° and 26.5°, re-spectively. The reliability of these results, however, is suspect owing to the large scatter of paleomagnetic directions. ChRM inclinations calcu-lated from the continuous measurements on oriented cores produce a mean inclination of 25.6°, which is similar to the mean inclination computed from discrete samples with a normal magnetization (21.8°). These preliminary results need to be followed up by shore-based thermal demagnetization to fully isolate the primary magnetization di-rection. However, our initial results suggest a mean paleolatitude of 12.3°N, very close to the value implied by the 57-Ma paleopole for the Pacific plate (~15°N; Petronotis et al., 1994).
COMPOSITE DEPTHS
Multisensor track (MST) and color reflectance data collected from Holes 1215A and 1215B were used to determine depth offsets in the composite section. Magnetic susceptibility (MS), GRA bulk density, P -wave velocity, and color reflectance measurements were the primary pa-rameters used for core-to-core correlation at Site 1215. MS, P-wave velocity, and color reflectance data were collected at 2-cm intervals and GRA bulk density at 4-cm intervals on all APC cores recovered from Holes 1215A and 1215B (see “Physical Properties,” p. 18, and “Litho-stratigraphy,” p. 4, for details about MST and color reflectance data). The data used to construct the composite section and determine core overlaps are presented on a composite depth scale in Figure F10. The depth offsets that comprise the composite section for Holes 1215A and 1215B are given in Table T5.
The composite data from Site 1215 provide a continuous sedimen-tary section to ~50 meters composite depth (mcd) (interval 199-1215A-6H-6, 76 cm; 46.96 mbsf; 50.80 mcd). The composite depth scale is ~8% longer than the true sedimentary section, as indicated by the drill string mbsf measurement, and reflects the reduced environmental pressure following core recovery, leading to an expanded sedimentary sequence relative to its original length (Moran, 1997). The expansion experienced
1.2 1.6 2.0 0 10 20 30 40 50 60 70 80
GRA bulk density (g/cm3)
Depth (mcd)
0 100 200
Magnetic susceptibility (10-6 SI)
20 4060 80
Color reflectance (L*)
1500 1600
P-wave velocity (m/s)
F10. GRA bulk density, MS, color
reflectance, and P-wave velocity
data plotted vs. composite depth, p. 31.
at Site 1215 is slightly lower than the typical values of 10%–15% found on other ODP legs (Moran, 1997). Hole 1215B has many intervals with flow-in and drilling disturbance that in most cases are associated with intervals of chert. Therefore, the composite sedimentary sequence was established from MST and color reflectance data, after we culled inter-vals that showed evidence of disruption. Disturbed interinter-vals removed before construction of the composite section are listed in Table T6.
The lithologic units (see “Lithostratigraphy,” p. 4) are clearly re-flected in the MST data and color reflectance data (Fig. F10). The car-bonate-poor lithologic Unit I (approximately the top 26 m) is most eas-ily correlated between the two holes by matching MS and P-wave velocity data. GRA density and color reflectance (L*) data reflect a de-creasing illite:smectite ratio and increases in ferromanganese oxides downcore in the upper part of lithologic Unit I (see “Physical Proper-ties,” p. 18). The composite section aligns several prominent ash layers that are present in both holes. MS values are lower in the carbonate-rich lithologic Unit II, and in this interval GRA bulk density and color re-flectance data vary according to cyclical changes between light yellow to orange layers and thinner, more clay-rich darker layers. The interval most readily correlated between holes is represented by material from Cores 199-1215A-6H and 199-1215B-5H (~43–54 mcd). The close match of cycles in this interval is illustrated in Figure F11.
The interval between ~30 and 50 mcd shows a clear succession of cy-cles on a decimeter scale that appears modulated in amplitude as well as thickness. This amplitude modulation, when combined with biostrati-graphic time control (see “Biostratigraphy,” p. 6), is consistent with a climatic forcing related to precession (~19- to 23-k.y. period). Postcruise work will establish the possibility of extracting an orbitally related sig-nal from the data.
Stretching and compression of sedimentary features in aligned cores indicates distortion of the cored sequence. Because much of the distor-tion happens in individual cores on depth scales of <9 m, it is not possi-ble to align every feature in the MST and color reflectance records accu-rately by simply adding a constant to the mbsf core depth. Core scale changes will require postcruise processing to align smaller sedimentary features. Only after allowing variable adjustments of peaks in each core can we make an accurate estimate of core gaps.
Following construction of the composite depth section for Site 1215, a single spliced record was assembled for the aligned cores over the up-per 50 mcd, primarily by using cores from Hole 1215A as the “back-bone” and patching across core gaps with cores from Hole 1215B (Fig.
F12; Table T7). Intervals having significant disturbance or distortion were avoided when possible. The Site 1215 splice can be used as a sam-pling guide to recover a single sedimentary sequence between 0 and 50 mcd, although it is advisable to overlap a few decimeters from different holes when sampling in order to accommodate anticipated ongoing de-velopment of the depth scale.
SEDIMENTATION AND ACCUMULATION RATES
Average linear sedimentation rates (LSRs) at Site 1215 are based pri-marily on datums defined in Hole 1215A (Tables T8,T9). They are cal-culated using mcd (see “Composite Depths,” p. 12) (Table T5) for each datum as defined in Table T8. LSR values are combined with the dry bulk density (DBD) data averaged over the intervals reported (see
T6. Core disturbance table, p. 48.
Core length (m)
Core A-6H Site 1215 Core B-5H 0 1 2 3 4 5 6 7 8 9 10
F11. Line-scan composite digital
images, p. 32.
1.2 1.6 2.0 0 10 20 30 40 50 60 70 80
GRA bulk density (g/cm3)
Depth (mcd)
0 100 200
Magnetic susceptibility (10-6 SI)
20 406080
Color reflectance (L*)
1450 1500 1550
P-wave velocity (m/s)
F12. Spliced data sets for GRA bulk
density, MS, color reflectance, and
P-wave velocity plotted vs.
com-posite depth, p. 33.
T7. Splice tie point table, p. 49.
T8. Paleomagnetic datums, p. 50.
T9. Nannofossil and foraminifer
“Physical Properties,” p. 18) (Table T14) to determine the mass accu-mulation rates (MARs) of the sediments (Table T10).
LSR values are plotted in Figure F13, with three categories of control points: paleomagnetic reversal boundaries, calcareous nannofossil bio-events, and the Paleocene–Eocene BEE (see “Benthic Foraminifers,”
p. 9, in “Biostratigraphy”). Planktonic foraminifers, strongly affected by calcite dissolution, were not used for age control but clearly show the late Paleocene–early Eocene age progression in the recovered carbonate-bearing sediments (see “Planktonic Foraminifers,” p. 8, in “Biostratig-raphy”). Reversal boundaries are generally considered as a reference framework for sedimentation rate plots because all fossil events have been calibrated to a single polarity timescale (Cande and Kent, 1995). Consequently, we use the convention of utilizing reversal boundaries as anchor points for the sedimentation-rate history while realizing that there is both a depth and age uncertainty of these data points. The scat-ter of biostratigraphic indicators in the paleomagnetic reference frame-work at least partly reflects how well they have been calibrated to the geomagnetic polarity timescale, but other factors inherent in the geo-logic record may also play a part. For Site 1215, we have given the BEE a status of an anchor point because it has been assigned a precise age esti-mate derived from cyclostratigraphy (Norris and Röhl, 1999).
In the upper portion of lithologic Unit I (the lighter brown part of the unit), sedimentation rates are thought to be somewhat higher than in the deeper, dark-brown interval. However, there is no microfossil age control to constrain the magnetic stratigraphy. At the highest rate, these might be slightly >3 m/m.y. Comparison with similar North Pa-cific “red-clay” sections, which have been dated with 87Sr/86Sr
strati-graphy on fish teeth, indicates this is likely an upper estimate of the sedimentation rate. It seems more likely that the overall LSR of Unit I is <1 m/m.y. and probably close to 0.6 m/m.y. (J.D. Gleason et al., unpubl. data; Kyte et al., 1993; Janecek and Rea, 1983).
In lithologic Unit II, the average sedimentation rate is ~8.5 m/m.y. However, using only the paleomagnetic datums (Tables T8, T9; Fig.
F13), the section can be divided into two discrete intervals: an upper in-terval (~30–36 mcd) with a rate of ~4 m/m.y. and a lower inin-terval (36– 70 mcd) with at rate of ~12 m/m.y. An exceptionally condensed se-quence (1 m/m.y.) or, more likely, a hiatus separates these two intervals between the top of Subchron C24n.1n at 52.347 Ma and the base (first evolutionary appearance) of Sphenolithus radians at 53.1 Ma. This nan-nofossil event has been calibrated and is found in Subchron C24n.3n at DSDP Sites 528 (Walvis Ridge) and 577 (Shatsky Rise). Considering this synchrony between the two ocean basins (South Atlantic and North Pa-cific), it becomes difficult to envisage why S. radians should appear ~0.75 m.y. later at North Pacific Site 1215, which would be required in order to invoke continuous sedimentation between the top of Sub-chron C24n.1n and the base of SubSub-chron C24n.3n here.
The interval below the brief hiatus can be subdivided into three seg-ments using the biostratigraphic datums: an upper segment (36–51 mcd) with a rate of 18 m/m.y., a middle segment (51–58 mcd) with a rate of 7 m/m.y., and a lower segment (53–70 mcd) with a rate of 12 m/ m.y. If we rely only on the magnetostratigraphy and the BEE, there is a uniform LSR of 12 m/m.y. throughout this interval.
Lithologic Unit III, the “hydrothermal” unit, has a lower LSR of ~3 m/m.y. This rate is based on the dates of Chron 25n as well as the first occurrence of D. multiradians (Tables T8,T9). However, the position of the base of Chron C25n is near the base of Core 199-1215A-9H and
T10. LSRs and MARs for the major
lithologic units, p. 52.
20
30
40
50
60
70 80
50 51 52 53 54 55 56 57
Depth (mcd)
Age (Ma)
18 m/m.y.
7 m/m.y. 12 m/m.y.
3 m/m.y. 4 m/m.y.
Nannofossils Benthic foraminifers Paleomagnetic reversal
200 mg/cm2/k.y.
750 mg/cm2/k.y.
1300 mg/cm2/k.y.
150 mg/cm2/k.y.
F13. Plot of biostratigraphic and
may be an unreliable datum. The primary constraint on this rate is the top of Chron 25n and the D. multiradians datum.
By combining LSR values with DBD data, we determine the MAR of the total sediment (Table T10) and, when appropriate data are avail-able, the MAR of each sedimentary component. Sediment with an LSR of 1.0 cm/k.y. and a DBD of 1.0 g/cm3 will have a MAR value of 1.0 g/
cm2/k.y. The observed values are rarely this high, so we report the data
in milligrams per square centimeter per thousand years (mg/cm2/k.y.).
The lighter upper portion of lithologic Unit I has a greater average bulk density than the lower portion and accumulates at ~40 mg/cm2/
k.y. vs. 20 mg/cm2/k.y. for the dark-brown pelagic clays. The upper
por-tion of the clayey nannofossil oozes (lithostratigraphic Unit II) has a MAR of ~200 mg/cm2/k.y. above the hiatus. Below the hiatus,
lower-most Eocene oozes younger than the BEE accumulate at ~750 mg/cm2/
k.y., whereas those below have a much higher DBD value and MARs of 1300 mg/cm2/k.y. The hydrothermal ooze unit accumulates at ~150
mg/cm2/k.y., which is one of the few well-constrained estimates of
MARs for this particular facies.
GEOCHEMISTRY
Interstitial Water Geochemistry
We collected interstitial waters from six samples at Site 1215: five from Hole 1215A at depths ranging from 5.65 to 64.15 mbsf and one from Hole 1215B at 43.95 mbsf (Table T11; Fig. F14). The samples from both holes were taken to constitute a single depth profile. However, major ion concentrations of the interstitial water taken from the Hole 1215B indicate contamination with seawater, most likely caused by the cherty (nodular) nature of the sediment rendering the core more per-meable to seawater. Chemical gradients in the interstitial waters at this site primarily reflect the limited amount of organic matter diagenesis, the generally nonbiogenic character of the sediments, and possibly a small diffusive influence of reactions in the underlying basalt.
Chlorinity, as measured by titration, increases with depth from val-ues of ~556 mM at 5.65 mbsf to valval-ues of ~565 mM at 64.15 mbsf (Fig.
F14). The values at the top of the section are slightly lower than the standard seawater value of 559 mM, consistent with the lower than av-erage chlorinity of modern Pacific bottom waters (~542 mM). Sodium concentrations determined by charge balance were on average 2.5% higher than those measured by ion chromatograph. Sodium concentra-tions as determined by charge balance generally increase downcore from values of ~495 mM at 5.65 mbsf to values of ~500 mM at 64.15 mbsf. Salinity, as measured by a handheld refractometer, was lowest in the shallowest sample from 5.65 mbsf from Hole 1215A (34.5); all other interstitial waters were measured as 35.0.
Alkalinity increases with depth in the top 25 m of the section to val-ues of ~2.8 mM and, thereafter, decreased with depth, reaching ~2.4 mM at 64.15 mbsf. The pH generally increases with depth, from values of ~7.1 at 5.65 mbsf to values of ~7.5 at 64.15 mbsf. Dissolved silica concentrations increase with depth, from values of ~260 µM at 5.65 mbsf to values of ~420 µM in Hole 1215A. Silica concentration values then decrease to ~350 µM at 64.15 mbsf in Hole 1215A. Silica concen-trations of all interstitial water samples were below saturation levels, which is consistent with the absence of radiolarians from all cored
sedi-T11. Interstitial water data, p. 53.
5500 560 570 20 40 60 80
Cl (mM)
Depth (mbsf)
2.0 2.5 3.0 Alkalinity (mM)
27 28 29 SO4 (mM)
0 5 10 NH4 (µM)
200 400 600 H4SiO4 (µM)
0 30 60 Ca and Mg (mM)
12 12.5 13 0 20 40 60 80
K (mM)
Depth (mbsf)
0 0.2 0.4 Ba (µM)
0 1 2 Mn (µM)
600 650 700 B (µM)
20 40 60 Li (µM)
85 90 95 Sr (µM)
F14. Interstitial water geochemical
ments. Interstitial water silica contents ranged from ~325 to 425 µM in the interval where chert nodules were present (between ~23 mbsf to basement).
Sulfate concentrations are >27 mM throughout the section, indicat-ing that the amount of labile organic matter available for oxidation is extremely low. Ammonium is a by-product of organic matter degrada-tion and is present in extremely low levels, which is consistent with the high sulfate values. Phosphate levels are equal to or less than five times the detection limit (0.2 µM) in all samples (Table T14; not shown in Fig.
F14).
Dissolved manganese concentrations range from 0.12 to 1.63 µM throughout the interstitial water profile at Site 1215. Strontium concen-trations are similar to seawater (i.e., 85.4–89.3 µM) throughout the pore water profile. The small magnitude of the middepth strontium maxi-mum (to ~90 µM over the upper 25 m of the section) likely reflects the low carbonate content of the upper sediments.
Lithium pore water values increase steadily from values of ~32 µM at 5.65 mbsf to values of ~57 µM at 64.15 mbsf. These are the highest lith-ium pore water values encountered in Leg 199 profiles.
Calcium concentrations increase slightly with depth (from 10.0 to 10.8 mM), whereas magnesium concentrations generally range from 49.9 to 52.9 mM. These profiles may reflect a small influence of alter-ation of basement and subsequent diffusion, with magnesium replacing calcium in altered basement rocks. The low levels of magnesium in the shallowest sample, from 5.65 mbsf in Hole 1215A, may reflect authi-genic mineral precipitation. Potassium concentrations show a similar profile to that of magnesium, presumably reflecting the uptake of po-tassium during basement alteration. Dissolved barium concentrations are low (from 0.19 to 0.49 µM) and show no systematic variation with depth. Levels of dissolved boron decrease slightly, from values of ~677 µM at 5.65 mbsf to values of ~610 µM at 24.65 mbsf. Below 24.65 mbsf, dissolved boron values increase to 644 µM at 64.15 mbsf.
In summary, the pore water profiles from this site primarily reflect the limited amount of organic matter diagenesis, the dissolution of bio-genic silica, and, possibly, a small influence of alteration of underlying basalt and subsequent diffusion. High levels of sulfate and concomitant low levels of ammonium suggest a relatively oxic environment, consis-tent with the presence of metalliferous oxides. Silica levels in the inter-stitial waters are higher than seawater values, indicating that biogenic silica was possibly a more important component of the original sedi-mentary deposits than is obvious by visual inspection of the cores. Ccium, magnesium, and potassium profiles may be influenced by the al-teration of basalt and subsequent diffusion to the sediment-water interface.
Solid-Phase Geochemistry
We collected bulk sediment samples adjacent to the interval sampled for physical properties, resulting in a sampling resolution of approxi-mately one per section from 0.51 to 67.46 mbsf in Hole 1215A (Table
T12; Fig. F15), except for the critical interval (P/E boundary). We mea-sured silicon, titanium, iron, manganese, calcium, magnesium, phos-phorus, strontium, and barium concentrations in the sediment by in-ductively coupled plasma–atomic emission spectrophotometer (ICP-AES). Bulk sediment geochemistry primarily reflects the changing
li-T12. Bulk sediment data, p. 54.
0 15 30 0 20 40 60
Si (wt%)
Depth (mbsf)
0 4 8 Al (wt%)
0 20 40 0 20 40 60
Ca (wt%)
Depth (mbsf)
0 2 4 Mg (wt%)
0 0.81.6 P (wt%)
0 1000 Sr (ppm)
0 10002000 Ba (ppm) 0 0.3 0.6
Ti (wt%) 0 15 30
Fe (wt%) 0 4 8
Mn (wt%)
F15. Bulk sediment geochemical
thology of the sediments with depth from red clay to nannofossil ooze and clay to metalliferous oxide ooze.
Silicon decreases from ~25 wt% at 0.51 mbsf to ~4 wt% at the transi-tion from red clay to nannofossil ooze and clay (~28.54 mbsf). Subse-quently, silicon remains at or below ~5 wt%. Aluminum and titanium follow similar trends to silicon. Between 5 and 30 mbsf, the Al/Ti ratio is high relative to the Post-Archean Average Shale value of 16.7 (Taylor and McLennan, 1985) (see Fig. F19, p. 70, in the “Leg 199 Summary” chapter). Aluminum decreases from ~9 wt% at 0.51 mbsf to <1 wt% at 28.54 mbsf and remains below 1 wt% until the deepest sample (67.46 mbsf), which has a value of 1.81 wt%. Similarly, titanium decreases from ~0.5 wt% to <0.05 wt% at 28.54 mbsf and generally remains be-low 0.05 wt% until 67.46 mbsf.
Iron and manganese show similar patterns to each other, with a grad-ual overall increase downcore to their maxima at 22.44 mbsf of ~21 and ~5 wt%, respectively, in lithologic Unit I. Iron decreases to <5 wt% and manganese to <1 wt% between 28.54 and 66.44 mbsf, corresponding to the transition to lithologic Unit II. Maximum concentrations of ~26 and ~9 wt% for iron and manganese, respectively, are present at 67.46 mbsf in lithologic Unit III.
Calcium is <2 wt% in the red clay (from 0 to ~23 mbsf) but increases to 25–35 wt% in the nannofossil ooze and clay between 28.54 and 66.44 mbsf. Calcium decreases to <5 wt% in the metalliferous oxide ooze near basement. Strontium follows a similar pattern to calcium, with highest values of ~1000–~1200 ppm between 28.54 and 66.44 mbsf. Magnesium varies between 1 and 3 wt% in the clay (0.51–26.94 mbsf) and decreases to between 0.5 and 1.5 wt% in the nannofossil ooze and clay (~30–65 mbsf).
Phosphorus and barium follow similar trends except for the interval from 0 to 10 mbsf, where phosphorus increases from 0.04 to 0.47 wt% and barium decreases from 969.40 to 378.11 ppm with depth. Phospho-rus and barium peak values are 1.6 wt% and 2000 ppm, respectively, in the hydrothermal sample at 67.46 mbsf.
Ash layers at 7.39 and 8.28 mbsf contain slightly elevated concentra-tions of silicon and aluminum and slightly lowered concentraconcentra-tions of most other elements. These layers are also characterized by elevated Al/ Ti ratios (see Fig. F19, p. 70, in the “Leg 199 Summary” chapter). Flow-in contamFlow-ination at 28.24 mbsf is characterized by a low Flow-in calcium and strontium concentration and spikes in all other elements mea-sured. The metalliferous oxide ooze at 67.46 mbsf contains elevated lev-els of all elements measured except calcium and strontium. Iron, man-ganese, phosphorus, and barium reach their highest concentrations at this level.
CaCO3 (in weight percent) and organic carbon (Corg in weight
per-cent) were determined for approximately two samples per core for Hole 1215A. CaCO3 is <1 wt% from 0.51 to 23.93 mbsf and subsequently
in-creases to ~85 wt% from 26.94 to 66.44 mbsf (Table T13). CaCO3 values
calculated from Ca contents (in weight percent) yielded similar trends to CaCO3 measured via coulometer, although absolute values by
calcu-lation are lower when CaCO3 is <1 wt% (Table T13) (see also “Geochemistry,” p. 20, in the “Explanatory Notes” chapter). Corg is
uniformly low (0–0.19 wt%) for all samples measured (Table T13). In summary, the bulk geochemistry of the sediments characterizes the lithology, with high silicon, aluminum, titanium, iron, manganese, and magnesium in the red-clay unit; high calcium and strontium in the
T13. CaCO3 and organic carbon
nannofossil ooze and clay unit; and high iron, manganese, magnesium, phosphorus, and barium in the hydrothermal unit.
PHYSICAL PROPERTIES
Physical properties at Site 1215 were measured on whole cores, split cores, and discrete samples. MST measurements (GRA bulk density, MS,
P-wave velocity, and natural gamma ray radiation [NGR]) and thermal conductivity comprised the measurements on whole cores from Holes 1215A and 1215B. Compressional wave velocity measurements on split cores and moisture and density (MAD) analyses on discrete core sam-ples were made at a frequency of one sample per section. LAS analyses were performed on the MAD samples as well as an additional one sam-ple per section (located ~50 cm from the MAD samsam-ple). One in situ temperature measurement was obtained using the Adara tool in Core 199-1215A-4H.
Density and Porosity
Two methods were used to evaluate the bulk density at Site 1215. GRA provided an estimate of bulk density from whole cores. MAD sam-ples gave a second, independent measure of wet bulk density, as well as providing DBD, grain density, water content, and porosity from discrete samples (Table T14). Throughout Hole 1215A, the MAD values closely match the GRA values (Fig. F16). The high degree of correlation of the data sets is shown in cross-plots of dry and wet bulk density vs. interpo-lated GRA density (Fig. F17).
Bulk density values decrease downhole in the upper red-clay unit (lithologic Unit I; 0–25.8 mbsf). Bulk density is 1.48 g/cm3 at the
sea-floor and decreases to a minimum value of 1.13 g/cm3 at the bottom of
the red clay. Bulk density values increase from 25.8 to 67.2 mbsf in lithologic Unit II (nannofossil clay and clayey nannofossil ooze). At the top of the nannofossil ooze, the bulk density is 1.26 g/cm3 and
in-creases to a maximum of 1.75 g/cm3 at 67.2 mbsf. Lithologic Unit III,
67.2 to 69.3 mbsf, is a metalliferous oxide ooze with an average wet bulk density of 1.39 g/cm3.
Grain density (Fig. F16) for lithologic Unit I sediments averages 2.50 g/cm3 and ranges from 1.97 to 2.92 g/cm3. The illite-rich section, above
~10.0 mbsf, shows less scatter than the smectite-rich section (~10.0– 25.8 mbsf). Lithologic Unit II sediments have an average grain density of 2.71 g/cm3, and values range from 2.63 to 2.79 g/cm3. One sample
was analyzed from lithologic Unit III, and it has a grain density of 3.12 g/cm3. This high value reflects the enrichment of manganese and other
metal oxides in these sediments.
Porosity values (Fig. F16) increase with depth in the red clays (litho-logic Unit I). Near the seafloor, porosity is 73.3% and increases to 91.3% at the bottom of the red-clay unit (25.8 mbsf). Porosity values in litho-logic Unit II sediments decrease from 86.1% at the top of the unit (26.9 mbsf) to a value of 58.0% at the bottom (67.2 mbsf). The one sample analyzed from lithologic Unit III has a porosity of 82.4%.
LAS
LAS studies were conducted on cores from Hole 1215A at a frequency of two samples per section (see Vanden Berg and Jarrard, this volume,
T14. Moisture and density
mea-sures, p. 56.
Depth (mbsf) IV III II I Lithologicunit
406080100 11.2 1.4 1.6 1.8 2.02.42.83.2
A Porosity (%)
Wet bulk density (g/cm3)
Grain density (g/cm3)
B C 0 20 40 60 Water content (%)
GRA bulk density (g/cm3)
F16. Moisture and density
mea-surements, p. 37.
1.2 1.4 1.6 1.8
y = -1.428 + 1.451x R = 0.95
Dry bulk density (g/cm
3)
1.2 1.4 1.6 1.8
y = 0.077 + 0.943x R = 0.96
Wet bulk density (g/cm
3)
Interpolated GRA density (g/cm3)
0.3 0.6 0.9 1.2 1.2 1.4 1.6 1.8 A B
F17. Dry and wet bulk density vs.
for a discussion of the LAS technique). Semiquantitative mineral con-centrations were calculated from the collected spectra, assuming a four-component system: calcite, opal (not present at this site), smectite, and illite. LAS-derived mineralogical data (Fig. F18; Table T15) show a dis-tinct transition at 25.8 mbsf from the red clays of lithologic Unit I (illite and smectite rich) to the calcite-rich, clayey nannofossil oozes of litho-logic Unit II. Also, a gradual transition downcore from illite-rich clay to smectite-rich clay is seen between 5 and 10 mbsf. This change marks the Neogene transition from wind-blown eolian dust originating in Asia (illite rich) to wind-blown dust derived mainly from the Americas (smectite rich) (Rea, 1994).
Compressional Wave Velocity
Compressional wave velocity was measured by the P-wave logger (PWL) on whole cores from Holes 1215A and 1215B and by the inser-tion and contact probe systems on split cores from Hole 1215A (Table
T16). Measurements with the insertion probe system were restricted to soft sediments in the uppermost 50 m of Hole 1215A. The downhole trends recorded by the PWL compare well with the trends of the dis-crete measurements. However, the insertion probe velocities trend 10– 20 m/s lower than the PWL values, and the contact probe velocities are on the order of 10–40 m/s higher than the PWL measurements (Fig.
F19). Differences between the whole-core and split-core measurements possibly reflect the presence of water in the space between the core liner and sediment in the whole cores and the slight compaction of the sediment in the contact probe technique. A consistent relationship be-tween increasing burial depth and velocity is not present at Site 1215, suggesting that differences in sediment composition in addition to de-watering are affecting the velocity. In Hole 1215A, with the exception of the uppermost 8 m, the PWL velocity follows the same downhole trends as the GRA bulk density (Fig. F16). The PWL velocity displays a broad peak between 5 and 15 mbsf, with values reaching ~1550 m/s. Be-tween 15 and 60 mbsf, the velocity values average ~1475 m/s before in-creasing to 1550 m/s below 60 mbsf.
Velocity anisotropy was calculated from longitudinal (z-direction) and transverse (x-direction) measurements provided by the insertion probe system (Table T16) to evaluate burial-induced changes in sedi-ment fabric. Sedisedi-ments in Hole 1215A are nearly isotropic, with most values in the range of –0.6% to 0.4%. There is a general decrease in anisotropy from the seafloor to 12.96 mbsf (Table F12). Below this depth, there is greater variability with no consistent trend.
Thermal Conductivity and Temperature Measurements
Thermal conductivity was measured on the third section of cores from Hole 1215A and from Core 199-1215B-1H (Table T17). The ther-mal conductivity is inversely correlated with porosity (Fig. F20). This decrease in conductivity with increasing porosity occurs as increased in-terstitial spacing attenuates the applied current.
One in situ temperature measurement of 3.19°C at 29.70 mbsf was obtained with the Adara tool in Hole 1215A. An attempt to obtain a second temperature in Hole 1215B failed when the Adara tool was dam-aged by striking chert.
Depth (mbsf)
II - Clayey nannofossil ooze
Lithologicunit
III - Metalliferous oxide ooze,late Paleocene
IV
Age
Holocene to early Eocene
early Eocene to late Paleocene
0 40 80 0 40 80 0 40 80
Calcite (model wt%) Smectite (model wt%) Illite (model wt%)
0 10 20 30 40 60 70 80 50
I - Clay and zeolitic clay
F18. LAS mineralogy
determina-tions, p. 39.
T15. LAS mineralogy
determina-tions, p. 57.
T16. Split-core velocity
measure-ments, p. 58.
0 10 20 30 40 50 60 70
1450 1500 1550 1600
Depth (mbsf) Velocity (m/s) I II III IV Lithologicunit
F19. Compressional wave velocity
and transverse velocity measure-ments, p. 40.
T17. Thermal conductivity, p. 59.
0.6 0.8 1.0 1.2
60 70 80 90
Ther
mal conductivity (W/[m·K])
Porosity (%)
F20. Thermal conductivity as a
MS and NGR
MS values average 49.8 × 10⁻⁶ SI, but many spikes to higher values are
present (Fig. F21). Lithologic Unit I records the highest MS values, dis-playing a broad peak with a maximum of ~155 × 10–6 SI between 10 and
12 mbsf. Values for the carbonate-rich lithologic Unit II are much lower (15 to 50 × 10–6 SI), with spikes to values of ~125 × 10–6, most likely the
consequence of chert nodules present in the core. MS values increase slightly from 75 to 100 × 10–6 SI in lithologic Unit III as a result of the
increase in clay and metalliferous material.
NGR values show trends similar to susceptibility trends (Fig. F21). The highest counts (~20–30 counts per second [cps]) occur in the upper 10 m of Hole 1215A in the illite-rich section of lithologic Unit I. The NGR counts decrease by almost half (~5–10 cps) as the clays become more smectite rich with increasing depth in the hole. NGR counts in lithologic Unit II are low (~1–5 cps) but increase in lithologic Unit III (~10 cps) as a result of the higher metal content in this unit.
Illite rich
Smectite rich
Depth (mbsf)
Natural gamma (cps)
Magnetic susceptibility (10-6 SI)
0 40 80 120 0 50100150200 0
10
20
30
40
50
60
70
Lithologicunit
I
II
III
A B
REFERENCES
Cande, S.C., and Kent, D.V., 1995. Revised calibration of the geomagnetic polarity timescale for the Late Cretaceous and Cenozoic. J. Geophys. Res., 100:6093–6095. Cande, S.C., LaBrecque, J.L., Larson, R.L., Pitmann, W.C., III, Golovchenko, X., and
Haxby, W.F., 1989. Magnetic lineations of the world’s ocean basins. AAPG Map Ser., 131 (scale 1:27,400,000).
Dickens, G.R., O’Neil, J.R., Rea, D.K., and Owen, R.M., 1995. Dissociation of oceanic methane hydrate as a cause of the carbon isotope excursion at the end of the Pale-ocene. Paleoceanography, 10:965–971.
Engebretson, D.C., Cox, A., and Gordon, R.G., 1985. Relative Motions between Oceanic and Continental Plates in the Pacific Basin. Spec. Pap.—Geol. Soc. Am., 206.
Gripp, A.E., and Gordon, R.G., 1990. Current plate velocities relative to the hotspots incorporating the NUVEL-1 global plate motion model. Geophys. Res. Lett.,
17:1109–1112.
Janecek, T.R., and Rea, D.K., 1983. Eolian deposition in the northeast Pacific Ocean: Cenozoic history of atmospheric circulation. Geol. Soc. Am. Bull., 94:730–738. Kyte, F.T., Leinen, M., Heath, G.R., and Zhou, L., 1993. Cenozoic sedimentation
his-tory of the central North Pacific: inferences from the elemental geochemistry of Core LL44-GPC3. Geochim. Cosmochim. Acta, 57:1719–1740.
Moran, K., 1997. Elastic property corrections applied to Leg 154 sediment, Ceara Rise.
In Shackleton, N.J., Curry, W.B., Richter, C., and Bralower, T.J. (Eds.), Proc. ODP, Sci. Results, 154: College Station, TX (Ocean Drilling Program), 151–155.
Norris, R.D., and Röhl, U., 1999. Carbon cycling and chronology of climate warming during the Paleocene/Eocene transition. Nature, 401:775–778.
Petronotis, K.E., Gordon, R.G., and Acton, G.D., 1994. A 57 Ma Pacific plate paleo-magnetic pole determined from a skewness analysis of crossings of marine mag-netic anomaly 25r. Geophys. J. Int., 118:529–554.
Rea, D.K., 1994. The paleoclimatic record provided by eolian deposition in the deep sea: the geologic history of wind. Rev. Geophys., 32:159–195.
Taylor, S.R., and McLennan, S.M., 1985. The Continental Crust: Its Composition and Evolution: Oxford (Blackwell Scientific).
Tjalsma, R.C., and Lohmann, G.P., 1983. Paleocene–Eocene bathyal and abyssal benthic foraminifers from the Atlantic Ocean. Micropal. Spec. Pub. 4.
Figure F1. Location of Site 1215 in the Leg 199 transect. In the lower panel, gray shading = seafloor depths >5000 mbsl, red shading = approximate position of magnetic Anomaly C25, the nominal target crust of the 56-Ma transect.
160°W 150° 140° 130°
0° 10° 20° 30° N
0 500 1000
Site 1215
Site 1216
Site 1217
Site 1218 Site 1219
Site 1220 Site 1221 Site 1222
Site 40
Site 42 Site 43
Site 69 Site 70
Site 71
Site 72
Site 160 Site 161
Site 162
Site 163
Site 573 Site 574
Site 575 Honolulu
Molokai F.Z.
Clipperton F .Z.
Clarion F.Z.
Site 1216
Site 1217
Site 1218 Site 1222
Site 1221
Site 1220 Site 1215
Molokai Fracture Zone
Clarion Fracture Zone
Mahi Mahi Fracture Zone
Site 1219
Clipperton Fracture Zone
574
573 575 1