JOURNAL OF FOREST SCIENCE, 64, 2018 (1): 17–24
doi: 10.17221/111/2017-JFS
Adaptive k-tree sample plot for the estimation
of stem density: An empirical approach
Hormoz SOHRABI*
Department of Forestry, Faculty of Natural Resources, Tarbiat Modares University, Tehran, Iran *Corresponding author: [email protected]
Abstract
Sohrabi H. (2018): Adaptive k-tree sample plot for the estimation of stem density: An empirical approach.
J. For. Sci., 64: 17–24.
Available budgets for the inventory of non-commercial woodlands are small. Therefore, there has been increased interest in using distance methods, such as k-tree sampling, which are faster than fixed plot sampling. In low-density woodlands, large search areas for k nearest trees contradict any practical advantage over sampling with fixed area plots. Here, a modification of a k-tree sample plot with an empirical approach to estimating the number of trees per unit area in low-density woodlands is presented. The standard and modified k-tree sample plots have been tested in one actual and three simulated forests with different spatial patterns. The modified method was superior to other combinations of methods in terms of relative bias and relative efficiency. Considering statistical and practical aspects of sampling for tree density, the modified method is more promising than is the standard one.
Keywords: plotless sampling; distance sampling; bias; efficiency; forest sampling
k-Tree sampling is one of the distance sampling
methods based on point-to-tree distance measure-ments (Kleinn, Vilčko 2006b). It is also known as the fixed count (Sheil et al. 2003; Magnussen 2015) or plotless method (Engeman et al. 1994). This sam-pling method is a practical field method for forest inventories and ecological surveys (Kleinn, Vilčko 2006a). Contrary to fixed area plots, the number of trees included at each sampling location is fixed which can considerably reduce the time for field assessments in certain forest structures (Sheil et al. 2003). While bias still remains a problem with this method, effi-ciency of the method entices many researchers and practitioners into accepting the inherent bias (Kle-inn, Vilčko 2006a). The difficulties in
determin-ing the inclusion probabilities of the k sampled trees
(Kleinn, Vilčko 2006b) preclude the use of the (de-sign-unbiased) Horvitz-Thompson estimator.
A large number of density estimators have been proposed to mitigate the bias problem (Morisita 1957; Diggle 1977; Byth 1982; Patil et al. 1982; Engeman et al. 1994). Some of these methods require
measuring distances to a large number of additional trees (Kleinn, Vilčko 2006b), and others need in-tensive stochastic simulations of spatial patterns that emulate the distribution of observed point-to-trees and tree-to-tree distances (Nothdurft et al. 2010). Also, many of these estimators are difficult to com-prehend and implement without advanced statistical training (Haxtema et al. 2012). Others again are im-practical for field work (Magnussen et al. 2011).
For the k-tree sampling method, a sample point
is selected and the distance from the point to the k
nearest individual is measured. Using this method,
k is the fixed number of trees in each sampling plot
and rk is the distance from the sample point to the
kth individual. With Prodan’s k-tree estimator the
density – N (number of trees per hectare) is
com-puted as Eq. 1 (Prodan 1968):
2
10,000 ( 0.5) πk
N k
r
(1)
However, considering half a tree (k – 0.5) in enu-meration, empirically it has been proposed to less-en the overestimate.
Eberhardt (1967) proposed another empirical
estimator that counts k – 1 individuals. The
plot-based per-hectare estimator for the number of trees per hectare is as follows (Eq. 2):
2
10,000 ( 1) πk
N k
r
(2)
Kleinn and Vilčko (2006a) tried to reduce the estimation bias by adjusting the effective number of trees enclosed in a circle with a radius equal to
the distance to the k (or k + 1) nearest tree or the
radius of this circle. The plot-based per-hectare es-timator for the number of trees per hectare is as follows (Eq. 3) (Kleinn, Vilčko 2006a):
1 10,000 ( )
πk k
N k
r r
(3)
Despite the lack of a practical and theoretically unbiased estimator, as a rapid sampling for forest measurement, interest in this method persists. In
low-density woodlands, k-tree distance sampling
may result in a greater amount of effort than does plot sampling. In low-density woodlands, some-times one is required to use a large “search area”
to find the expected k trees. Searching a larger area
intensifies practical difficulties in identifying the kth
individual. As the search area becomes larger, the
procedure of searching for the kth tree around the
sample point (Batcheler, Craib 1985) becomes time-consuming. According to Zhang and Cham-bers (2004), censoring to a maximum search dis-tance requires a likelihood approach to the estima-tion in order to handle the censoring correctly, and a large sample size is required for an accurate esti-mate of the proportion of censored samples (Mag-nussen et al. 2011). Such a burden eliminates any practical advantage of this method over sampling with fixed area plots.
The objective of this article is to present a simple
modification of the k-tree distance sampling
meth-od for dealing with the problem of large search areas in low-density woodlands. Also, the perfor-mance of the new approach has been examined in different real and simulated forest stands.
MATERIAL AND METHODS
Data. Our test data for the simulation of the
standard and modified k-tree sampling consists
of four maps with different patterns. One real tree
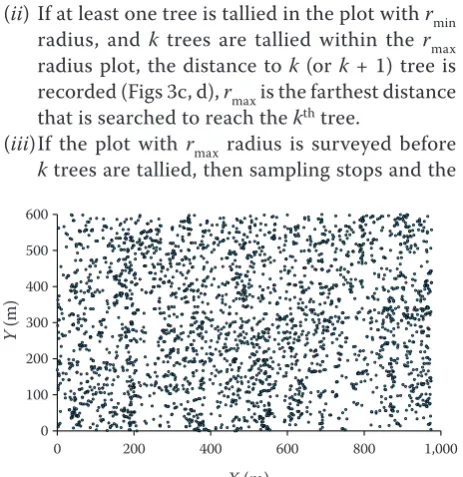
map originated from the Zagros oak woodlands in Central Iran, for which a total of 3,027 trees with a crown width more than 1.5 m in an area of 60.0 ha (1,000 × 600 m) were mapped (Fig. 1). For analys-ing the possibility of generalization of the estima-tion approaches, another three tree maps (with the same overall density) were generated to exhibit Poisson and two (Fig. 2a) variations of clustered tree patterns (Figs 2b, c).
The computer program STG (Version 4.1, 1997) was used to generate these artificial tree maps (Stoyan 2006). For the Poisson forest, tree posi-tions were generated using the Poisson Point Pro-cess, with the intensity set to 50 trees per hectare. For generating the two artificial cluster arrange-ments, Matérn processes were used. For low and high clustered maps, the mean number of points per cluster and the overlapping probability of neighbouring clusters of the Matérn Point Process were set 2.0, 0.5, 8.0 and 0.5, respectively.
A new approach. A new method is a
modifica-tion of the k-tree distance sampling method. The
work will begin by determining a random point for use as the plot centre. For laying out these points as a sampling unit, one can use one of the sampling designs, like simple random or systematic sam-pling. After this, the sampling proceeds as follows (Fig. 3):
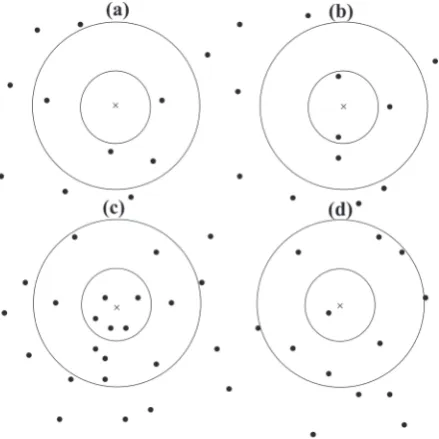
(i) If a circular plot with the radius rmin is surveyed
without encountering any trees, that plot is
tal-lied as empty (Fig. 3a). rmin is the distance that is
considered to search for reaching the first tree;
(ii) If at least one tree is tallied in the plot with rmin
radius, and k trees are tallied within the rmax
radius plot, the distance to k (or k + 1) tree is
recorded (Figs 3c, d), rmax is the farthest distance
that is searched to reach the kth tree.
(iii) If the plot with rmax radius is surveyed before
k trees are tallied, then sampling stops and the
0 100 200 300 400 500 600
0 200 400 600 800 1,000
Y
(m
)
[image:2.595.303.535.473.712.2]X (m)
plot is recorded as containing ki’ trees (Fig. 3b).
ki’ is the number of trees on a circular plot with
r = rmax and always ki’ < k.
Deciding on the maximum and minimum radi-uses of the plot in order to limit the search area requires a preliminary estimate of the density of the target population. For a population with higher tree density, we need a smaller plot size. The two limit-ing radiuses can be calculated uslimit-ing Eqs 4 and 5:
min=10,000
2π k r
D (4)
where:
rmin – minimum radius (m) for the search area, D’ – density for the target population.
max
10,000 =
π k r
D (5)
where:
rmax – maximum radius (m) for the search area.
D’ can be achieved from previous research in the
study area or similar forest stands, or by conduct-ing a pilot study. It is important to give serious
con-siderations to the value of D’.
The number of sampling units that may fall into one of the above situations mentioned in the procedures
for using the modified k-tree sampling depends on
the prior density estimation for the target population. The density of trees in plot for each of the three situations is determined as follows:
(i) For the plot that has been surveyed, up to rmin
without encountering any tree, the estimated density of that sample unit is equal to zero;
(ii) If the k-tree is encountered before rmax is reached,
the plot radius is the distance of the sample point
to the k or the average of the distance to k and
k + 1 tree. Prodan, Eberhardt or Kleinn’s
formu-las can be used for the density estimation;
(iii) If the plot is surveyed to the maximum radius
and less than k number trees are tallied, the
fol-lowing parameters exist: If ki’ trees are tallied, the
density of the sample unit is as follows (Eq. 6):
0 100 200 300 400 500 600
Y
(m
)
0 100 200 300 400 500 600
Y
(m
)
0 100 200 300 400 500 600
0 200 400 600 800 1,000
Y
(m
)
[image:3.595.62.290.53.482.2]X (m)
Fig. 3. Four different situations encountered for the modi-fied adaptive approach. First, the inner circle with the radius rmin is surveyed. If no trees are recorded before reaching rmin, the plot is recorded as an empty plot with N = 0 and r = rmin (a), if there is at least one tree closer than the rmin distance, but less than k trees are recorded in the rmax distance, the plot radius is rmax with ki’ trees (b), if k trees are tallied before reaching rmax, the distance to k or k + 1 is recorded as the plot radius (c, d)
Fig. 2. Simulated tree maps used for sampling simulation. Poisson (a), low clustered (b), high clustered (c) simulated forests with 60 ha area and 3,027 trees (50.5 trees per hectare)
(a)
(b)
[image:3.595.308.528.56.276.2]2 max
π i
i k D
r
(6)
where:
Di – number of trees in 1 m2 for ith sample unit.
Regardless of the portion of sample units that fall into one of these three situations, stand parame-ters, like the average tree density, can be calculated by considering each sample unit as an independent observation and using common estimators.
Determining bias. The statistical performance in terms of bias can be analysed using simulation to determine the difference between the true value and the expected estimated value under a defined sampling strategy. In our research, we did this for the number of stems per hectare (density). While the true value for the number of stems is known for all maps, we used a simulated sampling proce-dure under a simple random sampling design with 10,000 replications to find the approximate true mean. We considered a 10-m buffer to avoid edge effects. The apparent relative bias of the estimate of parameter θ was calculated by Eq. 7:
ˆ
ˆBias 100 ( ( ) ) / E (7)
where:
E – mathematical expectation, θˆ – estimate of the parameter, θ – true value of the parameter.
Because the k-tree sampling method involves
bias, the estimation precision should be compared under the assumption of bias. As such, we used a standardized root mean square error (sRE) to make the results comparable (Kleinn, Vilčko 2006a). The sRE was calculated as follows (Eq. 8):
2 2
ˆ ˆ
var( ) ( )
ˆ
sRE E
(8)
where: var – variance.
The comparison of biases includes Eberhardt’s (1967), Prodan’s (1968), and Kleinn’s (Kleinn, Vilčko 2006a) estimators. The Eberhardt estima-tor leaves out one tree while the Prodan estimaestima-tor leaves out one-half of a tree, and the radius of the virtual circular plot for both of the methods is the
distance to the kth tree. The Kleinn estimator uses
all k trees, but the plot radius of the imagined
cir-cular plot is the geometric mean of the distances to
the kth and kth + 1 tree. We chose these estimators
among all reported empirical estimators because of their simplicity and easy application.
For a comparison of relative efficiency, we mod-ified Wiegert’s (1962) procedure which consid-ers variance and cost of a method. Based on this formula, the best method is the one with the smallest product of relative cost and relative vari-ance. Instead of cost, we used the relative average search area and sRE was the relative variance. All programming and calculations were done with the R software (Version 3.3.2, 2016).
RESULTS
Bias
For the bias analysis, the Prodan, Eberhardt and Kleinn estimators of stem density were compared for the standard (SM) and modified (MM) method
of k-tree sampling for k values from 2 to 12.
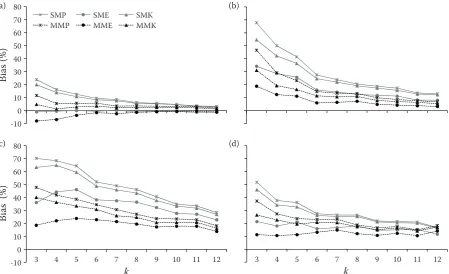
Re-garding the Poisson forest, and k > 5, both methods
using the Eberhardt estimator (SME, MME) and the modified method using the Kleinn estimator (MMK) yielded the smallest bias. For each meth-od, Prodan estimator produced the largest positive bias. As we expected, for all cases, the percent of
bias decreased with increasing k. However, for k
values that were greater than six, the decrease is negligible. In general, the modified method pro-duced a smaller bias than did the standard method (Fig. 4).
Similar to the above results, in both low (cluster 1) and high cluster (cluster 2) simulated forests, the modified method, with all of the estimators, pro-duced the smallest bias. Again, we can see that the
rate of decrease in bias for k values of more than six
is negligible. In each method, the bias percentage of the Prodan estimator was the highest and the bias percentage for Eberhardt is the lowest. The bias for the Kleinn estimator was between the other esti-mators (Fig. 4).
For the actual map, the results were similar to those of the Poisson forest, but with a higher per-cent of bias. We see that MME produced the small-est bias results. Again, the rate of decrease in bias
for k values of more than six is negligible (Fig. 4).
Standardized root square error
We illustrate three important results in Fig. 5. First, as expected, the sRE of the estimates
de-creased with increasing k values. However, this
de-crease for k > 6–8 was negligible. Second, sRE
Fig. 4. Estimated relative bias of the number of stems per hectare with the standard and the modified k-tree distance sampling methods for k = 3, ..., 12 trees using different estimators: Poisson forest (a), cluster 1 forest (b), cluster 2 forest (c), actual forest (d)
k – fixed number of trees in each sampling plot, SMP, SME, SMK – standard method with Prodan, Eberhardt and Kleinn estimator, MMP, MME, MMK – modified method with Prodan, Eberhardt and Kleinn estimator
Fig. 5. Comparison of the standardized root squared error (sRE) for the estimation of the number of stems per hectare for the standard and modified k-tree sampling for k = 3, ..., 12 trees using different estimators: Poisson forest (a), cluster 1 forest (b), cluster 2 forest (c), actual forest (d)
k – fixed number of trees in each sampling plot, SMP, SME, SMK – standard method with Prodan, Eberhardt and Kleinn estimator, MMP, MME, MMK – modified method with Prodan, Eberhardt and Kleinn estimator
-10 0 10 20 30 40 50 60 70 80
Bi
as
(%
)
SMP SME SMK MMP MME MMK
-10 0 10 20 30 40 50 60 70 80
3 4 5 6 7 8 9 10 11 12
Bi
as
(
%
)
k 3 4 5 6 7 k 8 9 10 11 12
0.0 0.4 0.8 1.2 1.6 2.0 2.4
sR
E
SMP SME SMK MMP MME MMK
0.4 0.8 1.2 1.6 2.0 2.4 2.8
0.4 0.8 1.2 1.6 2.0 2.4 2.8
3 4 5 6 7 8 9 10 11 12
k
0.4 0.8 1.2 1.6 2.0 2.4 2.8
3 4 5 6 7 8 9 10 11 12
sR
E
k
(a) (b)
(c) (d)
(a) (b)
clustered forests were slightly higher than they are with the standard method, but the difference
de-creased with increasing k values. For all estimators,
the sRE of SM for a smaller k was higher than is the
MM in actual and strongly clustered forests, but for
k > 6, they are similar. Conversely, in the actual
for-est, for all estimators, sRE of MM was higher for
smaller k and for k > 6, resulting in similar values.
Third, for a given method, the Kleinn estimator produced the smallest and the Prodan estimator
produced the highest sRE for all k values. The sRE
of the Eberhardt estimator is very close to the re-sults from the Prodan estimator.
Efficiency
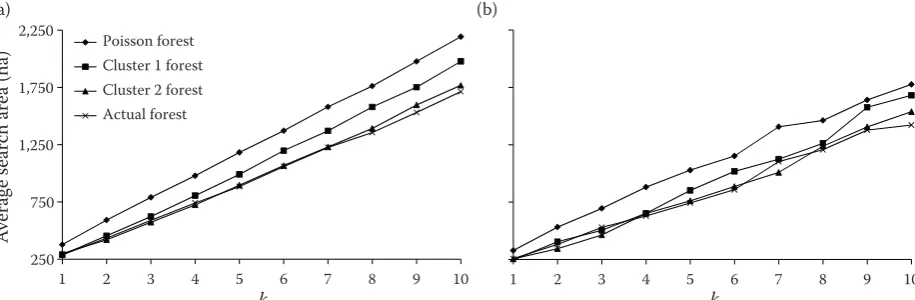
For the MM method, the line represents the av-erage search area in different forests. Fig. 6 shows that the search area using the standard method on the Poisson forest is the highest. Also, we can see that the stronger clustering in the spatial pattern for the trees can result in a reduction of the search area. In other words, the degree of clustering is negatively correlated with the search area for
dif-ferent k values. For smaller k values, the difference
between the methods, especially in clustered for-ests, is negligible. For higher values, in Poisson and less clustered forests, the average search area of MM is smaller than for SM. But, the average search area of these methods is similar for strongly clus-tered areas and actual forests (Fig. 6).
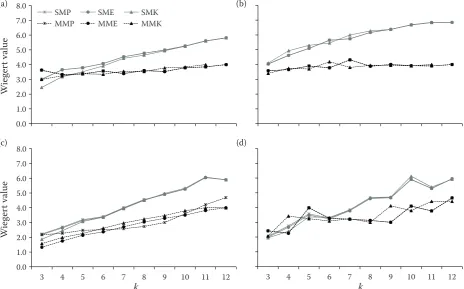
A comparison of the Wiegert value as an index of efficiency (smaller values indicate a more effi-cient approach) of the SM and MM methods
us-ing different estimators showed that for smaller k
values, there is no considerable difference between
the methods. But for k values greater than five, the
MM was more effective than was the SM method.
For intermediate k values (5–8), applying MM to
the Kleinn and Eberhardt estimators appears to be the most efficient approach (Fig. 7).
DISCUSSION
We presented a simple modification of the k-tree
sampling method to alleviate the problem of re-quiring a large search area for the inventory of low-density woodlands. We simulated sampling meth-ods with different estimators in an actual tree map from the Zagros oak woodlands in Central Iran, in addition to using three artificially generated tree maps with different spatial patterns. Our results showed that our modified method was superior to the standard method in terms of relative efficiency, across all of the actual and simulated maps. But, the results did not suggest a clear superiority of any of the three investigated estimators (Eberhardt, Prodan, Kleinn).
For the studied woodlands (both real and simu-lated), the modified method resulted in a lower bias than did most of the standard sampling methods, while also having a higher root square error. This means that the modified sampling method gener-ated more variable results than the standard
meth-od of k-tree sampling. Hence, to achieve a target
precision, more sampling points are needed with the modified method. To assess the advantages and limitations of the proposed method, the estimators should be compared on the basis of the total sam-pling time required to estimate tree density with a given accuracy and precision.
Although, the main objective of the modified sam-pling method was a reduction in the search area, a reduction in the apparent bias of ensuing estimates
1 2 3 4 5 6 7 8 9 10
k
250 750 1,250 1,750 2,250
1 2 3 4 5 6 7 8 9 10
Av
era
ge
se
ar
ch
a
re
a (ha)
k
[image:6.595.69.527.563.713.2]Poisson forest Cluster 1 forest Cluster 2 forest Actual forest
Fig. 6. Average search area for the standard (a) and the modified (b) methods of k-tree sampling to find the k nearest tree on a particular sample plot
k – fixed number of trees in each sampling plot
of stem density was also achieved by the modified sampling method. In both methods (SM, MM), the Eberhardt estimator produced the smallest amount of bias, while the estimator was nearly unbiased in Poisson patterns. Other researchers have also reported the use of Eberhardt estimator as an un-biased method for Poisson patterns (Lynch 2003; Kleinn, Vilčko 2006a). In all maps, MM reduced the estimate of bias to one-half of the estimate of bias by the SM. We should however note that even by applying the modified method, there is a bias. The reduction in bias is a result of combining plot
and k-tree methods. As a result, considering a
lim-ited radius for the plot survey puts the sampling method into a plot-sampling category. Fixing the maximum and minimum search radius has a strong influence on the results with respect to the perfor-mance of the modified sampling scheme.
Obviously, the performance of k-tree sampling
depends on the spatial pattern of the population to a large extent (Kleinn, Vilčko 2006b), where marked differences were observed in the
perfor-mance of k-tree sampling between Poisson and
clustered patterns. This confirms Lessard’s et al. (2002) and Kleinn and Vilčko’s (2006a) find-ings. Also, the heterogeneity of the forest stands
can highly affect the results. Considering sRE, the SM performs better than does the MM. The main reason is that applying MM will result in many zero values that increase the standard deviation of density estimates. One possible solution might
be to consider two different k values for the k-tree
sampling instead of the min and max radii for the search area.
The attractiveness of k-tree sampling is not due
to the method’s statistical performance, but rather to its practicality and ease of implementation (Kle-inn, Vilčko 2006a). But, sometimes, due to a large
search area for reaching k, any practical advantage
over sampling with fixed area plots is eliminated. We found that using the proposed MM with the Eberhardt estimator is superior to the combination of the standard method and three estimators.
Acknowledgment
I would like to express my very deep appreciation to Y. Askari for providing the actual map data for this research. Also, I wish to acknowledge the help with the fieldwork provided by A. Daryaei and A. Mokhtari.
0.0 1.0 2.0 3.0 4.0 5.0 6.0 7.0 8.0
W
ie
ge
rt
va
lu
e
SMP SME SMK
MMP MME MMK
0.0 1.0 2.0 3.0 4.0 5.0 6.0 7.0 8.0
3 4 5 6 7 8 9 10 11 12
W
ie
ge
rt
va
lu
e
[image:7.595.66.531.57.346.2]k 3 4 5 6 7 k 8 9 10 11 12
Fig. 7. Comparison of the Wiegert value of the number of efficiency for the standard and modified k-tree sampling for k = 3, ..., 12 trees using different estimators: Poisson forest (a), cluster 1 forest (b), cluster 2 forest (c), actual forest (d) k – fixed number of trees in each sampling plot, SMP, SME, SMK – standard method with Prodan, Eberhardt and Kleinn estimator, MMP, MME, MMK – modified method with Prodan, Eberhardt and Kleinn estimator
(a) (b)
References
Batcheler C.L., Craib D.G. (1985): A variable area plot method of assessment of forest condition and trend. New Zealand Journal of Forestry Science, 8: 83–95.
Byth K. (1982): On robust distance-based intensity estima-tors. Biometrics, 38: 127–135.
Diggle P.J. (1977): A note on robust density estimation for spatial point patterns. Biometrika, 64: 91–95.
Eberhardt L.L. (1967): Some developments in distance sam-pling. Biometrics, 23: 207–216.
Engeman R., Sugihara R., Pank L., Dusenberry W. (1994): A comparison of plotless density estimators using Monte Carlo simulation. Ecology, 75: 1769–1779.
Haxtema Z., Temesgen H., Marquardt T. (2012): Evaluation of n-tree distance sampling for inventory of headwater riparian forests of western Oregon. Western Journal of Applied Forestry, 27: 109–117.
Kleinn C., Vilčko F. (2006a): A new empirical approach for estimation in k-tree sampling. Forest Ecology and Manage-ment, 237: 522–533.
Kleinn C., Vilčko F. (2006b): Design-unbiased estimation for point-to-tree distance sampling. Canadian Journal of Forest Research, 36: 1407–1414.
Lessard V.C., Drummer T.D., Reed D.D. (2002): Precision of density estimates from fixed-radius plots compared to n-tree distance sampling. Forest Science, 48: 1–6. Lynch A.M. (2003): Comparison of fixed-area plot designs
for estimating stand characteristics and western spruce budworm damage in southwestern U.S.A. forests. Canadian Journal of Forest Research, 33: 1245–1255.
Magnussen S. (2015): A fixed count sampling estimator of stem density based on a survival function. Journal of Forest Science, 61: 485–495.
Magnussen S., Fehrman. L., Platt W.J. (2011): An adaptive composite density estimator for k-tree sampling. European Journal of Forest Research, 131: 307–320.
Morisita M. (1957): A new method for the estimation of density by the spacing method applicable to non-randomly distributed populations. Physiology and Ecology Japan, 7: 134–144. (in Japanese)
Nothdurft A., Saborowski J., Nuske R.S., Stoyan D. (2010): Density estimation based on k-tree sampling and point pat-tern reconstruction. Canadian Journal of Forest Research, 40: 953–967.
Patil S.A., Kovner J.L., Burnham K.P. (1982): Optimum nonparametric estimation of population density based on ordered distances. Biometrics, 38: 243–248.
Prodan M. (1968): Punktstichprobe für die Forsteinrichtung. Forst- und Holzwirt, 23: 225–226.
Sheil D., Ducey M.J., Sidiyasa K., Samsoedin I. (2003): A new type of sample unit for the efficient assessment of diverse tree communities in complex forest landscapes. Journal of Tropical Forest Science, 15: 117–135.
Stoyan D. (2006): Computer program STG 4.1: Stochastic geometry for Windows. Available at http://www.mathe. tu-freiberg.de/Stoyan/e-programm.html (accessed May 1, 2015).
Wiegert R.G. (1962): The selection of an optimum quadrat size for sampling the standing crop of grasses and forbs. Ecology, 43: 125–129.
Zhang L.C., Chambers R.L. (2004): Small area estimates for cross classifications. Journal of the Royal Statistical Society: Series B (Statistical Methodology), 66: 479–496.