Simulation of Two-Dimensional Infrared Spectroscopy of Peptides
Using Localized Normal Modes
Magnus W. D. Hanson-Heine, Fouad S. Husseini, Jonathan D. Hirst, and Nicholas A. Besley*
School of Chemistry, University of Nottingham, University Park, Nottingham NG7 2RD, United KingdomABSTRACT: Nonlinear two-dimensional infrared spectrosco-py (2DIR) is most commonly simulated within the framework of the exciton method. The key parameters for these calculations include the frequency of the oscillators within their molecular environments and coupling constants that describe the strength of coupling between the oscillators. It is shown that these quantities can be obtained directly from harmonic frequency calculations by exploiting a procedure that localizes the normal modes. This approach is demonstrated using the amide I modes of polypeptides. For linear and cyclic diamides and hexapeptide Z-Aib-L-Leu-(Aib)2-Gly-Aib-OtBu, the computed parameters are compared with those from
existing schemes, and the resulting 2DIR spectra are consistent with experimental observations. The incorporation of conformational averaging of structures from molecular dynamics simulations is discussed, and a hybrid scheme wherein the Hamiltonian matrix from the quantum chemical local-mode approach is combined withfluctuations from empirical schemes is shown to be consistent with experiment. The work demonstrates that localized vibrational modes can provide a foundation for the calculation of 2DIR spectra that does not rely on extensive parametrization and can be applied to a wide range of systems. For systems that are too large for quantum chemical harmonic frequency calculations, the local-mode approach provides a convenient platform for the development of site frequency and coupling maps.
■
INTRODUCTIONConventional infrared (IR) spectroscopy is a long-established technique for probing the structure of molecules. For larger molecules, IR spectra often become congested with many overlapping bands that can make spectra hard to interpret, with the consequence that much of the information contained within the spectra is lost. Two-dimensional infrared spectroscopy (2DIR) is the IR analogue to two-dimensional nuclear magnetic resonance spectroscopy, and reviews of this technique are available elsewhere.1−5 In 2DIR spectroscopy, the signal is generated from three ultrashort IR pulses and probes multiple quantum transitions, providing information on the coupling between vibrational modes, vibrational anharmonicities, and line broadening. Another feature of 2DIR spectroscopy is the polarization conditions of the IR pulses, which can be used to suppress or enhance different spectral features. Through spreading the transitions over a second frequency domain, 2DIR reveals more information by exposing cross peaks that correlate with the coupling between different vibrational modes.6,7,12,13In recent years, 2DIR has emerged as a powerful technique for studying chemical and biological sys-tems.1−5,14−18 One key advantage of 2DIR, compared with two-dimensional nuclear magnetic resonance, is its time resolution that can probe structural changes on the picosecond time scale. The amide I band of polypeptides and proteins is predominantly associated with the carbonyl stretch of the amide group and shows distinctive spectral characteristics depending on the nature of the secondary structure. The amide
I band is particularly amenable to 2DIR spectroscopy, and 2DIR has been applied to study polypeptides and pro-teins,6−11,13−19for example, monitoring the unfolding of a β -turn through the evolution of the cross peaks as the β-turn opened and inter-residue hydrogen bonds weakened.13
Complementary to the advancement of experimental 2DIR measurements, computational methods for the simulation of nonlinear spectroscopies have been developed through the inclusion of doubly excited states within the exciton method.6,8 The elements of the one-exciton Hamiltonian are given by8
ε
⟨ | ̂ | ⟩ =i H i1 1 i (1)
β
⟨ | ̂ | ⟩ =i H j1 ij
1 (2)
with the elements of the two-exciton Hamiltonian defined as
ε
⟨ | ̂ | ⟩ =i H i2 2 2 i − Δ (3)
ε ε
⟨i j H i j1 1| ̂ |1 1⟩ = i + j (4)
β
⟨i j H i k1 1| ̂ |1 1⟩ = jk (5)
β
⟨i j H j1 1| ̂ | ⟩ =2 2 ij (6)
Received: December 17, 2015
Published: February 25, 2016
Article
pubs.acs.org/JCTC
License, which permits unrestricted use, distribution and reproduction in any medium,
be separated into zero, one, and two quantum subspaces. The two-quantum transition dipole moments are expressed in terms of the local transition dipole moments according to
μ μ
⟨ | | ⟩ =i2 i1 2 0⟨ | | ⟩i1 (8)
μ μ
⟨i j1 1| | ⟩ = ⟨ | | ⟩i1 0 j1 (9)
Subsequent diagonalization of the Hamiltonian matrix yields the one- and two-exciton energies and eigenstates in addition to the transition dipoles between the eigenstates.
The key quantities for these calculations are the site frequencies and coupling constants. The site frequencies will be affected by the local environment and will be sensitive to factors such as hydrogen bonding and the electrostatic environment, and recently, multipole and dispersion effects have been shown to be significant.20,21The factors affecting the coupling between sites are more subtle, and the relative orientation of the oscillators is often considered to be important. The amide I mode in polypeptides is one of the most well-developed systems for the simulation of 2DIR. In addition to direct quantum chemical harmonic frequency analysis, the amide I mode and its sensitivity to its local molecular environment have been studied via molecular dynamics simulations,22,23an interaction energy decomposition scheme,24 a property transfer method,25 building block model,26 and empirical fitting.27 For the amide I mode, so-called maps that link the site frequencies and couplings to the molecular structure have been developed.21,28−43For example, factors that can be incorporated in quantifying a shift in the site frequency include the electrostatic field at the carbonyl group and a through-bond shift dependent on the dihedral (ψ,ϕ) angles. Other advances include incorporating different solvents28 and van der Waals forces21 in the parametrization of the maps, and the accuracy of different models for the IR spectroscopy of the amide I band of proteins has been assessed.44 Several approaches have also been proposed to describe the coupling between the vibrational modes. Krimm et al.45,46 developed the transition dipole coupling model that describes through-space coupling as the interaction between an oscillator dipole with adjacent dipoles. This model has been used in the simulation of the linear absorption spectra of globular proteins.29 It was shown that the model was not satisfactory for nearest-neighbor couplings,30 and Hamm and Woutersen proposed the transition charge coupling model that included higher order multipole contributions.31Through-bond coupling can be described using maps that account for the dependence of this coupling on the (ψ,ϕ) angles.43These maps are usually based on quantum chemical calculations on small model systems, but once the maps are available, calculations on very large systems or sampling of conformation can be undertaken without the need for further quantum chemical calculations.
can aid in the parametrization of appropriate site frequencies or coupling maps.
The harmonic frequencies and normal modes are obtained through diagonalization of the mass-weighted Hessian matrix
=
H( )q Q HT ( )mQ (10)
where the harmonic vibrational frequencies are obtained from the square root of the elements of the diagonal matrixH(q),Q
contains the normal modes in mass-weighted coordinates, and
H(m)is the mass-weighted Hessian matrix
= ∂ ∂ α β α β ⎛ ⎝ ⎜⎜ ⎞⎠⎟⎟ H m m E R R 1
i jm
i j i j ,
( ) 2
(11)
Riαis theα=x,y,zcomponent of atomiwith atomic massmi.
The normal modes do not form an ideal basis for the calculation of 2DIR because they are usually delocalized over the molecule. For example, the two amide I vibrational modes in a diamide can comprise in-phase and out-of-phase combinations of the two carbonyl stretching modes. Because the Hessian is diagonal, there is also no coupling between the normal modes at the level of the harmonic approximation.
Jacob and Reiher introduced a scheme for localizing normal modes.47This is achieved by transforming the normal modes by a unitary transformation (U) that localizes modes by maximizing a criterion,ζ(Q). For a set ofknormal modes for a system ofnatoms, the local modes are given by
=
Qloc QU (12)
There is no unique function ζ(Q), and two approaches were proposed in the original study. In this work, we use the localization criterion that maximizes the sum of the squares of the atomic contributions to the modes
∑ ∑
∑
ζ = α α = = = ⎡ ⎣ ⎢ ⎢ ⎤ ⎦ ⎥ ⎥ Q Q ( ) ( ) p k i nx y z i p at loc
1 1 , , , loc 2
2
(13)
which is analogous to the Pipek and Mezey scheme for the localization of molecular orbitals.48 This approach has been applied to polypeptides, with the relationship between the IR and Raman spectroscopies of the amide bands and the secondary structure explored,47,49,50 and has more recently been used to aid in the calculation of linear anharmonic vibrational spectroscopy.51−53In the localized mode basis, the Hessian matrix is no longer diagonal and is given by
=
Hloc U H UT ( )q (14)
the vibrational modes, with the sign of the coupling chosen to be consistent with the empirical model. Furthermore, the local modes coincide much more closely with the modes as interpreted in the analysis of experimental spectra. A coupling matrixΩ is computed as
Ωloc=U HT( ( ) 1/2q) U (15)
In this article, we demonstrate thatεiandβijderived from the diagonal and off-diagonal elements of Ωloc can be used to evaluate the matrix elements in an exciton calculation of 2DIR, yielding results that are consistent with both existing computa-tional methods and experimental observations.
■
COMPUTATIONAL DETAILSFollowing geometry optimization, vibrational frequencies, normal modes, and the corresponding localized normal modes were computed using density functional theory (DFT) with the B3LYP exchange-correlation functional.54,55 All quantum chemical calculations were performed with a develop-ment version of the Q-Chem software.56 For calculations on diamides, the 6-311++G** basis set57 was used and the harmonic vibrational frequencies were scaled by 0.96.58 For calculations on hexapeptide Z-Aib-L-Leu-(Aib)2-Gly-Aib-OtBu, a mixed basis set was employed using a combination of the 6-31G basis set for C and H atoms together with 6-31+G*for N and O atoms, and the vibrational frequencies were not scaled. The parameters and 2DIR spectra derived from the localized normal modes are compared with existing site frequency and coupling maps that are currently used to simulate amide I 2DIR spectra, which we refer to as local-mode and empirical approaches, respectively. More specifically, the site frequencies in the empirical maps are determined from the change in frequency for the amide I mode due to the surrounding electrostatic environment according to33
∑
ε =ε + ϕ
=
l
i
j j i j 0
1 4
,
(16)
whereε0is the unperturbed frequency that is set to 1680 cm−1, the summation is over the four atoms of the peptide group,ϕi,j is the electrostatic potential at atomjin peptide groupi, andlj are linear expansion coefficients. For neighboring groups, the off-diagonal coupling elements (βij) are evaluated using a nearest-neighbor coupling map39 that consists of force constants derived from DFT calculations on a dipeptide for all combinations of main-chain dihedral angles (in increments of 30°). The remaining off-diagonal coupling elements are given by the transition dipole coupling model,29 with a transition dipole of magnitude 3.7 D Å−1amu1/2placed 0.868 Å away from the amide carbonyl bond and oriented 20°toward the amide nitrogen in the OCN plane.
The one-quantum Hamiltonian matrix elements were used to construct a scaled two-quantum Hamiltonian,6comprising two-quantum local states and couplings. These elements are zero, except for the following cases
δ
= + − Δ
Hij ij, Hi i, Hj j, ij (17)
δ δ
= + ≠ ≠
Hii jk, 2 (Hi j ik, Hi k ij, ); ii jk j, k (18)
δ δ
= + ≠
Hij jk, Hi k,( ij jk); i k (19)
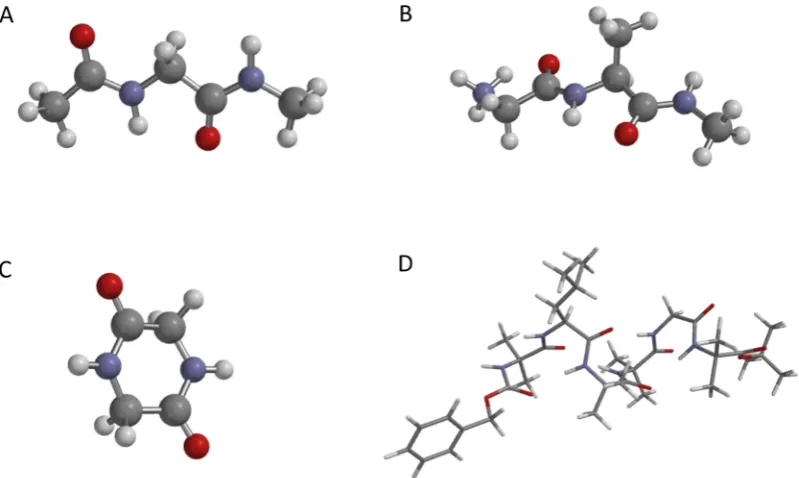
[image:3.625.113.513.67.306.2]Indices i, j, and k refer to different sites; δ is the Kronecker delta. The anharmonicity,Δ, wasfixed at 16 cm−1. A modified version of thepeptide C program of Hamm and Zanni59was used to construct to the two-quantum Hamiltonians and compute the associated 2DIR spectra. The signal is evaluated as the sum of the rephasing and nonrephasing components with the assumptions that the transition dipoles scale like a harmonic oscillator from the fundamental to the overtone (eq 8) and that the dephasing time for the 1→2 transition is the same as that for the 0→ 1 transition. Polarization conditions have been described previously by Hochstrasser,60 and we consider 2D signals computed using the ZZZZ polarization condition Figure 1. Molecular structures of the four systems studied: (A) N-acetylglycine-N-methyl-amide (NAGNMA), (B) glycine-alanine-NHMe (GANHMe), (C) 2,5-dioxopiperazine (DKP), and (D) Z-Aib-L-Leu-(Aib)2-Gly-Aib-OtBu (hexapeptide).
θ θ θ θ
θ θ
⟨ ⟩ = ⟨ +
+ ⟩
α β γ δ αβ γδ αγ βδ
αδ βγ
Z Z Z Z 1
15 cos cos cos cos
cos cos (20)
and the ZZXX polarization condition61
θ θ θ θ
θ θ
⟨ ⟩ = ⟨ −
− ⟩
α β γ δ αβ γδ αγ βδ
αδ βγ
Z Z X X 1
30 4cos cos cos cos
cos cos (21)
whereθmnis the angle between transition dipolesmandn. The line width was modeled by a Lorentzian function with a magnitude of 10 cm−1.
The four systems studied are illustrated inFigure 1. In order to probe the influence of dynamics on the spectra, classical molecular dynamics (MD) simulations were performed using the NAMD 2.9 molecular dynamics package62 for glycine-alanine-NHMe (GANHMe), 2,5-dioxopiperazine (DKP), and the hexapeptide. Each molecule was solvated in an octahedral prism box of TIP3P water molecules,63with the atoms of the peptide molecules at least 10 Å away from the edge of the box. Periodic boundary conditions were applied. This gave 375, 635, and 2475 water molecules for DKP, GANHMe, and the hexapeptide, respectively. For GANHMe, a Cl−counterion was added to neutralize the system. Long-range interactions were described using the particle mesh Ewald method,64 and the Lennard-Jones cutoffwas 12 Å. Following energy minimization for 15 000 cycles, an equilibration was performed for 0.25 ns with the NVT ensemble and an integration time step of 2 fs during which all covalent bonds involving hydrogen were constrained using the SHAKE algorithm.65 Production dynamics were performed for a period of 2 ns in the NPT ensemble using Langevin dynamics and a damping coefficient of 5 ps−1. The Nose−́ Hoover66−68 and Langevin piston69 periods were set to 100 fs, and their time-decay period was set to 50 fs to keep the temperature constant at 310 K while
maintaining pressure at 1 atm. Snapshots were sampled uniformly to give a total of 1000 snapshots for each system.
■
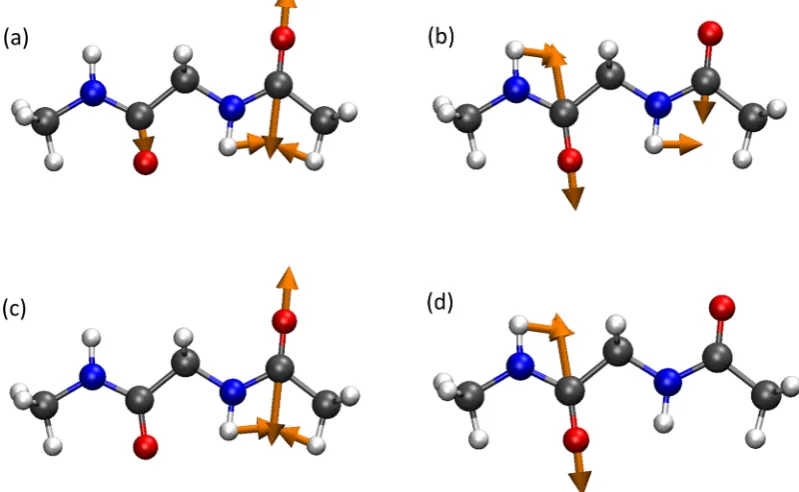
RESULTS AND DISCUSSIONThe amide I mode arises from the carbonyl stretching mode of the amide group with contributions from out-of-phase CN stretching, CCN deformation modes, and the NH in-plane bend. Figure 2 shows the normal modes and localized vibrational modes for the amide I modes in the linear diamide, NAGNMA. The normal modes corresponding to the amide I modes are delocalized across both amide groups, and the extent to which this delocalization occurs depends on the structure of the molecule and the relative orientation of the amide groups. Following localization, the two modes clearly conform to two amide I modes localized on each of the amide groups. Consequently, within the localized mode framework, it is possible to consider two local amide I modes interacting in a 2DIR experiment.
[image:4.625.111.511.77.323.2] [image:4.625.327.563.680.764.2]Diamides represent the simplest molecules for the study of amide I bands, and many computational studies have explored the IR spectroscopy of and the coupling between amide I vibrations in these systems.36,39,70−76 Table 1 shows the computed site energies and coupling for the three diamide molecules considered here. For DKP, the two amide groups are equivalent, the site energies predicted by the scheme of Figure 2.Amide I vibrational modes of diamide NAGNMA, computed from a B3LYP/6-311++G**calculation: (a, b) normal modes and (c, d) local modes.
Table 1. Calculated Diamide Site Energies and Coupling molecule method ε1/cm−1 ε2/cm−1 β12/cm−1
Jansen38 and the local-mode approach give ε1 and ε2 to be equal, and both methods give frequencies in good agreement with the experimentally observed value of 1697 cm−1.77For the two linear diamides, the two sites are no longer equivalent. However, the local-mode approach gives a significantly larger difference between the two frequencies. For these systems,
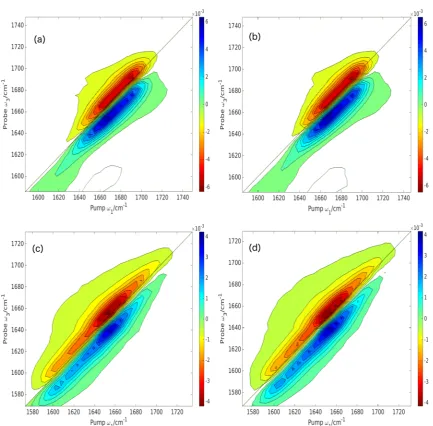
[image:5.625.61.566.58.633.2]there is no hydrogen bonding present, so this is a through-bond effect. There is also significant variation in the strength of the predicted coupling elements (β12). Within the local-mode approach, the magnitude of the coupling has the following trend: NAGNMA > GANHMe > DKP. This suggests that additional molecular structure between the two carbonyl groups Figure 3. Computed full absorptive 2DIR spectra for the ZZZZ pulse polarization scheme for (a) DKP, empirical; (b) DKP, local mode; (c) NAGNMA, empirical; (d) NAGNMA, local mode; (e) GANHMe, empirical; and (f) GANHMe, local mode. All are based on the minimum energy structure. Regions of zero intensity have been colored white for clarity.
results in a reduction in the strength of the coupling, which is physically intuitive for a through-bond effect. This trend is not observed in the coupling from the Jansen model, which predicts the strongest coupling to occur in DKP. There is a significant difference in the method to compute the site frequencies between the two models. In the Jansen scheme, the frequencies are determined through the perturbation of a reference
[image:6.625.159.466.65.187.2]frequency arising from the electrostatic environment, whereas the local mode frequencies are derived from the DFT calculations within the harmonic approximation. Consequently, differences between the resulting frequencies are not surprising. There is greater similarity between the two models for the description of the coupling strengths. In the Jansen model, the coupling is derived from DFT calculations on dimers using the Figure 4.Computed 1DIR spectra of (a) DKP, (b) NAGNMA, and (c) GANHMe. Black lines, empirical model; red lines, local-mode model.
Figure 5.Variation of the site energiesε1(top),ε2(center), and couplingβ12(bottom) of a dipeptide withψandϕangles. Left, empirical model;
[image:6.625.61.565.210.627.2]Hessian matrix reconstruction approach.78In this approach, the amide I mode is localized on the carbon and oxygen atoms of the carbonyl group, whereas in the local-mode description, the amide I mode also contains significant motion of the nitrogen atom (Figure 2), which is more consistent with the true nature of the amide I mode. This difference in the description of the amide I vibration between the two schemes is likely to result in different values for the computed coupling.
Figure 3 shows the computed 2DIR spectra for the ZZZZ pulse polarization scheme based on the minimum energy structure for the empirical (Jansen) and local-mode models, with the corresponding linear IR spectra shown inFigure 4. For DKP, all of the intensity is retained within one peak, and no cross peaks are evident. In the spectrum based on the empirical maps, the peak is shifted to a higher frequency, 1720 cm−1, compared with 1710 cm−1, which is a consequence of the larger coupling term. For the linear diamides, two distinct peaks are observed in the spectra. For the empirical model, the positive lobe of the peak at higher frequency is barely evident, whereas it can be clearly distinguished in the local-mode spectra. Cross peaks can also been seen for these molecules. For the empirical spectra, these tend to merge into the main peaks, whereas in the local-mode spectra, they are more clearly separated from the main peaks. This is a consequence of the greater separation between the main peaks in the local-mode spectra, which arises from the greater splitting between the site energies. The linear IR spectra have a similar band profile for the empirical and local-mode models. However, the local-mode model predicts the bands to lie at lower frequencies, and a greater splitting between the two distinct peaks in the linear diamides is evident on closer inspection. These calculations do not include a description of the solvent. The solvent can have a large effect on the computed frequencies, and within a large polypeptide, amide groups can be fully exposed to the solvent or buried in hydrophobic regions. Within the DFT calculations, solvent can be described by the inclusion of specific molecules within the calculation. However, such calculations would be computation-ally expensive and not practical for many systems. Continuum solvent can provide an efficient alternative that, if the necessary analytical derivatives are available, does not add significantly to the computational cost, and recent work has shown these solvent models to provide a robust approach for the simulation of the IR spectroscopy of proteins in solution.79At a lower level of computational cost, the electrostatic component of the solvent interaction can be incorporated viaeq 16.
These spectra are based on a single structure, whereas simulating experimental measurements requires averaging over many structures. These can be achieved through averaging many spectra computed using structural snapshots extracted from MD simulations. For the local-mode approach, this is not straightforward because harmonic frequency analysis requires the structure to be at a minimum. Possible solutions include incorporating empirical-based broadening to the diagonal elements of the Hamiltonian matrix59 or constrained optimization, whereby the regions of the molecule where the vibrational modes are localized are allowed to relax while the remainder of the molecule is held fixed. Alternatively, the effects of dynamics can be included through the use of the local-mode approach in the generation of maps to describe the site energies and coupling or, as discussed later, through hybrid schemes wherein the local-mode Hamiltonian is combined with fluctuations arising from the dynamics evaluated using empirical approaches.
Figure 5 shows contour plots of the values of the site energies (ε1and ε2) and coupling (β12) as a function of the (ϕ,ψ) angles for the linear diamide, NAGNMA. In the calculation of these maps for the local modes, prior to the frequency calculation, a constrained geometry optimization is performed, with the (ϕ,ψ) angles constrained to values between −180° and 180° in 10° steps and with all other degrees of freedom allowed to relax. Within the local-mode model, the site energies are given by the local-mode diagonal elements, and the coupling, by the off-diagonal elements of theΩmatrix (seeeq 15). These maps can be compared directly with the empirical site frequency and coupling maps, which are also shown. A previous study has compared in detail site frequency and coupling (ϕ,ψ) maps from a local-mode approach and the Hessian matrix reconstruction method.80 In this study, the amide I mode was represented by the carbonyl stretching coordinate, and the second derivatives were evaluated numeri-cally viafinite difference. One of the conclusions of the work was that the Hessian matrix reconstruction approach was preferable because it reproduced the correct normal-mode frequencies at a lower computational cost. The local-mode approach used in this previous study differs significantly from the approach employed here. First, the local amide I mode in this study is not confined to the carbon and oxygen atoms, and in our approach, the derivatives are evaluated analytically, which means that multiple energy evaluations at displaced coordinates are not necessary. Finally, in our experience, it is problematic to evaluate the off-diagonal derivatives of the Hessian matrix in local-mode coordinates with sufficient accuracy via numerical schemes. There is good qualitative agreement between the maps for the site energies and particularly the coupling. The maps for the sites energies from the local-mode calculations are less smooth than those from the empirical model. One reason for this could be the additional structural information contained in the local-mode description of the coupling, and another factor is that the local mode maps have been calculated using steps of 10°, whereas the empirical maps used a step size of 30°, which results in a greater degree of interpolation.
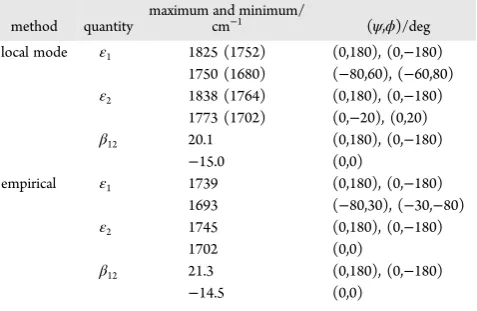
[image:7.625.326.565.609.764.2]The consistency between the maps can be quantified by examining the values and locations of the maxima and minima, which are given inTable 2. The local-mode coupling approach predicts the maximum and minimum values for the coupling to have a very similar magnitude and for the same geometry as the empirical model. If the site frequencies from the local-mode approach are scaled by the established value of 0.96,58 then
Table 2. Maxima and Minima in the Site Frequency and Coupling Maps
method quantity
maximum and minimum/
cm−1 (ψ,ϕ)/deg
local mode ε1 1825 (1752) (0,180), (0,−180) 1750 (1680) (−80,60), (−60,80) ε2 1838 (1764) (0,180), (0,−180)
1773 (1702) (0,−20), (0,20) β12 20.1 (0,180), (0,−180)
−15.0 (0,0)
empirical ε1 1739 (0,180), (0,−180) 1693 (−80,30), (−30,−80) ε2 1745 (0,180), (0,−180)
1702 (0,0)
β12 21.3 (0,180), (0,−180)
there is a reasonable quantitative agreement between the two approaches. The most significant differences occur in the location of the minima for the lower site frequencies, and the local-mode approach predicts a larger difference between the highest and lowest frequencies. Spectra that incorporate structural averaging for DKP and GANHMe are shown in
Figure 6, with the linear IR spectra shown in Figure 7. In addition to the inclusion of conformational averaging, these spectra also incorporate a description of the solvent via an electrostatic term added to the diagonal elements (eq 16). The spectra are more typical of experimental 2DIR spectra and are spread along the diagonal, with the spectra for DKP being more compact. This is a result of there being only one peak in the spectrum for the minimum energy structure of this molecule. The similarity of the maps is reflected in the computed spectra, and there is little difference between the spectra computed with the different maps.
For diamide systems, there is a high degree of similarity between the empirical and local-mode approaches. However, for larger systems, the two schemes become more distinct.
Within the local-mode approach, all of the interactions between the amide groups are treated at an equivalent level, whereas in the empirical scheme, non-nearest neighbor interactions are treated at a more approximate level. Furthermore, the site energies incorporate electrostatic, through-bond, and hydrogen bond effects explicitly. To explore this further, we consider Figure 6.Computed full absorptive 2DIR spectra for the ZZZZ pulse polarization scheme incorporating averaging over conformation for (a) DKP, empirical; (b) DKP, local mode; (c) GANHMe, empirical; and (d) GANHMe, local mode. Regions of zero intensity have been colored white for clarity.
hexapeptide Z-Aib-L-Leu-(Aib)2-Gly-Aib-OtBu.Table 3 shows the site energies and coupling values for the hexapeptide from
both empirical and local-mode approaches, where the carbonyl groups are labeled 1−7 along the hexapeptide backbone, as indicated inFigure 8. For the empirical model, only values for the peptide groups are included because the model has been parametrized for these groups. However, we note that it is possible to determine parameters for the other two carbonyl groups.42 The capability of generating site frequencies and couplings for new functional groups represents one of the important features of the local-mode approach. Experimental 2DIR spectra for this molecule have been reported,42and the spectrum measured in CDCl3shows two distinct bands in the spectral region considered here. The first of these, at about 1675 cm−1, corresponds to the peptide’s carbonyl groups, whereas a second, smaller band at about 1725 cm−1arises from the urethane/ester carbonyl groups (see Figure 3a of ref28).
The site frequencies for the peptide groups from the local-mode local-model show a smaller variation compared to that from the empirical model. In particular, the predicted frequency for carbonyl 6 is considerably lower than the respective local-mode value and the other peptide groups within the empirical model. Previous work has found that the site frequency maps perform less well for terminal amide groups and that they work better for interior amide groups.81The computed site frequencies for the hexapeptide appear to be consistent with this finding. In agreement with experiment, the carbonyl frequencies of the urethane and ester groups have significantly higher frequencies. The coupling values from the local-mode model tend to be largest between neighboring groups and then decrease as the
carbonyl groups become farther apart. This pattern is not evident from the empirical model, and, overall, the strength of coupling is weaker from the empirical scheme, particularly for the nearest-neighbor coupling elements. The inclusion of the urethane and ester groups within the local-mode calculation allows the strength of the coupling between these groups and the peptides group to be assessed. The values obtained here can be compared to those determined by Maekawa et al.42 in a previous study, where the ester/amide I and urethane/amide I couplings were reported to be 13.0 and 6.6 cm−1, respectively. The corresponding local-mode values for the neighboring peptide group are 4.6 and 3.8 cm−1. These values are smaller than those determined previously, and the value for the ester group is more consistent with the urethane one. For the simulation of 2DIR spectra of small polypeptides, the inclusion of all backbone carbonyl groups within the calculation is likely to be important. The calculations show significant coupling between these groups and the neighboring peptide groups. Consequently, the inclusion of these groups can affect the frequency distribution of the peptide frequencies and may also lead to a redistribution of intensity.82
Figure 9 shows the computed 2DIR spectra for the hexapeptide for the empirical and local-mode approaches based on the minimum energy structure, with the correspond-ing linear IR spectra shown inFigure 10. Wefirst consider the local-mode spectrum, where three distinct bands are evident. The largest band at about 1680 cm−1arises from the peptide groups; the two smaller bands at higher frequency correspond to the urethane and ester groups. The computed spectrum is in good agreement with the experimental spectrum, which has a large band at 1675 cm−1from the peptide groups and a smaller band at about 1725 cm−1from the urethane and ester groups.42 The main difference between the calculation and experiment is that in the computed spectrum the two bands from the urethane and ester groups are distinct, whereas in experiment, only one band is observed. However, the computed spectrum corresponds to a single structure in the gas phase, and it is likely that these two bands would merge following averaging over conformations, particularly since the groups at the end of the molecule are likely to be the most conformationally labile. The higher frequency bands are not evident in the empirical spectrum because these groups are not included in the calculation. In the empirical spectrum, the distinct bands that can be observed are associated with the terminal peptide groups, and the peptide groups associated with the different bands are indicated in thefigure. The distinct band at lower frequency that arises from the peptide is from group 6, whose computed frequency is significantly lower.
DFT-based harmonic frequency calculations with a basis set of sufficient quality are computationally expensive. While strategies exist for reducing the cost of these calculations,83 performing many calculations on structures that sample the
Table 3. Calculated Site Energies and Coupling Constants (in cm−1) for the Hexapeptide from Local-Mode and Empirical Modelsa
1 2 3 4 5 6 7
local mode
1718.9 3.8 −3.9 −1.4 −0.6 −0.6 −0.3 1692.8 3.4 −2.4 −0.8 −0.6 −0.4 1678.0 5.4 −2.5 −1.5 −0.4 1682.4 2.6 2.1 −0.8 1692.7 1.6 −1.1 1686.9 4.6 1739.9 empirical
1679.0 0.9 −1.5 −0.6 −0.2 1667.2 1.0 −1.8 −1.2 1669.6 0.2 −1.6 1668.6 0.5 1653.9
aWithin the empirical model, only the peptide carbonyls are
considered.
Figure 8.Nature of carbonyl groups in the hexapeptide.
conformational dynamics is not feasible for a molecule as large as a hexapeptide. We also note that these calculations are formally valid only at a minimum energy structure; however, the use of partially constrained optimization is widely used.84In order to overcome this limitation, we adopt a hybrid approach
εi n
empirical site energy at conformation n. Similarly, for the coupling constants
βij( )n =βijlocal,min+ Δβijemp( )n (24)
β β β
Δ ijemp( )n = ijemp( )n − ijlocal,min (25)
Within this framework, the variation in the matrix elements arising from the presence of the solvent will also be included.
[image:10.625.61.301.64.445.2]Figure 11shows the simulated spectra for the peptide groups, with the urethane and ester groups excluded, incorporating averaging over molecular conformation. Compared with the spectra for the single minimum energy structure, both spectra show considerable elongation of the signal along the diagonal, and the distinct peak at low frequency observed for the static empirical spectrum is no longer observed and is merged with the main peak. Closer inspection of the spectra shows some significant differences between the two approaches. The hybrid spectrum is shifted to higher frequency and the empirical spectrum shows distinct peaks within the main signal, whereas these are not evident in the hybrid spectrum, which gives a smooth single peak. Both of these effects are likely to be a consequence of the modification of the diagonal elements.
[image:10.625.60.302.513.641.2]Figure 12shows absolute magnitude 2DIR spectra for ZZXX polarization. These spectra can be compared to the experimental spectrum reported by Maekawa et al.42 (see Figure 3a of ref 28). The experimental spectrum has a large signal centered at about 1656 cm−1 arising from the peptide groups. Both empirical and local-mode spectra for the peptide groups are qualitatively similar. However, the empirical spectrum is centered at 1643 cm−1, whereas the hybrid spectrum is centered at 1658 cm−1. The shape of the signal is roughly elliptical, and it is possible to obtain an approximate measure of the shape by considering the ratio of the long and short axes of the ellipse. In the experimental spectrum, this ratio is approximately 1.7, and the corresponding values for the empirical and hybrid spectra are 2.3 and 2.0, respectively. Both of these measures suggest an improvement in the computed spectrum for the local-mode approach. However, we note that direct comparison with experimental is not possible because the experiment spectrum was measured in a different solvent, which can affect the 2DIR signal.20,85Furthermore, other factors, such as the vibrational motional narrowing effect, which describes a phenomenon in which the line width may be overestimated by static structural snapshots,86−88 may also influence the computed spectrum. These effects have been shown to be significant forN-methylacetamide in solution,89but it has been suggested that these effects become less important for polypeptides because of the spread of the multiple amide modes of the protein.79However, in the calculations presented, the broadening of the lines arising from sampling structures from the MD simulations is the same for both the empirical and Figure 9.Computed full absorptive hexapeptide 2DIR spectra for the
ZZZZ pulse polarization scheme based on the minimum energy structure. Top, empirical model; bottom, local-mode model. Regions of zero intensity have been colored white for clarity. In the empirical model spectrum, the peaks are labeled according to the amide group.
hybrid local-mode approaches, so there is no difference between the two approaches in the treatment of these effects.
■
CONCLUSIONS [image:11.625.325.566.56.462.2]It has been shown that the site frequencies and coupling constants that are required for the simulation of 2DIR spectra with the exciton method can be evaluated directly from quantum chemical harmonic frequency calculations by exploiting a transformation to localized vibrational modes. Such an approach opens the possibility for simulating 2DIR spectra without the need for extensivea prioriparametrization. This scheme has been demonstrated by considering the 2DIR spectroscopy of the amide I band of polypeptides. For the linear and cyclic diamide systems considered, there are significant differences between the site frequencies and coupling constants computed using the local-mode approach and established empirical models. Within the local-mode approach, there is a greater separation between nonequivalent site frequencies and the coupling constants show a physically reasonable trend of decreasing as the molecular structure between the carbonyl groups increases. For the hexapeptide, the local-mode approach is able to treat all carbonyl groups and their respective interactions at an equivalent level of theory. There is agreement with the available experimental data of a Figure 11.Computed full absorptive hexapeptide 2DIR spectra for the
[image:11.625.60.298.57.646.2]ZZZZ pulse polarization scheme incorporating conformational averaging. Top, empirical model; center, hybrid local-mode model; bottom, difference (hybrid − empirical). Regions of zero intensity have been colored white for clarity.
Figure 12.Computed absolute magnitude hexapeptide 2DIR spectra for the ZZXX pulse polarization scheme incorporating conformational averaging. Top, empirical model; bottom, hybrid local-mode model. Regions of zero intensity have been colored white for clarity.
tionally much cheaper method. For calculations of the 2DIR spectroscopy of very large systems, such as full proteins,17,18the local-mode approach can provide a platform for the para-metrization of suitable site frequency and coupling maps that specify the value of these parameters with respect to critical geometrical coordinates. The local-mode approach described here is particularly suitable for this because it can be applied directly to different functional groups.
■
AUTHOR INFORMATIONCorresponding Author
*E-mail: [email protected].
Funding
M.W.D.H.-H. acknowledges the University of Nottingham and the EPSRC (EP/L50502X/1) for funding. N.A.B. thanks the Leverhulme Trust for a Research Fellowship (RF-2014-231) and the EPSRC for funding (Grant No. EP/L021366/1). We also acknowledge the Saudi Cultural Bureau for funding.
Notes
The authors declare no competingfinancial interest.
■
ACKNOWLEDGMENTSWe thank the University of Nottingham for access to its High Performance Computing and MidPlus facilities and Neil Hunt (Strathclyde) and Tony Parker (RAL) for useful discussions.
■
REFERENCES(1) Hochstrasser, R. M. Two-dimensional spectroscopy at infrared and optical frequencies. Proc. Natl. Acad. Sci. U. S. A. 2007, 104, 14190−14196.
(2) Finkelstein, I. J.; Zheng, J. R.; Ishikawa, H.; Kim, S.; Kwak, K.; Fayer, M. D. Probing dynamics of complex molecular systems with ultrafast 2D IR vibrational echo spectroscopy.Phys. Chem. Chem. Phys.
2007,9, 1533−1549.
(3) Ganim, Z.; Chung, H. S.; Smith, A. W.; Deflores, L. P.; Jones, K. C.; Tokmakoff, A. Amide I Two-Dimensional Infrared Spectroscopy of Proteins.Acc. Chem. Res.2008,41, 432−441.
(4) Bredenbeck, J.; Helbing, J.; Kolano, C.; Hamm, P. Ultrafast 2D-IR spectroscopy of transient species.ChemPhysChem2007,8, 1747− 1756.
(5) Hunt, N. T. 2D-IR spectroscopy: ultrafast insights into biomolecule structure and function. Chem. Soc. Rev. 2009, 38, 1837−1848.
(6) Hamm, P.; Lim, M. H.; Hochstrasser, R. M. Structure of the amide I band of peptides measured by femtosecond nonlinear-infrared spectroscopy.J. Phys. Chem. B1998,102, 6123−6138.
(7) Asplund, M. C.; Zanni, M. T.; Hochstrasser, R. M. Two-dimensional infrared spectroscopy of peptides by phase-controlled femtosecond vibrational photon echoes.Proc. Natl. Acad. Sci. U. S. A.
2000,97, 8219−8224.
(8) Woutersen, S.; Hamm, P. Time-resolved two-dimensional vibrational spectroscopy of a short α-helix in water. J. Chem. Phys.
2001,115, 7737−7743.
spectroscopy: An experimental and theoretical comparison.J. Chem. Phys.2004,121, 5935−5942.
(13) Kolano, C.; Helbing, J.; Kozinski, M.; Sander, W.; Hamm, P. Watching hydrogen-bond dynamics in a boldβ-turn by transient two-dimensional infrared spectroscopy.Nature2006,444, 469−472.
(14) Kim, Y. S.; Liu, L.; Axelsen, P. H.; Hochstrasser, R. M. 2D IR Provides Evidence for Mobile Water Molecules in Beta-Amyloid Fibrils.Proc. Natl. Acad. Sci. U. S. A.2009,106, 17751−17756.
(15) Middleton, C. T.; Marek, P.; Cao, P.; Chiu, C. C.; Singh, S.; Woys, A. M.; de Pablo, J. J.; Raleigh, D. P.; Zanni, M. T. Two-dimensional infrared spectroscopy reveals the complex behaviour of an amyloid fibril inhibitor.Nat. Chem.2012,4, 355−360.
(16) Hill, R. E.; Hunt, N. T.; Hirst, J. D. Studying biomacromolecules with two-dimensional infrared spectroscopy.Adv. Protein Chem. Struct. Biol.2013,93, 13150.
(17) Ganim, Z.; Jones, K. C.; Tokmakoff, A. Insulin dimer dissociation and unfolding revealed by amide Itwo-dimensional infrared spectroscopy.Phys. Chem. Chem. Phys.2010,12, 3579−3588. (18) Liang, C.; Louhivuori, M.; Marrink, S. J.; Jansen, T. L. C.; Knoester, J. Vibrational spectra of a mechanosensitive channel.J. Phys. Chem. Lett.2013,4, 448−452.
(19) Reppert, M.; Tokmakoff, A. Electrostatic frequency shifts in amide I vibrational spectra: Direct parameterization against experi-ment.J. Chem. Phys.2013,138, 134116.
(20) Jansen, T. L. C. Linear absorption and two-dimensional infrared spectra of N-methylacetamide in chloroform revisited: Polarizability and multipole effects.J. Phys. Chem. B2014,118, 8162−8169.
(21) Małolepsza, E.; Straub, J. E. Empirical maps for the calculation of amide I vibrational spectra of proteins from classical molecular dynamics simulations.J. Phys. Chem. B2014,118, 7848−7855.
(22) Gaigeot, M.-P. Infrared spectroscopy of the alanine dipeptide analog in liquid water with DFT-MD. Direct evidence for PII/β
conformations.Phys. Chem. Chem. Phys.2010,12, 10198−10209. (23) Farag, M. H.; Bastida, A.; Ruiz-Lopez, M. F.; Monard, G.;́ Ingrosso, F. Vibrational energy relaxation of the amide I mode of N-methylacetamide in D2O studied through Born-Oppenheimer
molecular dynamics.J. Phys. Chem. B2014,118, 6186−6197. (24) Farag, M. H.; Ruiz-López, M. F.; Bastida, A.; Monard, G.; Ingrosso, F. Hydration effect on amide I infrared bands in water: An interpretation based on an interaction energy decomposition scheme.
J. Phys. Chem. B2015,119, 9056−9067.
(25) Turner, D. R.; Kubelka, J. Infrared and vibrational CD spectra of partially solvated α-helices: DFT-based simulations with explicit solvent.J. Phys. Chem. B2007,111, 1834−1845.
(26) Gorbunov, R. D.; Stock, G. Ab initio based building block model of amide I vibrations in peptides.Chem. Phys. Lett.2007,437, 272− 276.
(27) Besley, N. A. Theoretical modelling of amide bands in solution.
J. Phys. Chem. A2004,108, 10794−10800.
(28) Wang, L.; Middleton, C. T.; Zanni, M. T.; Skinner, J. L. Development and validation of transferable amide I vibrational frequency maps for peptides.J. Phys. Chem. B2011,115, 3713−3724. (29) Torii, H.; Tasumi, M. Model calculations on the amide I infrared bands of globular proteins.J. Chem. Phys.1992,96, 3379− 3387.
tripeptides and considerations on the conformation of the extended helix.J. Raman Spectrosc.1998,29, 81−86.
(31) Hamm, P.; Woutersen, S. Coupling of the amide I modes of the glycine dipeptide.Bull. Chem. Soc. Jpn.2002,75, 985−988.
(32) Bour, P.; Keiderling, T. A. Empirical modeling of the peptide amide I band IR intensity in water solution.J. Chem. Phys.2003,119, 11253−11262.
(33) Ham, S.; Kim, J. H.; Lee, H.; Cho, M. H. Correlation between electronic and molecular structure distortions and vibrational proper-ties. II. Amide I modes of NMA-nD2O complexes.J. Chem. Phys.2003,
118, 3491−3498.
(34) Schmidt, J. R.; Corcelli, S. A.; Skinner, J. L. Ultrafast vibrational spectroscopy of water and aqueous N-methylacetamide: Comparison of different electronic structure/molecular dynamics approaches. J. Chem. Phys.2004,121, 8887−8896.
(35) Hayashi, T.; Zhuang, W.; Mukamel, S. Electrostatic DFT map for the complete vibrational amide band of NMA.J. Phys. Chem. A
2005,109, 9747−9759.
(36) Watson, T. M.; Hirst, J. D. Calculating vibrational frequencies of amides: From formamide to concanavalin A.Phys. Chem. Chem. Phys.
2004,6, 998−1005.
(37) Watson, T. M.; Hirst, J. D. Theoretical studies of the amide I vibrational frequencies of [Leu]-enkephalin. Mol. Phys. 2005, 103, 1531−1546.
(38) Jansen, T. L.; Knoester, J. A transferable electrostatic map for solvation effects on amide I vibrations and its application to linear and two-dimensional spectroscopy.J. Chem. Phys.2006,124, 044502.
(39) Jansen, T. L.; Dijkstra, A. G.; Watson, T. M.; Hirst, J. D.; Knoester, J. Modeling the amide I bands of small peptides.J. Chem. Phys.2006,125, 044312.
(40) Kim, Y. S.; Hochstrasser, R. M. Applications of 2D IR spectroscopy to peptides, proteins, and hydrogen-bond dynamics.J. Phys. Chem. B2009,113, 8231−8251.
(41) Cai, K. C.; Han, C.; Wang, J. P. Molecular mechanics force field-based map for peptide amide-I mode in solution and its application to alanine di- and tripeptides.Phys. Chem. Chem. Phys.2009,11, 9149− 9159.
(42) Maekawa, H.; De Poli, M.; Moretto, A.; Toniolo, C.; Ge, N. H. Toward detecting the formation of a single helical turn by 2D IR cross peaks between the amide-I and -II modes.J. Phys. Chem. B2009,113, 11775−11786.
(43) Roy, S.; Lessing, J.; Meisl, G.; Ganim, Z.; Tokmakoff, A.; Knoester, J.; Jansen, T. L. C. Solvent and conformation dependence of amide I vibrations in peptides and proteins containing proline.J. Chem. Phys.2011,135, 234507.
(44) Bondarenko, A. S.; Jansen, T. L. C. Application of two-dimensional infrared spectroscopy to benchmark models for the amide I band of proteins.J. Chem. Phys.2015,142, 212437.
(45) Krimm, S. Vibrational Analysis of Conformation in Peptides, Polypeptides, and Proteins.Biopolymers1983,22, 217−225.
(46) Krimm, S.; Bandekar, J. Vibrational Spectroscopy and Conformation of Peptides, Polypeptides, and Proteins. Adv. Protein Chem.1986,38, 181−364.
(47) Jacob, C. R.; Reiher, M. Localizing normal modes in large molecules.J. Chem. Phys.2009,130, 084106.
(48) Pipek, J.; Mezey, P. G. A fast intrinsic localization procedure applicable for ab initio and semiempirical linear combination of atomic orbital wave functions.J. Chem. Phys.1989,90, 4916−4926.
(49) Jacob, C. R.; Luber, S.; Reiher, M. Analysis of secondary structure effects on the IR and raman spectra of polypeptides in terms of localized vibrations.J. Phys. Chem. B2009,113, 6558−6573.
(50) Weymuth, T.; Jacob, C. R.; Reiher, M. A local-mode model for understanding the dependence of the extended amide III vibrations on protein secondary structure.J. Phys. Chem. B2010,114, 10649−10660. (51) Cheng, X.; Steele, R. P. Efficient anharmonic vibrational spectroscopy for large molecules using local-mode coordinates. J. Chem. Phys.2014,141, 104105.
(52) Panek, P. T.; Jacob, C. R. Efficient calculation of anharmonic vibrational spectra of large molecules with localized modes.
ChemPhysChem2014,15, 3365−3377.
(53) Hanson-Heine, M. W. D. Examining the impact of harmonic correlation on vibrational frequencies calculated in localized coordinates.J. Chem. Phys.2015,143, 164104.
(54) Becke, A. D. Density-functional thermochemistry. III. The role of exact exchange.J. Chem. Phys.1993,98, 5648−5652.
(55) Stephens, P. J.; Devlin, F. J.; Chabalowski, C. F.; Frisch, M. J. Ab initio calculation of vibrational absorption and circular dichroism spectra using density functional force fields.J. Phys. Chem.1994,98, 11623−11627.
(56) Shao, Y.; Gan, Z.; Epifanovsky, E.; Gilbert, A. T. B.; Wormit, M.; Kussmann, J.; Lange, A. W.; Behn, A.; Deng, J.; Feng, X.; et al. Advances in molecular quantum chemistry contained in the Q-Chem 4 program package.Mol. Phys.2015,113, 184−215.
(57) Krishnan, R.; Binkley, J. S.; Seeger, R.; Pople, J. A. Self-consistent molecular orbital methods. XX. A basis set for correlated wave functions.J. Chem. Phys.1980,72, 650−654.
(58) Scott, A. P.; Radom, L. Harmonic vibrational frequencies: An evaluation of Hartree-Fock, Møller-Plesset, quadratic configuration interaction, density functional theory, and semi-empirical scalefactors.
J. Phys. Chem.1996,100, 16502−16513.
(59) Zanni, M.; Hamm, P. Concepts and Methods of 2D Infrared Spectroscopy; Cambridge University Press: Cambridge, 2011.
(60) Hochstrasser, R. M. Two-dimensional IR-spectroscopy: Polar-ization anisotropy effects.Chem. Phys.2001,266, 273−284.
(61) Zanni, M. T.; Ge, N.-H.; Kim, Y. S.; Hochstrasser, R. M. Two-dimensional IR spectroscopy can be designed to eliminate the diagonal peaks and expose only the crosspeaks needed for structure determination.Proc. Natl. Acad. Sci. U. S. A.2001,98, 11265−11270. (62) Phillips, J. C.; Braun, R.; Wang, W.; Gumbart, J.; Tajkhorshid, E.; Villa, E.; Chipot, C.; Skeel, R. D.; Kale, L.; Schulten, K. Scalable molecular dynamics with NAMD.J. Comput. Chem.2005,26, 1781− 1802.
(63) Jorgensen, W. L.; Chandrasekhar, J.; Madura, J. D.; Impey, R. W.; Klein, M. L. Comparison of simple potential functions for simulating water.J. Chem. Phys.1983,79, 926−935.
(64) Darden, T.; York, D.; Pedersen, L. Particle mesh Ewald: An N.log(N) method for Ewald sums in large systems. J. Chem. Phys.
1993,98, 10089−10092.
(65) Ryckaert, J. P.; Ciccotti, G.; Berendsen, H. J. C. Numerical integration of the cartesian equations of motion of a system with constraints: Molecular dynamics of N-alkanes.J. Comput. Phys.1977,
23, 327−341.
(66) Nose, S. A unified formulation of the constant temperaturé molecular dynamics method.J. Chem. Phys.1984,81, 511−519.
(67) Hoover, W. G. Canonical dynamics: Equilibrium phase space distributions.Phys. Rev. A: At., Mol., Opt. Phys.1985,31, 1695−1697. (68) Martyna, G. J.; Tobias, D. J.; Klein, M. L. Constant pressure molecular dynamics algorithms.J. Chem. Phys.1994,101, 4177−4189. (69) Feller, S. E.; Zhang, Y.; Pastor, R. W.; Brooks, B. R. Constant pressure molecular dynamics simulation: The Langevin piston method.
J. Chem. Phys.1995,103, 4613−4621.
(70) Hirst, J. D.; Persson, B. J. Ab initio calculations of the vibrational and electronic spectra of diketopiperazine.J. Phys. Chem. A1998,102, 7519−7524.
(71) Besley, N. A.; Brienne, M.-J.; Hirst, J. D. Electronic structure of a rigid cyclic diamide.J. Phys. Chem. B2000,104, 12371−12377.
(72) Watson, T. M.; Hirst, J. D. DFT vibrational frequencies of amides and amide dimers.J. Phys. Chem. A2002,106, 7858−7867.
(73) Papamokos, G. V.; Demetropoulos, I. N. Vibrational frequencies of amides and amide dimers: The assessment of PW91(xc) functional.
J. Phys. Chem. A2004,108, 7291−7300.
(74) Wang, J. P.; Hochstrasser, R. M. Anharmonicity of amide modes.J. Phys. Chem. B2006,110, 3798−3807.
(75) Wang, J. Conformational dependence of anharmonic vibrations in peptides: Amide-I modes in model dipeptide.J. Phys. Chem. B2008,
112, 4790−4800.
10739−10747.
(80) Gorbunov, R. D.; Kosov, D. S.; Stock, G. Ab initio-based exciton model of amide I vibrations in peptides: Definition,conformational dependence, and transferability.J. Chem. Phys.2005,122, 224904.
(81) Carr, J. K.; Zabuga, A. V.; Roy, S.; Rizzo, T. R.; Skinner, J. L. Assessment of amide I spectroscopic maps for a gas-phase peptide using IR-UV double-resonance spectroscopy and density functional theory calculations.J. Chem. Phys.2014,140, 224111.
(82) Woys, A. M.; Almeida, A. M.; Wang, L.; Chiu, C.-C.; McGovern, M.; de Pablo, J. J.; Skinner, J. L.; Gellman, S. H.; Zanni, M. T. Parallel
β-Sheet Vibrational Couplings Revealed by 2D IR Spectroscopy of an Isotopically Labeled Macrocycle: Quantitative Benchmark for the Interpretation of Amyloid and Protein Infrared Spectra.J. Am. Chem. Soc.2012,134, 19118−19128.
(83) Besley, N. A.; Metcalf, K. A. Computation of the amide I band of polypeptides and proteins with a partial Hessian approach.J. Chem. Phys.2007,126, 035101.
(84) Bour, P.; Keiderling, T. A. Partial optimization of molecular̆ geometry in normal coor- dinates and use as a tool for simulation of vibrational spectra.J. Chem. Phys.2002,117, 4126−4131.
(85) DeCamp, M. F.; DeFlores, L.; McCracken, J. M.; Tokmakoff, A.; Kwac, K.; Cho, M. Amide I vibrational dynamics of N-methylacetamide in polar solvents: The role of electrostatic interactions.J. Phys. Chem. B2005,109, 11016−11026.
(86) Eaves, J. D.; Tokmakoff, A.; Geissler, P. L. Electric field fluctuations drive vibrational dephasing in water. J. Phys. Chem. A
2005,109, 9424−9436.
(87) Smith, J. D.; Saykally, R. J.; Geissler, P. L. The effects of dissolved halide anions on hydrogen bonding in liquid water.J. Am. Chem. Soc.2007,129, 13847−13856.
(88) Auer, B. M.; Skinner, J. L. Dynamical effects in line shapes for coupled chromophores: Time-averaging approximation.J. Chem. Phys.
2007,127, 104105.