Xuedi Yang
A Thesis Submitted for the Degree of PhD at the
University of St. Andrews
2010
Full metadata for this item is available in the St Andrews Digital Research Repository
at:
https://research-repository.st-andrews.ac.uk/
Please use this identifier to cite or link to this item: http://hdl.handle.net/10023/979
Cathode Development for Solid Oxide
Electrolysis Cells for High Temperature
Hydrogen Production
A thesis presented for the degree of Doctor of
Philosophy
Xuedi Yang
University of St Andrews
Supervised by Prof. John. T. S. Irvine
I, Xuedi Yang, hereby certify that this thesis, which is approximately 30,000 words in
length, has been written by me, that it is the record of work carried out by me and that
it has not been submitted in any previous application for a higher degree.
I was admitted as a research student in September 2006 and as a candidate for the
degree of Doctor Philosophy in September 2007; the higher study for which this is a
record was carried out in the University of St Andrews between 2006 and 2009.
Date signature of candidate
I hereby certify that the candidate has fulfilled the conditions of the Resolution and
Regulations appropriate for the degree of Doctor of Philosophy in the University of St
Andrews and that the candidate is qualified to submit this thesis in application for that
degree.
Date signature of candidate
In submitting this thesis to the University of St Andrews we understand that we are
giving permission for it to be made available for use in accordance with the
regulations of the University Library for the time being in force, subject to any
copyright vested in the work not being affected thereby. We also understand that the
title and the abstract will be published, and that a copy of the work may be made and
supplied to any bona fide library or research worker, that my thesis will be
electronically accessible for personal or research use unless exempt by award of an
embargo as requested below, and that the library has the right to migrate my thesis
into new electronic forms as required to ensure continued access to the thesis. We
have obtained any third-party copyright permissions that may be required in order to
allow such access and migration, or have requested the appropriate embargo below.
This work is dedicated to my parents, Jing Pan and Hongxian Yang; without your love and support from 5000 miles away, I would never have made it. Thanks for waiting and bearing with me in the past three years.
I would like to express my sincere gratitude to my supervisor, professor John. T. S. Irvine, who gave me opportunity to work with him. He provided me with suggestions, understanding and encouragement when I was far away from home.
My keen appreciation goes to all members of academic and technical staff in JTSI group, University of St Andrews. They gave me help and advice on my work during my study. Special thanks go to Mark Cassidy for his help with screen printing; Sujitra Klinsrisuk for help with gas chromatography; Gael Corre and Cristian Savaniu for help with testing measurements; Julie Nairn for her help with tape casting; Xiangling Yue and Xiaoxiang Xu for their discussion and helpful advice.
Sincere thanks go to my friends in St Andrews, who accompanied and supported me in the past three years when I was studying far away from home. They made my life here more interesting.
This study has been mainly focused on high temperature solid oxide electrolysis
cells (HT-SOECs) for steam electrolysis. The compositions, microstructures and metal
catalysts for SOEC cathodes based on (La0.75Sr0.25)0.95Mn0.5Cr0.5O3 (LSCM) have been
investigated. Hydrogen production amounts from SOECs with LSCM cathodes have
been detected and current-to-hydrogen efficiencies have been calculated. The effect of
humidity on electrochemical performances from SOECs with cathodes based on
LSCM has also been studied.
LSCM has been applied as the main composite in HT-SOEC cathodes in this study.
Cells were measured at temperatures up to 920oC with 3%steam/Ar/4%H2 or
3%steam/Ar supplied to the steam/hydrogen electrode. SOECs with LSCM cathodes
presented better stability and electrochemical performances in both atmospheres
compared to cells with traditional Ni cermet cathodes. By mixing materials with
higher ionic conductivity such as YSZ(Y2O3-stabilized ZrO2) and
CGO(Ce0.9Gd0.1O1.95) into LSCM cathodes, the cell performances have been
improved due to the enlarged triple phase boundary (TPB).
Metal catalysts such as Pd, Fe, Rh, Ni have been impregnated to LSCM/CGO
cathodes in order to improve cell performances. Cells were measured at 900oC using
3%steam/Ar/4%H2 or 3%steam/Ar and AC impedance data and I-V curves were
collected. The addition of metal catalysts has successfully improved electrochemical
performances from cells with LSCM/CGO cathodes.
Improving SOEC microstructures is an alternative to improve cell performances.
Cells with thinner electrolytes and/or better electrode microstructures were fabricated
using technics such as cutting, polishing, tape casting, impregnation, co-pressing and
Hydrogen production amounts under external potentials from SOECs with
LSCM/CGO cathodes were detected by gas chromatograph and current-to-hydrogen
efficiencies were calculated according to the law of conservation of charge.
Current-to-hydrogen efficiencies from these cells at 900oC were up to 80% in
3%steam/Ar and were close to 100% in 3%steam/Ar/4%H2.
The effect of humidity on SOEC performances with LSCM/CGO cathodes has
been studied by testing the cell in cathode atmospheres with different steam contents
(3%, 10%, 20% and 50% steam). There was no large influence on cell performances
when steam content was increased, indicating that steam diffusion to cathode was not
Chapter 1 Introduction
1.1 Hydrogen economy ... 1
1.1.1 Energy history ... 1
1.1.2 The Hydrogen economy ... 2
1.1.3 Hydrogen storage and transportation ... 3
1.1.4 Hydrogen future ... 5
1.2 Hydrogen production... 5
1.2.1 Hydrogen from fossil fuels. ... 5
1.2.2 Hydrogen from biomass. ... 7
1.2.3 Hydrogen from water. ... 7
1.3 High Temperature Solid Oxide Steam Electrolysis cells ... 11
1.3.1 Theory background ... 11
1.3.2 SOEC components ... 18
1.4 Catalysis ... 25
1.4.1 Principle of Catalysis ... 25
1.4.2 Perovskite Catalysts ... 26
1.4.3 Metal catalysts ... 27
Chapter 2 Experimental
2.1 Fabrication of electrolysis cells ... 312.1.1 Cells with 2mm YSZ electrolytes. ... 31
2.1.2 Cells with ~250 micron YSZ electrolytes. ... 34
2.1.3 tape-cast and impregnated cells ... 34
2.1.4 Cells with tape-casted electrolytes and printed electrodes ... 36
2.1.5 Other methods ... 36
2.2 Characterization ... 38
2.2.1 Scanning Electron Microscopy (SEM) ... 38
2.2.2 Energy Dispersive System (EDS) ... 39
2.2.3 X-Ray Diffraction (XRD) ... 40
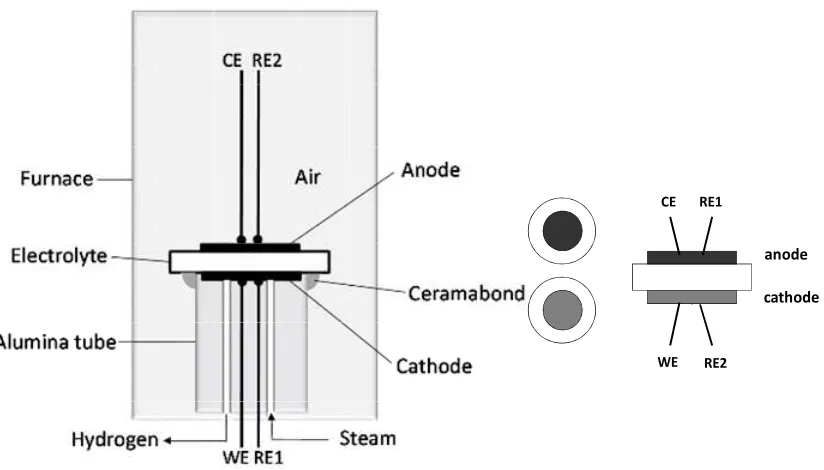
2.3 Electrochemical tests ... 41
2.3.1 Current collector ... 41
2.3.2 Electrochemical tests ... 41
2.4 Gas Components by Gas Chromatography (GC) ... 46
2.5 Calculation of Efficiency. ... 47
for Solid Oxide Electrolysis Cells
3.1 Introduction ... 51
3.2 Ni/YSZ ... 52
3.3 LSCM/CGO ... 55
3.3.1 LSCM/CGO and LSCM ... 55
3.3.2 LSCM/CGO in 3%steam/Ar/4%H2 ... 56
3.3.3 LSCM/CGO in 3%steam/Ar ... 64
3.2 Other cathode composites based on LSCM ... 72
3.3 Conclusions ... 75
Chapter 4 Studies on Catalyst Addition
4.1 Introduction ... 784.2 Cells with various catalysts running with 3%H2O/Ar/4%H2. ... 79
4.3 Cells with various catalysts running with 3%H2O/Ar... 88
4.4 Conclusions ... 97
Chapter 5 Improvements on cell microstructures
5.1 Introduction ... 995.2 Cell performance from cells with 250 micron thick YSZ electrolytes .... 100
5.3 Cell performance from cells with 50 micron thick YSZ electrolytes made by tape casting and wet impregnation ... 104
5.4 Cell with thin YSZ electrolyte by co-pressing ... 115
5.5 Cell with thin electrolyte by screen printing YSZ ink ... 116
5.6 Increase porosity of cathode by adding pore formers ... 117
5.6.1 LSCM + Glassy Carbon ... 117
5.6.2 LSCM + flour and Glassy Carbon ... 117
5.7 Conclusions ... 118
Chapter 6 Hydrogen production from SOECs with cathodes based
on LSCM
6.1 Introduction ... 1206.2 Hydrogen production from cells with LSCM/CGO cathode, 2 mm thick YSZ electrolyte and LSM anode ... 121
6.2.1 3%H2O/Ar ... 121
6.2.2 3%H2O/Ar/4%H2 ... 129
6.4.1 3%H2O/Ar ... 139
6.4.2 3%H2O/Ar/4%H2 ... 144
6.5 Conclusions ... 146
Chapter 7 SOEC performance with different compositions of the gas
supplied to the steam/hydrogen electrode
7.1 Introduction ... 1487.2 Ar/H2 with different humidities ... 149
7.3 Ar with different humidities ... 157
7.4 Cells with catalysts running with different compositions of gas supplied to cathode ... 163
7.4.1 Ar/H2 with different humidities (with catalysts) ... 164
7.4.2 Ar with different humidities (with catalysts) ... 166
1
Chapter 1 Introduction
1.1 Hydrogen economy
Hydrogen is the most abundant element on earth and is considered as a leading fuel
candidate in the future1. However, elemental hydrogen is not in significant amounts
on earth and hydrogen has to be extracted from fossil fuels or renewable energy2,3.
Hydrogen is a flexible energy carrier that can be produced from a variety of energy
resources and used in many sectors of the economy. An energy system based on
hydrogen from renewable resources, if accomplished on a large scale, could improve
energy security, air quality, and greenhouse gas management. Such a system will
require development across a series of technologies for hydrogen production,
transportation, storage, and use4.
1.1.1 Energy history
The trend of energy use is to use fuel with lower carbon to hydrogen ratio (see
Figure 1.1). Initially, mankind burnt wood for heating and lighting. In 1780s, coal
replaced wood to be the prime energy source. In the late 19th century, oil was
introduced and replaced coal for many applications. In the middle of 20th century,
Figure 1.1 Trend in energy use3.
As the combustion of fossil fuels is attributed to be the main cause of the global
climate change and correlated environmental problems, we need a fuel that is clean
which would not cause global warming or people’s health problems5. Hydrogen is
such a kind of energy as it is clean, especially when it is produced from non-fossil
energy.
Apart from causing damages to our environment, using fossil fuels has the
problem of increasing price of crude oil due to the decreasing oil reserves6. Hydrogen
has the potential to be produced from renewable sources which are clean and
sustainable.
1.1.2 The Hydrogen economy
Hydrogen is already widely used as a chemical in industry. Apart from as a
chemical, hydrogen could also be employed as a fuel and a fuel carrier especially if
fuel cells are to be successful. The global market of hydrogen is already greater than
$40 billion per year7.
The basis of hydrogen energy is that hydrogen reacts with oxygen to produce
energy and water (see Equation. 1)8:
H2 + 1/2O2 H2O ∆Ho = -286 kJ/mol at 25 oC; Equation. 1
∆Go = -237.2 kJ/mol at 25 oC.
Hydrogen has a high gravimetric energy density of 122 kJ/g (kilojoule per gram),
which is 2.75 times greater than hydrocarbon fuels9.
Figure 1.2 is a schematic diagram of hydrogen energy system. It is regarded as an
ideal system which could be the solution to the depletion of conventional fuels and
3
H2
water
primary energy sources
electricity generation
transportation
residential industry
[image:12.595.125.480.82.284.2]water
Figure 1.2 A sustainable Hydrogen Economy10.
Utilizing renewable resources, such as solar, wind, tidal, wave and geothermal
sources, is the trend of future energy, which faces the problem of time mismatch of
energy supply and demand in that the electricity production from these sources
depends on variable weather conditions11. Hydrogen produced from excess electricity
can be easily stored and transported, and it could be consumed by fuel cells to supply
electricity later and elsewhere. Hydrogen produced from renewable sources is
regarded to be an environmentally friendly energy and could be a substitute of oil to
feed the increasing demand of energy while we are in the exhaustion situation of oil.
1.1.3 Hydrogen storage and transportation
One of the key issues of hydrogen economy is efficient and affordable
store/distribution of hydrogen produced in large-size central plants or in small-scale
local plants.
1.1.3.1 Gaseous hydrogen
There are three major ways to storage/transport gaseous hydrogen2,12 :
Hydrogen can be transmitted through pipelines similar to those for natural gas.
Hydrogen is compatible with low-carbon steels, polymers, aluminum and brass; new
pipelines or modified natural-gas pipelines can be employed in delivering hydrogen.
Large scale storage. To store hydrogen in bulk is based on the experiences of
natural gas. Depleted gas and oil fields or aquifers could be used for holding natural
gas in huge scale. It depends on the nature of the rock strata.
Gas cylinder. Smaller scaled hydrogen could be stored and transported in
substantial cylinders or tanks at high pressure, which require special compressors.
Industrial users of hydrogen often use cylinders at pressures ranging from 20 MPa to
80 MPa.
1.1.3.2 Liquid hydrogen
Liquid hydrogen (LH2) has a low density of 70.8 kg.m-3 and boils at a very low
temperature (20.6 K)3. The problem of storage is bulk and low temperature. Gaseous
hydrogen is liquefied and held in a cryostat. As hydrogen liquefaction and cryostat are
both costly, liquid hydrogen is mostly used for aircraft rather than road vehicles.
1.1.3.3 Metal hydrides
Some metal alloys absorb hydrogen reversibly to form metal hydrides, which
serves as an alternative way to store hydrogen.
1.1.4 Hydrogen future
Hydrogen serves as a chemical and as a fuel. As a new energy, the introduction of
hydrogen energy will be based on an adequate platform of science, engineering and
economics concerning hydrogen production, purification, storage, distribution and
5
1.2 Hydrogen production
All primary energy sources can be used in the hydrogen producing process13. There
are many ways to produce hydrogen such as from fossil fuels, from biomass, and by
electrochemical means.
Among the several methods of producing hydrogen, reforming fossil fuels, such as
natural gas and oil, is currently the major way of hydrogen production. However,
carbon dioxide is a byproduct from hydrocarbon reforming, and is considered to be
the main cause of the ‘greenhouse effect’. Considering the global environment and
people’s health, the world needs to turn gradually to renewable energy resources.
Hydrogen production without carbon emissions, that is from renewable energy
sources, will be needed in the future.
1.2.1 Hydrogen from fossil fuels
Much of current hydrogen production relies on fossil fuels which occupy above 90%
percent of hydrogen production (see Figure 1.3). And most of the hydrogen produced
is obtained from natural gas, which is mainly made up of methane.
Figure 1.3 Global hydrogen production share by source14.
There are three major ways of producing hydrogen from hydrocarbon fuels: steam
The reactions can be generalized as follows:
Steam reforming .
CnHm + nH2O nCO + (n+m/2)H2
CO + H2O CO2 + H2 Partial oxidation (POX).
2CmHn + mO2 2mCO + nH2
Autothermal reforming.
4CmHn + 2mH2O + mO2 4mCO + 2(m+n)H2
All three methods have large amount of carbon monoxide produced and usually
have one or more water-gas-shift (WGS) reactors in the processes to convert CO to
low level.
Through producing hydrogen from fossil fuel is currently preferred method,
pollutants (CO, CO2, CnHm, SOx, NOx, radioactivity, heavy metals, ashes16) emitted
by fossil energy systems are much more than the emissions that might be produced by
renewable hydrogen system.
1.2.2 Hydrogen from biomass
Biomass is a carbon-containing fuel but is a renewable fuel of energy. It derives
from the carbon dioxide in atmosphere by photo-synthesis. It is available from a wide
range of sources such as agriculture waste, animal waste, municipal waste, and many
more17. There are currently several technologies for hydrogen production from
biomass:
Biological hydrogen production from biomass. Biological hydrogen production
works through dark fermentation or photofermentation. Dark fermentation of biomass
is a microbial processes under anaerobic conditions. Some substrates are oxidized and
some others are reduced. Protons are reduced to molecular hydrogen by electrons
produced in this process. The low yield and the remaining substrates from dark
fermentation were used in a bacterial photosynthetic hydrogen production process.
7
biomass conversion with production of fuels, powder and chemicals. Hydrogen and
methane could be produced in two steps. By producing multiple products, a
biorefinery could take advantage of biomass with different components and maximize
the value from the biomass feedstock.
Chemical conversion of biomass to hydrogen. Hydrogen could also be produced
from biomass in chemical ways, which are similar to coal gasification or steam
reforming. In principle, one molecule of glucose could be steam reformed to produce
12 molecules of hydrogen in the presence of proper catalysts.
1.2.3 Hydrogen from water
Water is a clean and abundant source of hydrogen. Splitting water to produce
hydrogen and oxygen for commercial use dates back to the 1890s15. Breaking water
molecule to hydrogen and oxygen molecules requires energy input as water is very
stable compared to hydrogen and oxygen. There are three major ways to produce
hydrogen from water: electrolysis, thermolysis and photoelectrolysis3,15.
1.2.3.1 Electrolysis
Though water electrolysis is not currently mainstream for hydrogen production,
from a long-term perspective, producing hydrogen by electrolytic water splitting is
viable in that it is simple, reliable, carbon-free and produces high purity hydrogen. It
is historically important and plants have been built in several countries.
Three major methods currently under consideration for electrolytic hydrogen
production are alkaline electrolysis, proton exchange membrane (PEM) electrolysis
and ceramic oxide electrolysis.
Alkaline electrolysis.
An alkaline electrolysis cell usually contains two electrodes, an aqueous alkaline
electrolyte and a microporous ion-conduction separator. The OH- produced at cathode
to form hydrogen gas. The cathode is typically a metal coated with catalysts and the
anode is usually a metal with a layer of oxide coating. For aqueous electrolyte, a ~30
wt% KOH or NaOH solution are commonly employed. The microporous
ion-conducting separator allows the transit of OH- and prevents the mixing of
produced hydrogen and oxygen. Efficiencies of alkaline water electrolysis could reach
70%13.
The electrolysis process is driven by the application of an external potential. During
the process, a reduction reaction takes place at the negative electrode (cathode) and an
oxidation reaction occurs at the positive electrode (anode) (see Figure 1.4).
Figure 1.4 Alkaline electrolysis process2,3.
The electrode reactions of alkaline electrolysis are as follows2,15:
At anode: 4H2O + 4e- 2H2 + 4OH- At cathode: 4OH- 2H2O + 4e-+ O2
Overall reaction: H2O H2 + 1/2O2 ∆H = -288 kJ.mol-1
Proton exchange membrane (PEM) electrolyzer.15,18,19.
A PEM electrolyzer typically involves a Nafion membrane which is
proton-conducting and could separate hydrogen and oxygen at two electrodes. Water
is split into protons and oxygen at the anode and the protons produced are transported
to the cathode side via the Nafion membrane. The protons at cathode combine with
9
55–70%15. Reactions are as follows:
At anode: 2H2O O2 + 4H+ At cathode: 4H+ + 4e- 2H2 Overall reaction: 2H2O O2 + 2H2
Solid oxide electrolysis cells.
Solid oxide electrolysis cells (SOECs) are expected to provide the highest
efficiency of electrolytic hydrogen production20. What is more, high temperature
SOECs have a potential to be combined with high-temperature nuclear reactors to
utilize the nuclear heat generated. The solid oxide cells operate at temperatures
ranging from 750-1000oC21.
The process of solid-oxide high temperature electrolysis of steam is the reverse
reaction of the solid oxide fuel cell. Because the device is all solid state, it has a
longer lifetime by avoiding the corrosion and evaporation caused by liquid electrolyte.
And as the cell works at high temperature(800oC-1000oC), it needs lower ∆G and is
not necessary to use expensive noble metals as its electrodes. In addition, the heat
discharged by a system could also be utilized. The electrical efficiencies of solid oxide
electrolyzers can be 85–90%15.
The details of solid oxide electrolysis cells will be explained in detail in section 1.3.
1.2.3.2 Thermochemical hydrogen production
Water will decompose at 2500oC, but heat sources and stable materials at this
temperature are not easily feasible15. Therefore, some methods to lower the
temperatures have been developed. However, most of the proposals that reduced the
temperature significantly require higher pressures and aggressive chemical systems.
There are some main processes15:
Ispra Mark-10
2NH4 + 2NH3 H2 + I2 T = 630oC
Sulfuric acid decomposition:
SO2 + H2O H2O + SO2 + 1/2O2 2H2O + Br2 + SO2 H2SO4 + 2HBr 2HBr Br2 + H2
2H2O + I2 + SO2 I2 + H2
ZnO/Zn:
ZnO Zn + 1/2O2 T = 1800oC Zn + H2O ZnO(s) + H2 T = 475oC
The overall efficiencies could reach 50% for these thermochemical processes22. But
they are still not competitive compared to other hydrogen production technologies.
1.2.3.3 Water splitting with solar energy
There are three types of water splitting with solar energy: solar cell driving
electrolysis, semiconductor photoelectrode and photoelectrolysis. Photoelectrolysis
uses solar energy to directly split water to hydrogen and oxygen. The device converts
solar energy to electricity via photovoltaic(PV) cells. Semiconductor materials are
employed as photoanode and photocathode (commonly a p-n junction). The two
photoelectrodes immersed in an aqueous electrolyte absorb solar energy and
dissociate water. The target solar energy to hydrogen efficiency is >16%3,15.
1.2.3.4 Conclusion
Electrolytic hydrogen is a very clean fuel, which is free from carbon and sulfur
impurities. The high purity is an important necessity for proton-exchange membrane
11
fuels. But from a long-term perspective, producing hydrogen by water splitting is
viable in that it is simple, reliable, carbon-free and produces high purity hydrogen.
1.3 High Temperature Solid Oxide Steam Electrolysis cells
1.3.1 Theory background
1.3.1.1 Solid oxide steam electrolysis principles
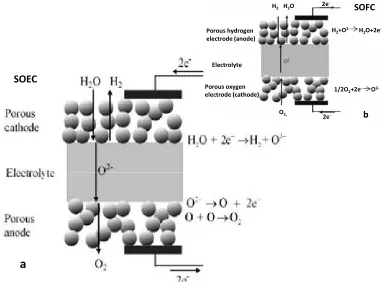
The principle of a solid oxide oxide electrolysis cell is illustrated in Figure 1.5.
Solid oxide electrolysis reactions are reverse reactions of SOFC. When the SOFC
runs backwards it works as a SOEC.
SOEC
a
Porous hydrogen electrode (anode)
Electrolyte
Porous oxygen electrode (cathode)
H2O
H2
2e
-O2,
2e
-H2+O2- H2O+2e
-1/2O2+2e- O
2-SOFC
[image:20.595.105.487.343.625.2]b
Figure 1.5 a. Process of Hydrogen production by a Solid Oxide Steam Electrolysis (SOSE) 23; b. Process of a solid oxide fuel cell.
The chemical reactions in an solid oxide electrolysis cell are:
Overall H2O (gas, cathode) H2 (gas, cathode) + 1/2O2 (gas, anode) Using external electricity, the H2O molecule splits to H+ and O2-, and H+ combines
with e- to form H2. The oxygen ions produced are transported through the electrolyte,
which is an oxygen ionic conductor. At the anode, the O2- transfers its charge to the
anode, and combines with another O2- to form O2.
1.3.1.2 Energy Equation
The reaction can be expressed by:
H2O(g) H2(g) + 1/2O2(g) The equation of energy change is:
∆H = ∆G + T∆S
Where T is absolute temperature; ∆H is enthalpy change; ∆S is entropy change; and
∆G is the Gibb’s Free Energy, the maximum work for formation of water, or
[image:21.595.189.404.436.680.2]specifically the minimum work to split water. This energy equation can be seen in
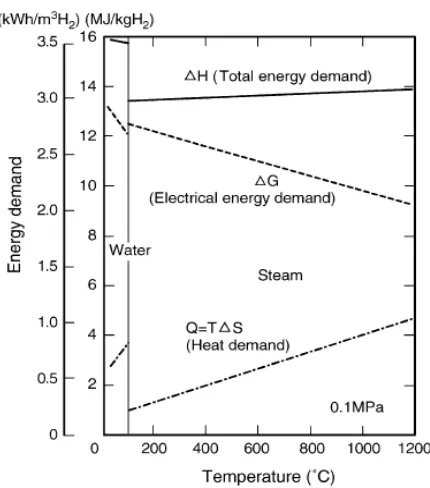
Figure 1.6.
Figure 1.6 Energy demand for water and steam electrolysis24.
13
temperature. In the gas phase, with temperature increasing, thermal energy (T∆S)
provides a larger portion of the total energy demand (∆H) and the electrical energy
demand (∆G) decreases. The decrease of electrical energy demand leads to higher
electrical efficiency. High operating temperature also generally improves electrode
reaction kinetics25,26.
The total energy required for splitting water is given by13:
H2O H2 + 1/2O2
∆Ho = 285.8 kJ/mol at 25oC;
The Gibbs free energy may also be impressed by
∆G = -zEF = -2EF.
z is the number of electrons involved in reaction; E is the reversible voltage of the
cell (at equilibrium when the current is zero; also known as ‘open circuit voltage’); F
is the Faraday constant (charge on one mole electrons, F=96485 coulombs).
1.3.1.3 Nernst Equations and OCV
From the energy equation,
for
H2O(g)→H2(g)+ 1/2O2(g),
there is
∆G = -zEF = -2EF,
which can also be expressed by
2 o O H o O 2 o H o 2 1 o O o H o O H o ) P (P ) P (P ) P (P ln 4F RT + E = ) P )(P P (P ) P (P ln 2F RT -2F ∆G = 2F ∆G = E 2 2 2 2 2 2 / / / / / /
Such equations, which give a potential in terms of product and reactant activity or
partial pressure are known as Nernst Equations. The Nernst potential E, which is also
known as the open circuit potential (OCV), is the voltage difference between the
pressure in the cathode gas. PH2 and PH2O are respectively the partial pressures of
hydrogen and steam in the anode gas. R is the gas constant, which equals 8.314 J K-1
mol-1 if pressure is in kiloPascals(kPa), volume is in litres(L), temperature is in
Kelvin(K). T is the absolute temperature.
Over the temperature range between 500oC to 1500oC, E° for this reaction can be
written as27:
273) -0.000292(T
-1.29 = 2F
∆G° = E°
1.3.1.4 Polarisation
From the Nernst Equations we know that if the partial pressures of different species
PH2, PO2, PH2O are fixed regardless of the local current density, the Nernst potential, E,
is not a function of current density. This assumption is only valid when the flow rate
of each species is high enough that the gas components at anode and cathode are
actually fixed. If it is not the case, E is a function of current density.
activation polarization
cell voltage
concentration polarization
polarization losses
ohmic losses ocv
Current density
V
o
lt
a
ge
Figure 1.7 Schematic plot of voltage versus current density showing different types of polarizations.
With no potential load, the cell is reversible and works at OCV. With an applied
15
polarization or overpotential. The different polarization are termed: ohmic
polarization, concentration polarization and activation polarization.
η = ηohm + ηconc + ηact
Where η is the total cell polarization, ηohm are the ohmic polarization, ηconc is the
concentration polarization, ηact is the activation polarization (see Figure 1.7).
Activation polarisation is usually dominant at low current densities, while
concentration polarization is usually dominant at high current densities when the
transport of reactive species to the electrolyte/electrode interface becomes a limiting
factor for the cell reaction.
(1) ηohm
All materials (except superconductors) have a resistance to the movement of
electrical charge. The linear relationship between voltage drop and current density is a
material property which can be described by resistivity. The ohmic losses, also called
resistance polarization, are electrical resistance of the electrical contacts,
interconnections, lead wires, and electrodes, as well as the ionic resistance of the
electrolyte. The ohmic polarization at a given current density can be expressed by:
ηohm = (ρele + ρala + ρclc + Rcontact) i
Where ηohm is the ohmic polarization, ρe ,ρa and ρc are the resistivities of electrolyte,
anode and cathode, le, la and lc are the thicknesses of electrolyte, anode and cathode.
Rcontact refers to any contact resistance. i is the current density.
The ohmic polarization shows a linear response and expressed by:
ηohm = ir
Where i is the cell current density; r is the area resistance of the cell21,28.
The ohmic resistance of electrolyte corresponds to the transportation of oxide ions
through YSZ electrolyte; ohmic resistances of electrodes are correlated with the
transportation of electrons through electrodes. Other components generally have much
higher conductivity than the electrolyte. Therefore, the ohmic losses can be roughly
(2) ηconc
The reactants and products are all gaseous. As the reactions occur at a three-phase
boundary (TPB), the reaction species need to be transported from the surfaces of
electrodes to the electrode/electrolyte surfaces and the products need to leave.
Cathode processess involve diffusion, adsorption, chemical reaction, surface diffusion,
and desorption. One possible scheme is that steam is dissociated to O2- and H+ at
cathode/electrolyte interface where the produced O2- could be transported through
YSZ electrolyte to the anode side to form oxygen gas. It is also possible that some
intermediates are produced at gas/cathode boundary during water splitting and diffuse
to the cathode/electrolyte surface for further reactions. H+ remaining at cathode
combines with electrons to form hydrogen. The produced hydrogen and oxygen gases
must be transported away from the cathode/electrolyte and anode/electrolyte
interfaces respectively. The concentration polarization is caused by the resistance to
the transport of reactant and product species. The concentration polarization is
affected by the diffusivities of gases, the porous electrode microstructure, the partial
pressures of species.
ηconc = f ( Diffusivity, Microstructure, Partial Pressures, Current Density)
The concentration polarizations can be generally expressed by:
) i
i -ln(1 zF RT =
η
l conc
Where il is the limiting current density at which the steam is used up at a rate equal
to its maximum supply speed and is a function of the diffusivity of the gas and the
partial pressure. It is non-linear to current21,28,29.
(3) ηact
The activation polarization is related to the electrode kinetics at the reaction site. It
represents the overpotential due to the activation necessary for charge transfer28. It is
highly dependent on the charge transfer mechanism and electrocatalysis at the three
phase boundaries.
17
microstructure, temperature, atmosphere and current density.
ηact = f (materia1 properties, microstructure, temperature, atmosphere, current
density)
A relation between activation polarization and current density is given by
Butler-Volmer equation. When the current density is high, the Butler-Volmer
equation can be written as:
≈
ηcact ln
βzF
RT
ln
βzF
RT
-ico i ≈ a+blni
This equation is also known as Tafel equation. where io is the exchange current
density, which can be affected by several factors:
io = f (TPB, partial pressure of oxygen in the atmosphere, oxygen vacancy
concentration in the electrolyte, oxygen vacancy mobility in the electrolyte, electron
concentration in the electrocatalyst, and temperature)29.
1.3.1.5 SOEC Advantages and disadvantages
Comparing with other methods of producing hydrogen in section 1.2, the high
temperature solid oxide electrolysis has advantages:
High efficiency
Carbon free
Produce high purity hydrogen
Small-scale and responsive
Potential to utilize solar concentrator and geothermal heat and nuclear heat
generated by nuclear reactors
All solid state device, long lifetime
However, it has some drawbacks that need to be overcome:
High operating temperature
Fragile ceramic components30
1.3.2 SOEC components
1.3.2.1 Electrolyte
The electrolyte of an SOEC serves as an ionic transporter between two electrodes.
As the electrolyte is solid state, the cell may be cast into different shapes such as
tubular and planar. The electrolyte material for high temperature SOECs must be
stable in both oxidizing and reducing environments at high temperatures. It also
required to possess high ionic conductivity and low electronic conductivity at
operating temperatures. Moreover, it needs to be able to be made into thin but strong
and nonporous films. Nowadays, Y2O3-stabilized ZrO2, with a fluorite structure, is the
most favoured material for SOEC electrolyte as it exhibits good thermal and chemical
stability, high oxide-ionic conductivity, and mechanical strength at high
temperature29,30,33.
The fluorite structure is a face centered cubic arrangement of cations with a cubic
arrangement of anions in the center31 (see Figure 1.8). At high temperatures, the
zirconia (ZrO2) has a cubic fluorite structure which could be stabilized to lower
temperatures by substitute Zr4+ with divalent or trivalent larger cations such as Ca or
Y. Doping lower valence cations could also introduce defects. When Zr4+ are
substituted by lower valence cations, the concentration of oxygen ions would decrease
to maintain electroneutrality. Thus, oxygen vacancies and therefore oxide-ionic
conductivity are introduced. Sufficient dopants are required for stabilizing the cubic
19
Cation
Anion
Figure 1. 8 The cubic fluorite structure31.
The dissolution of yttria into the fluorite phase of ZrO2 can be expressed by:
o .. x o 2
3
2O (ZrO ) 2Y'zr+3O +V
Y →
Each Y2O3 creates one oxygen vacancy.
1.3.2.2 Anode
Reaction at anode:
O2- 1/2O2 (g) + 2e-.
The most important properties that high temperature SOEC anode needs to possess
are: electronic conductivity, catalytic activity for anodic reaction, and compatibility
with electrolyte material. Noble metals such as platinum could be used as the anode
material but is not practical in cost-effective commercial cells due to its high cost.
Some metal oxides have the required properties for SOEC anode but are much less
expensive.
Strontium-doped lanthanum manganite (LSM), which shows a good performance in
SOFC as a cathode when YSZ is used as an electrolyte32,34, is a commonly favorable
material for SOEC anodes. Pure LaMnO3 shows orthorhombic structure or
Sr2+ and Ca2+, the amount of Mn4+ increases and therefore the oxygen content
increases. And the transformation temperature is eventually reduced. Sr doped
LaMnO3 ((La1-xSrx)MnO3) shows cubic perovskite structure at high temperatures.
The LaMnO3 based perovskites have electrical conductivity of above 10 S.cm-1 at
700oC29. The electrical conductivity originates from the valence change of Mn. Mn4+
content is increased when the LaMnO3 is doped with lower valence cations such as
Sr2+, thus the electrical conductivity is enhanced.
3 + 4 x +
3 x -1 +
2 x + 3
x -1 3 x
x
-1 Sr )MnO ~La +Sr +Mn +Mn +O
(La
Another interesting property of LaMnO3 based perovskite structure is its
nonstoichiometry of oxygen and therefore the oxygen vacancies29,35. Figure 1.9 shows
the oxygen defect and excess regions of LaMnO3. Oxygen-excess shows up at high
oxygen partial pressure, and oxygen-defect (which would supply oxygen vacancies) is
exhibited when oxygen partial pressure is low.
Oxygen deficient
Oxygen excess Oxygen content Saturation of I
II III
IV
3
Log p(O2)
Figure 1.9 . Schematic representation of oxygen nonstoichiometry of LaMnO3±d
as a function of oxygen partial pressure29.
1.3.2.3 Cathode
Reaction at cathode:
2-21
For cathode of high temperature SOECs, the material should have catalytic activity
for water splitting which is necessary for the kinetics of the reaction. Besides, the
cathode is required to have ionic conductivity which allows the transportation of
oxygen ions to the anode/electrolyte border. In addition, the cathode material has to
be electrical conductivity in order to convey the electrons produced at cathode to the
outside circuit.
One of the possible reaction schemes at cathode could be:
1. Adsorption of H2O molecule to the surface of cathode, which is also the
electrocatalyst.
H2O(gas) H2O(cathode)
2. Surface diffusion of adsorbed H2O to the three phase boundary (TPB)
H2O(cathode) H2O(TPB)
3. Electrochemical reaction at TPB
te) (elextroly O
+ (TPB) H
→ →→ →
te) (electroly V
+ (cathode)
-2e + O(TPB)
H2 O•• 2 xo
Reactions take place at the three phase boundary (TPB) where the electrolyte,
electrocatalyst and gas reactants meet. Water is fed into porous cathode side and
dissociated into H+ and O2- at the three phase boundary where electrocatalyst is
available. Oxygen ions produced are transported across YSZ electrolyte to anode side
via the oxygen vacancies in electrolyte. Hydrogen ions remaining at cathode side
combine with electrons supplied by electronic conducting cathode to form hydrogen
O
2-e
-YSZ
LSCM(cathode)
H
2O + 2e
-H
2
+ O
2-e
-Figure 1.10 Schematic cathode reactions at three phase boundary in a SOEC with YSZ electrolyte and LSCM cahtode. The reactive sites are the contact zones
of the two conducting phases which are accessible to gases through the pores.
Reactions in SOECs are the reverse reactions in SOFCs. If a SOFC runs backwards,
it works as a SOEC. In high temperature SOFCs, several materials have attracted
attention as anode materials. Platinum, as some other noble metals, which is stable at
high temperatures and has high catalytic activity on electrode processes as well as
electronic conductivity36, is expensive and may bond with the electrolyte29. Nickel
metal is high in catalytic activity and low in cost, but it has evidently thermal
mismatch to Stabilized Zirconia37. A cermet which has the nickel catalytic activity
and proper thermal match with the ceramic, is produced by mixing nickel metal with a
ceramic support. Nickel cermet, a porous composite of Ni and YSZ, is the currently
favoured cathode material for SOEC cathode. The perovskite
(La0.75Sr0.25)0.95Mn0.5Cr0.5O3 (LSCM) is an active and redox-stable material and has
attracted a lot of attention in the high temperature solid oxide fuel cell field38-41.
And the anode materials of SOFCs could be the candidates for cathode materials
for SOECs. Platinum is not a cost-effective SOEC cathode material due to its high
price. Ni/YSZ cermet is currently preferred cathode material for high temperature
solid oxide electrolysis system due to its excellent catalytic properties and good
23
tolerance to oxidizing condition and reduction of TPB due to agglomeration after long
operation and poor redox cycling causing volume instability41. It requires a significant
concentration of H2 flowing over it, if it is not to be oxidized to NiO. Lack of reducing
atmosphere would not only cause a loss of electronic conductivity but is also likely to
lead to mechanical failure of the electrode42. LSCM has attracted much attention as an
SOFC anode material or as anode/cathode material for a symmetrical SOFCs43,44,45.
Nevertheless, LSCM has not been reported as a possible cathode for high temperature
solid oxide steam electrolysis cells, which work with high temperature steam and
under external potential load.
LSCM.
Perovskite-related material, (La0.75Sr0.25)0.95Mn0.5Cr0.5O3 (LSCM), has been
reported for its remarkable stability with reduction or oxidation occurring at high
temperature, say 900oC44. The A-site deficiency in (La0.75Sr0.25)0.95Mn0.5Cr0.5O3 has
been questioned65. It also shows chemical compatibility with yttria-stabilized zirconia
to at least 1300°C41. It has been reported to be able to work effectively for both
cathode and anode operation in a symmetrical reversible SOFC44. This character
enables LSCM to work as a cathode material in an high temperature solid oxide steam
electrolysis cell.
Introduction of alkaline earth and first series transition metal elements into LaCrO3
has been shown to improve promote the catalytic properties for methane reforming46.
The electrochemical properties and electrochemical performance of LSCM catalyst in
SOFC have been reported41,47. Some other substitutions such as Fe at B-site are more
commonly used for steam reforming.
In general, a minimum electronic conductivity of 1 S/cm is required to minimize
the ohmic loss. The transitions of Mn3+ to Mn4+ and Cr3+ to Cr4+ provides high
conductivity.
X O •
Mn X
Mn •
• O
2 +V +2Mn =2Mn +O
O 2 1
• Mn
partial pressure, and therefore the conductivity. Figure 1.11 shows the conductivity of
LSCM versus oxygen partial pressure. When PO2 is in the range of 10-8~10-16 atm,
conductivity of LSCM increases with oxygen partial pressure increase. When PO2 >
10-8, the conductivity changes little. In reducing atmosphere, LSCM conductivity will
be lowered. At 900°C, its total conductivities are about 38.6 S/cm in air and 1.49
S/cm in 5% H2 (pO2 ~ 10-21atm)41.
Figure 1.11 Log(σ) vs. log(pO2) for La1-xSrxCr0.5Mn0.5O3±δ64.
1.3.2.4 SOEC designs
Research on high temperature solid oxide electrolysis for hydrogen production has
been carried on in several groups in the world. For most of the work, cells were made
with LSM anode, YSZ electrolyte and Ni/YSZ cermet cathode48-50. Proton conducting
ceramic has been used as an electrolyte at lower temperatures in some groups51,52.
Stacks have been developed in a number of groups such as the Idaho National
Laboratory in the US and the Risø DTU in Denmark. Some of the water electrolysis
were carried out by coelectrolysis of steam and carbon dioxide to produce syngas (H2
+ CO)53-55. And some are the electrolysis only of water42,56-58.
25
LSM
LSF
Ionic conductor (YSZ)
Proton conductor
Ni/YSZ
Noble metal
LSCM
Planar
Tubular
Stake
Coelectrolysis
Steam electrolysis
1.4 Catalysis
1.4.1 Principle of Catalysis
Catalyst is a chemical substance by which the rate of the reaction is increased or
decreased. Catalyst may participate in multiple chemical processes but is not
consumed by the reaction itself. Positive catalyst works by providing a different
transition state with lower activation energy (see Figure 1.12). The overall
thermodynamics and the final results are not changed by catalysts.
E
n
e
rg
y
X,Y
Z
Reaction Progress
E3(no catalyst)
E3(with catalyst)
ΔG
Figure 1.12 Principle energy diagram of catalysis.
Reagents are adsorbed on the surface of solid catalyst before catalysis process takes
place. Reactions happen on the exterior surface of the solid catalyst. The diffusion and
adsorption of reactants onto the surface is a necessity for the chemical reactions on the
surface which are followed by the desorption and diffusion of products from the
Chemical reaction
Desorption Adsorption
Diffusion to surface Diffusion from surface
Surface
Figure 1.12 Schematic steps of a catalysis process on surface59,63.
1.4.2 Perovskite Catalysts
Oxides play an important role in catalysis. In SOEC, they can work as active
components themselves and as supports for active materials60. It has been reported
that materials with mixed electronic and ionic conductivity could accelerate the
methane oxidation46.
A
O
B
Figure 1.13 ABO3 perovskite structure61.
Perovskites (ABO3), containing Am+ and Bn+ cations, is a structure has potential to
be partially substituted with a wide range of ions at both A and B sites60. The
substitution of ABO3 with alkali earth elements on the A sites and transition metal
elements on the B sites allows modification of electronic and catalytic behaviors62.
27
oxidation reactions62.
1.4.3 Metal catalysts
Metals have been widely used in catalysis. Ni, Pt, Pd and Rh are the most
frequently used in heterogeneous catalysis60. Metal catalysts such as iron and
ruthenium are used for synthesis of ammonia, palladium for hydrogenation and
hydrogenolysis, platinum for hydrocracking of oil, and nickel for partial saturation of
oils59.
Catalytic reactions happen at catalyst surfaces. Electronic structures of metal atoms
on surfaces affect the interaction between catalyst and reactants. The unsaturated
coordination of metal atoms on catalyst surfaces allows available d orbits to accept
electrons. Metal catalysts are usually transition metals rather than alkali earth metals
or alkali metals.
References
1. V. Utgikar, and T. Thiesen, Int. J. Hydrogen Energy, 2006, 31, 939.
2. R. M. Dell, D. A. J. Rand, Clean energy, Cambridge : Royal Society of Chemistry, 2004.
3. R. M. Dell, D. A. J. Rand, Hydrogen energy : challenges and prospects, Cambridge :
Royal Society of Chemistry, 2008.
4. The National Academies, The Hydrogen Economy Opportunities, Costs, Barriers and R &
D Needs, The National Academies Press, Washington, D.C., 2004.
5. D. J. Wuebbles and K. J. Atul, Fuel Process. Technol., 2001, 71, 99.
6. B. Wang, W. Wan, and J. Wang, Bioresour. Technol., 2009, 100, 1211.
7. GE Global Research's Hydrogen Electrolyzer Receives Popular Mechanics 2006 Breakthrough Award, 5 Oct 2006.
8. Hydrogen, from Wikipedia, http://en.wikipedia.org/wiki/Hydrogen, 2009.
9. I. K. Kapdan, F. Kargi, Enzyme Microb. Technol., 2006, 38, 569.
10. M. Momirlan, T.N. Veziroglu, Renew. Sustain. Energy. Rev., 2002, 6, 141.
12. Hydrogen Storage, from Wikipedia, http://en.wikipedia.org/wiki/Hydrogen_storage,
2009.
13. M. Balat, Int. J. Hydrogen Energy, 2008, 33, 4013.
14. R. Kothari et al., Renew. Sustain. Energy. Rev., 2008, 12, 553.
15. J.D. Holladay et al., Catal. Today, 2009, 139, 244.
16. M. Momirlan, T. N. Veziroglu, Renew. Sustain. Energy. Rev., 1999, 3, 219.
17. P. Westermann et al., Int. J. Hydrogen Energy, 2007, 32, 4135.
18. National Academy of Science, The Hydrogen Economy: Opportunities, Costs, Barriers,
and R&D Needs, National Academies Press, Washington, DC, 2004.
19. J.D. Holladay, J. Hu, D.L. King, Y. Wang, Catal. Today, 2009, 139, 244.
20. H. Uchida, N. Osada, and M. Watanabe, Electrochem. Solid-State Lett., 2004, 7, A500.
21. K. L. Eccleston, PhD thesis, St Andrews, 2006.
22. J.E. Funk, Int. J. Hydrogen Energy, 2001, 26, 185.
23. M. Ni, M. K. H. Leung, and D. Y. C. Leung, Chem. Eng. Technol., 2006, 5, 29.
24. R. Hino, K. Haga, H. Aita, and K. Sekita, Nucl. Eng. Des., 2004, 233, 363.
25. A. Momma, T. Kato, Y. Kaga, and S. Nagata, J. Ceram. Soc. Jpn., 1997, 105, 398.
26. K. Eguchi, T. Hatagishi, and H. Arai, Solid State Ionics, 1996, 86-88: 1245.
27. M. V. Perfiliev, Int. J. Hydrogen Energy, 1994, 19, 227.
28. J. R. Ferguson, J. M. Fiard, R. Herbin, J. Power Sources, 1996, 58, 109.
29. S. C. Singhal and K. Kendall, High Temperature Solid Oxide Fuel Cells (Fundamentals,
Design and Applications), Elsevier Ltd, 2003.
30. U.S. Department of Energy, Fuel Cell Handbook(Seventh Edition), by EG&G Technical
Services, Inc., 2004.
31. J. B. Goodenough, Annu. Rev. Mater. Res., 2003, 33, 91.
32. M. Juhl, S. Primdahl, C. Manon, and M. Mogensen, J. Power Sources, 1996, 61, 173.
33. S. Srinivasan, Fuel Cells - From Fundamentals to Applications, Springer Science &
Business Media, LLC, 2006.
34. S. P. Jiang, J. Mater. Sci., 2008, 43, 6799.
35. F. W. Poulsen, Solid State Ionics, 2000, 129, 145.
29
37. S. Primdahl, B. F. Sørensen, and M. Mogensen, J. Am. Ceram. Soc., 2000, 83, 489.
38. Electrochemical Measuring Method (in Chinese). Beijing, Peking U. Press, 1995.
39. A.G. King,Ceramic Technology and Processing. New York: William Andrews Publishing,
2002.
40. Print Process Descriptions: Printing Industry Overview: Screen Printing,
http://www.pneac.org/printprocesses/screen/, 2009.
41. S. W. Tao and T. S. I. John, J. Electrochem. Soc., 2004, 151, A252.
42. X. D. Yang and J. T. S. Irvine, J. Mater. Chem., 2008, 18, 2349.
43. S. W. Tao and J. T. S. Irvine, Nat. Mater., 2003, 2, 320.
44. D. M. Bastidas, S. W. Tao, and J. T. S. Irvine, J. Mater. Chem., 2006, 16, 1603.
45. S. P. Jiang, X. J. Chen, S. H. Chan, J. T. Kwok, K. A. Khor, Solid State Ionics, 2006, 177,
149.
46. J. Sfeir, R. Vasquez, J. V. Herle and K. R. Thampi, J. Catal., 2001, 202, 229.
47. S. W. Tao, J. T. S. Irvine, and J. A. Kilner, Adv. Mater., 2005, 17, 1734.
48. A. Hauch, S. D. Ebbesen, S. H. Jensen and M. Mogensen, J. Mater. Chem., 2008, 18,
2331.
49. C. M. Stoots, J. E. O’Brien, J. S. Herring, K. G. Condie, and J. J. Hartvigsen,
Proceedings of the 4th International Topical Meeting on High Temperature Reactor Technology, Washington, DC USA, September 28-October 1, 2003.
50. J. S. Herring, J. E. O’Briena, C. M. Stootsa, G. L. Hawkesa, J. J. Hartvigsen, and M.
Shahnam, Int. J. Hydrogen Energy, 2007, 32, 440.
51. H. Matsumoto, M. Okubo, S. Hamajima, K. Katahira and H. Iwahara, Solid State Ionics,
2002, 152-153, 715.
52. T. Sakai, S. Matsushita, H. Matsumoto, S. Okada, S. Hashimoto, T. Ishihara, Int. J.
Hydrogen Energy, 2009, 34, 56.
53. S. H. Jensen, P. H. Larsen, and M. Mogensen, Int. J. Hydrogen Energy, 2007, 32, 3253.
54. Z. Zhan, W. Kobsiriphat, J. R. Wilson, M. Pallai, I. Kim, and S. A. Barnett, Energ. Fuel.,
2009, 23, 3089.
55. J. B. Goodenough, Rep. Prog. Phys., 2004, 67, 1915.
57. A. Hauch, S. H. Jensen, S. Ramousse, and M. Mogensena, J. Electrochem. Soc., 2006, 153,
A1741.
58. S. Herring et al.., 2005 DOE Hydrogen, Fuel Cells & Infrastructure Technologies
Program Review, 2005.
59. J. M. Thomas and W. J. Thomas, Principles and practice of Heterogeneous Catalysis,
Wiley-VCH, 1997.
60. G. Ertl, H. Knozinger, F. Schuth, and J. Weitkamp, Handbook of Heterogeneous
Catalysis, Wiley-VCH, 2008.
61. J. B. Goodenough, Rep. Prog. Phys., 2004, 67, 1915.
62. E. S. Raj, J. A. Kilner, and J. T.S. Irvine, Solid State Ionics, 2006, 177, 1747.
63. Hermenegildo de A.L.Viana, PhD thesis, St Andrews, 2007.
64. S. M. Plint, P. A. Connor, S. Tao, and J. T.S. Irvine, Solid State Ionics, 2006, 177, 2005.
31
Chapter 2 Experimental
2.1 Fabrication of electrolysis cells
Electrolysis cells with different cathodes were fabricated in different ways. Typical
solid oxide electrolysis cells (SOECs) with 2mm thick YSZ electrolyte were
fabricated for initial tests. Thereafter, several ways have been tried to decrease
electrolyte thicknesses and to improve electrode microstructure to enhance cell
performances.
2.1.1 Cells with 2mm YSZ electrolytes
Cathode
LSM+YSZ(1:1)
LSM Anode
Electrolyte YSZ
Figure 2.1. a. Structure of a SOEC with 2mm YSZ electrolyte; b. photo of a SOEC with 2mm pressed YSZ electrolyte.
2.1.1.1 Electrolyte preparation
Approximately 3.7g 8% commercial YSZ (P1-kem) powder was uniaxially pressed
at a pressure of approximately 1.5 tons/cm2, using 2.5mm discs in stainless steel pellet
dies to form pellets. The mass of powder was weighed on an electronic balance. The
powder was then grounded using a pestle and put in the die. A small depression in the
centre of the powder was formed using a stainless steel column before pressing in
order to avoid uneven compaction due to the friction between the powder and the die
walls. Uneven compaction can lead to cracks and inner fracture in the sintered pellet.
The pellets pressed were placed on an alumina plate and then sintered at 1500oC for
2.1.1.2 Electrode preparation
The electrode is made by firing electrode ink which is applied on YSZ electrolyte.
Commercial LSM and CGO powders from Praxair company and LSCM powder from
EMPA company were used in electrodes.
Ink preparation.
Ball milling is a method that can be used to grind chemicals to a finer consistency.
It is often useful to grind chemicals in order to increase their surface area and make
mixtures more homogenous2.
An exact mass of electrode materials was weighed out (total mass of materials was
10 grams) with 0.2 gram of polyester/polyamide copolymer KD-I dispersant, which
helps to enhance the consistency of the ink. The mixed powder was put in a plastic
bottle with fixed number of ceramic balls. Acetone was then added to the bottle until
just covering the balls. The bottle was put on a roller ball milling machine for a fixed
period of time at 28 volt to mill the powder.
The mixture was then poured into a 250ml beaker with 5.4g medium (Johnson
Matthey Direct Screen Medium Batch P05AP24). Acetone was added to about 1/3
volume of the beaker and then the mixture was stirred on a electromagnetic plate for
about 3 days to evaporate acetone to form ink.
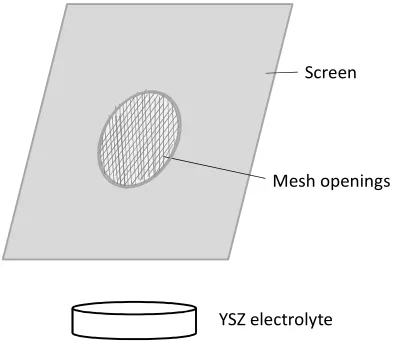
Screen printing.
Screen printing consists of three elements: the screen which is the image carrier, the
blade, and ink. The screen printing process uses a porous mesh stretched tightly over a
frame made of metal. Proper pressure is essential for accurate ink registration. The
mesh is made of porous fabric. A stencil is produced on the screen, defining the image
to be printed3.
Electrode ink was applied to the substrate by placing the screen over the pellet. Ink
with a paint-like consistency was placed onto the top of the screen. The ink was then
forced through the fine mesh openings using a blade that was drawn across the screen,
applying tension to force the ink through the open areas of the screen. Ink will pass
33
pellet. The diameter of the threads and the thread count of the mesh will determine
how much ink was deposited onto the substrates (see figure 2.2).
The screen printing process was repeated several times on each electrode for
enough electrode thicknesses. The printed electrodes were dried in 90oC for about 20
minutes before next printing. The samples should be kept away from dust during the
whole process. For LSM anode, two layers of LSM/YSZ (50% LSM by weight) ink
were printed next to the YSZ pellet, and one layer of pure LSM ink was then printed.
For cathode, generally three layers of ink were screen printed.
YSZ electrolyte Mesh openings
[image:42.595.199.396.282.453.2]Screen
Figure 2.2. Schematic of screen printing.
Sintering electrodes.
The screen printed electrodes are sintered in order to combine together and to
adhere to electrolyte. The electrode with higher sintering temperature was calcined
first. In the electrode sintering process, the increasing rate was 2oC per minute for
temperatures from 50oC to 500oC and was 3oC per minute for temperatures above
500oC. Sintering temperatures for different materials are:
Electrode Material Sintering Temperature
LSM, LSM/YSZ (Anode) 1250oC for 3h
NiO/YSZ 1300oC for 5h
LSCM/YSZ 1200oC for 2h
LSCM/NiO 1300oC for 3h
LSCM/CGO 1300oC for 1h
Table 2.1 Sintering temperatures for electrode materials.
2.1.2 Cells with ~250 micron YSZ electrolytes
Cells with thinner YSZ electrolyte disks (~250 micron thickness) were also made.
These were prepared similarly to the thick ones except by cutting and polishing the
pressed and sintered YSZ pellet with a diamond blade to ~250 micron thickness
electrolytes.
First, YSZ thick pellets were prepared in the same way as preparing 2mm YSZ
discs. The thick die was then fixed to a cutting machine with diamond blade. The
distance between the blade and the sample edge was adjusted to the thickness required.
Cooling fluid was added till the blade was dipped in the liquid. The die was cut at a
lower speed on the edge and higher speed later. The cut thin YSZ pellet was polished
by sand paper to get an appropriate thickness and smooth surface.
2.1.3 Tape-cast and impregnated cells
Cells with LSCM cathode and LSF anode were also prepared by tape casting and
impregnation methods. The first step of preparing this cell was to make a YSZ
backbone, by casting three YSZ tapes, two with and one without graphite pore
formers, and then laminating them together4, 5.
Tape casting is an easy and low cost way to fabricate thin and flat ceramic sheets
and multilayer structures mainly for the electronic industry6. Tape casting process
basically involves preparing a suspension consisting of the ceramic powder in a
solvent, with addition of dispersants, binders and plasticizers. This suspension is then
cast to a tape moving at a fixed speed. The tape with solvents is then dried in air and
could be cut to an appropriate shape7, 8. The dispersant controls the stability of the
35
to the tape, respectively9 (see figure 2.3).The detailed process is: 30 g YSZ powder
with acetone was milled by ‘planetary micro milling’ machine for 2 hours at the speed
of 2.5. The milled YSZ was dried for 20 minutes in air and room temperature to
evaporate acetone and then transferred to a plastic bottle with 36 balls. 14g solvent
(3AEK:2LETH) and 0.195g dispersant (Phosphate ester) were added into the YSZ
which was then ball milled for 18 hours under 28V. After that, 2.19g DBP, 2.43g PEG,
3.36g PVB and 0.5g solvent were added to the mixture for another 4 hour ball milling
under 18 volts. Then the slurry was ready to be cast. The height of the blade was set to
be 0.125mm which can produce 0.100mm YSZ tape after sintering (~25% shrinkage).
The suspension was cast through the blade to a moving plastic tape at a speed of 50.
This tape was dried overnight and then cut to a round shape (R= 1.5cm), and sintered
at 1350oC for 5 hours.
slurry
blade
tape
Figure 2.3. Schematic process of tape casting.
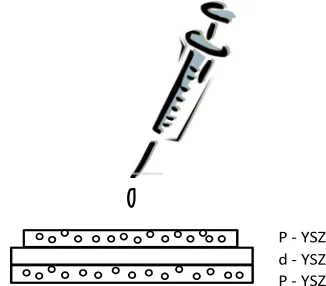
An aqueous solution containing La(NO3)3.6H2O, Sr(NO3)2, Cr(NO3)3.9H2O and
Mn(CH3COO)2.4H2O was impregnated to the porous YSZ cathode support to reach a
50 wt% LSCM content. An aqueous solution containing La(NO3)3.6H2O, Sr(NO3)2
and Fe(NO3)3.9H2O was impregnated to the porous YSZ anode support to reach 40
wt%10-13 (see figure 2.4). The impregnated solutions were calcined at relevant
d - YSZ P - YSZ
[image:45.595.202.365.76.219.2]P - YSZ
Figure 2.4 . Schematic process of impregnation.
The cell made by tape casting and impregnation method has a 50 micron thick
dense YSZ electrolyte, a 110 micron thick porous YSZ cathode support with about 50%
weight impregnated LSCM load and a 120 micron thick porous YSZ anode support
with about 40% weight impregnated LSF load.
2.1.4 Cells with tape-casted electrolytes and printed
electrodes
SOECs with thin YSZ electrolyte were also made by applying electrode inks on
sintered single layer dense YSZ tape. As the electrode is thin, the inks are painted
onto the surfaces of YSZ disk by soft brush rather than by screen printing. In this way,
a cell with 50 micron thick electrolyte and 20~30 micron thick electrodes was made.
These cells do not have high mechanical strength and thus need careful handling with.
These cells have the same thin YSZ electrolyte with cells made by tape casting and
impregnation methods..
2.1.5 Other methods
Some other ways were tried to produce cells with thinner YSZ electrolytes but
failed.
37
Cathode
Electrolyte-YSZ
LSCM+YSZ(1:1)
+Graphite powder
YSZ powder
[image:46.595.227.370.544.749.2]Co-press Sinter
Figure 2.5. fabricating process and picture of a co-pressed cell with YSZ electrolyte and LSCM/YSZ cathode.
The cell was planned to be made by applying anode ink on co-pressed
YSZ-LSCM/YSZ pellet. LSCM/YSZ (50% LSCM by weight) powder was poured
into the pressing die and pressed lightly by hand to make surface flat. YSZ powder
was then poured on top of cathode powder. The two layers of powders were
co-pressed to form a disk which is fired to high temperature subsequently.
I failed to make a good cell by co-pressing in my work. Thermal expansion
coefficients of the electrolyte and cathode did not match well. It might be improved
by adjusting components of the powders. Photo in figure 2.5 shows the separation of
the two parts after sintering.
2.1.5.2 Cells with screen printed thin YSZ electrolyte
YSZ electrolyte interlayer
LSM