Research Report
Alterations in the microstructure of white matter in
children and adolescents with Tourette syndrome
measured using tract-based spatial statistics and
probabilistic tractography
Hilmar P. Sigurdsson
a, Sophia E. P
ep
es
a, Georgina M. Jackson
d,
Amelia Draper
b, Paul S. Morgan
cand Stephen R. Jackson
a,d,* aSchool of Psychology, University of Nottingham, UK
bNuffield Department of Clinical Neuroscience, University of Oxford, UK cDepartment of Academic Radiology, University of Nottingham, UK
dInstitute of Mental Health, School of Medicine, University of Nottingham, UK
a r t i c l e i n f o
Article history:
Received 5 July 2017 Reviewed 9 October 2017 Revised 24 February 2018 Accepted 4 April 2018
Action editor Michel Thiebaut de Schotten
Published online 12 April 2018
Keywords:
Diffusion tensor imaging Tourette syndrome Probabilistic tractography Graph theory
Premonitory urges
a b s t r a c t
Tourette syndrome (TS) is a neurodevelopmental disorder characterised by repetitive and intermittent motor and vocal tics. TS is thought to reflect fronto-striatal dysfunction and the aetiology of the disorder has been linked to widespread alterations in the functional and structural integrity of the brain. The aim of this study was to assess white matter (WM) abnormalities in a large sample of young patients with TS in comparison to a sample of matched typically developing control individuals (CS) using diffusion MRI. The study included 35 patients with TS (3 females; mean age: 14.0±3.3) and 35 CS (3 females; mean age: 13.9±3.3). Diffusion MRI data was analysed using tract-based spatial statistics (TBSS) and probabilistic tractography. Patients with TS demonstrated both marked and wide-spread decreases in axial diffusivity (AD) together with altered WM connectivity. Moreover, we showed that tic severity and the frequency of premonitory urges (PU) were associated with increased connectivity between primary motor cortex (M1) and the caudate nuclei, and increased information transfer between M1 and the insula, respectively. This is to our knowledge the first study to employ both TBSS and probabilistic tractography in a sample of young patients with TS. Our results contribute to the limited existing literature demonstrating altered connectivity in TS and confirm previous results suggesting in particular, that altered insular function contributes to increased frequency of PU.
©2018 The Authors. Published by Elsevier Ltd. This is an open access article under the CC BY license (http://creativecommons.org/licenses/by/4.0/).
*Corresponding author. School of Psychology, The University of Nottingham, Nottingham, NG7 2RD, UK. E-mail address:[email protected](S.R. Jackson).
Available online at
www.sciencedirect.com
ScienceDirect
Journal homepage:www.elsevier.com/locate/cortex
c o r t e x 1 0 4 ( 2 0 1 8 ) 7 5e8 9
https://doi.org/10.1016/j.cortex.2018.04.004
0010-9452/©2018 The Authors. Published by Elsevier Ltd. This is an open access article under the CC BY license (http://creativecommons.
1.
Introduction
Hyperkinetic movement disorders, particularly those whose aetiology involve the basal ganglia (BG) nuclei and have a high rate of co-occurring neuropsychiatric disorders, have often been shown to exhibit alterations in brain white matter (WM) and grey matter (GM) (seeHayhow et al., 2013). One type of a hyperkinetic disorder, Tourette syndrome (TS), is of particular interest due its high rate of co-occurring neuropsychiatric disorders (Freeman et al., 2000; Zohar et al., 1999); complex aetiology (Du et al., 2010); its high impact on patients'social functioning and overall quality of life (Cath et al., 2011); and its multi-faceted symptoms which the patient can hide or mask for brief periods of time (Leckman, 2002). TS is characterised by rigid, repetitive, and intermittent movements and vocal-isations termed tics (Leckman, 2002). TS is commonly diag-nosed in early childhood, with the onset of tics reported to range between 5 and 10 years of age (Leckman, 2002). Tics tend to peak in severity around adolescence and may decrease in severity during early adulthood. Nonetheless, nearly a quarter of patients continue to present symptoms as adults and these may increase in severity and become resistant to treatment
(Cath et al., 2011). Most frequently, patients present
co-occurring symptoms of obsessive-compulsive disorder [OCD] and attention-deficit hyperactivity disorder [ADHD] (Freeman
et al., 2000; Zohar et al., 1999). The prevalence of TS has been
reported to be approximately 50 per 10.000 children, but rates are lower in adolescents and younger adults (Comings, Himes, &Comings, 1990; Nomoto&Machiyama, 1990). The syndrome is known to be more prevalent in males than females with the gender ratio being ~4:1 in child and adolescent samples (Tallur &Minns, 2010).
Patients with TS often also report the presence of uncom-fortable bodily and cognitive urges referred to as sensory phenomena (SP). These SPs involve premonitory urge sensa-tions (PU) which are thought to occur in almost all patients and are often localised to the area of tic (Cavanna, Black,
Hallett, & Voon, 2017; Kwak, Dat Vuong, & Jankovic, 2003;
Leckman, Walker, & Cohen, 1993). Frequency of PU in
pa-tients is usually measured using self-report questionnaires
(Rosario et al., 2009; Woods, Piacentini, Himle,&Chang, 2005).
Patients often report that PU and tics coincide, and conse-quently, it has been proposed that tics are triggered by a conscious impulse, in which the tic soothes the uncomfort-able sensation (SP) for a brief period of time (Bliss, 1980; Kane,
1994; Patrick, 1905). However, the causal link between tics and
PU is currently unknown.
TS is widely characterised as a fronto-striatal disorder and the syndrome aetiology is thought to involve widespread al-terations in the functional and structural integrity of the brain. Most commonly, symptoms of TS are attributed to disinhibition of cortico-striato-thalamo-cortical (CSTS) cir-cuits (Albin&Mink, 2006; Mink, 2001).Mink (2001)proposed a model suggesting dysfunction of inhibitory control within the BG. This model linked the occurrence of tics to the altered activity of striatal neurons. Supporting evidence for this pro-posal was described in two neuropathological studies that demonstrated altered number and distribution of GABAergic and cholinergic interneurons within the striatum in severe
and persistent TS (Kalanithi et al., 2005; Kataoka et al., 2010). Recently, animal and computational models have demon-strated that tic production can result from atypical selection processes employed by the CSTS circuits (Caligiore, Mannella,
Arbib,&Baldassarre, 2017; McCairn, Iriki,&Isoda, 2013).
Structural neuroimaging studies have shown reduced volume of several BG nuclei such as the caudate nucleus
(Peterson, et al., 2003), thalamus (Makki, Behen, Bhatt, Wilson,
&Chugani, 2008; Makki, Govindan, Wilson, Behen,&Chugani, 2009) and regional increases in GM volume in the putamen
(Ludolph et al., 2006) in children and adolescent patients with
TS in comparison with typically developing control subjects. Paradoxically, a recent, multicentre study with a sample of young patients reported greater GM volume in the posterior thalamus but was unable to replicate previous morphological differences in the caudate (Greene et al., 2017). Also, thinning of sensorimotor cortices in TS correlating with severity of tic symptoms suggests a putative role of both subcortical and sensorimotor areas in the aetiology of TS (Sowell et al., 2008;
Worbe et al., 2010). Several studies using diffusion tensor
imaging (DTI) have shown altered properties of WM micro-structure in patients with TS (e.g.,Govindan, Makki, Wilson,
Behen, & Chugani, 2010; Jackson et al., 2011; Makki et al.,
2008). However, the majority of DTI studies have included adult patients with TS, while few studies have included chil-dren or adolescent patients. Therefore, there is great need to investigate WM alterations in young patients. This is partic-ularly important as one study showed clear differences in structural integrity between adult and young patients with TS
(Plessen et al., 2004). DTI is a powerful method of assessing
structural integrity of WM in the brain non-invasively (Basser,
Mattiello, &LeBihan, 1994). Most importantly, these studies
have demonstrated abnormal diffusivity in subcortical struc-tures (Govindan et al., 2010; Makki et al., 2008; Saporta et al., 2010), corticocortical association and fronto-striatal path-ways, and insular cortices (Govindan et al., 2010). One recent study in very young patients demonstrated a widespread in-crease in axial diffusivity (AD;Liu et al., 2013) with another study showing a negative relationship between mean diffu-sivity and tic severity (Govindan et al., 2010). Similarly, altered water diffusion in the corpus callosum has been reported in several studies (Jackson, Parkinson, Jung, et al., 2011; Plessen
et al., 2006; Wolff et al., 2016), although one study found no
differences across groups (Jeppesen et al., 2014). Collectively, these results are consistent with the hypothesis of altered structural integrity of CSTC circuitry in TS, and potentially reduced functionality of information transfer across hemi-spheres that may contribute to symptoms through reduced inhibition of cortical activity (Boroojerdi, Topper, Foltys, &
Meincke, 1999; Orth &Rothwell, 2009). Unfortunately, there
is little consensus across all of these studies since patient characteristics vary widely, e.g., comorbidities and medica-tion status, rendering comparison difficult.
network properties by applying graph theoretical analysis to the resulting connectivity matrices.
Graph theory is a nascent way of exploring both functional and structural integrity of the brain (Bullmore&Sporns, 2009). In graph theory, networks are characterised by vertices (nodes) and edges (links) indicating a connection between a pair of nodes (Bullmore&Sporns, 2009). To date, two resting-state fMRI studies have applied graph theory in the study of
TS.Worbe et al. (2012)reported extensive alterations in CSTC
networks in patients. These alterations were primarily a complete absence of hub-like nodes, an increase in short-range connections, and the overall increase in the number of connections. Furthermore, key nodes within networks that were assessed in that study correlated with tic severity and complexity. Lastly,Tinaz, Malone, Hallett, and Horovitz (2015)
showed that patients demonstrate decreased connectivity in the parietal, limbic and, motor cortex regions, and increased connectivity of the thalamus and dorsal anterior insula in the right hemisphere.
Interestingly, only one study has explored the structural integrity of the brain using WM tractography and graph theory in young patients with TS (Wen et al., 2017). Also, no study has yet attempted to characterise the association between struc-tural integrity of WM and measures of PU in patients with TS. This association been assessed using functional MRI.
Bohlhalter et al. (2006)associated several areas of the brain
including the insular cortex with urges experienced immedi-ately prior to tics, suggesting a specific urge-to-tic network. Similarly, the GM volume of the dorsolateral putamen, the primary somatosensory cortex (Draganski et al., 2010), and the right insular cortex (Draper, Jackson, Morgan,&Jackson, 2015) have been associated with increased severity of PU, while resting-state functional connectivity between anterior insula and supplementary motor area has been shown to correlate with PU (Tinaz et al., 2015).
In summary, both structural and functional studies sug-gest altered volumes, impaired connectivity and abnormal water diffusion in key areas of the CSTC circuits in patients with TS. In this study, we used DTI to assess WM micro-structure in a large sample of children and adolescents with TS and a matched group of typically developing controls using tract-based spatial statistics (TBSS) and probabilistic tractog-raphy. Two separate hypotheses are tested in this study. First, we want to establish that patients with TS demonstrate altered water diffusion in key WM pathways and, second, we hypothesise altered structural connectivity between cortical and subcortical regions of the brain characterised by loss of hub-like nodes in a network, greater number of connections and increased number of short range connections. Finally, we want to ascertain whether alterations in network attributes in patients with TS can be predicted using measures of tic severity and PU.
2.
Materials and methods
2.1. Participants
The study was carried out in 35 children and adolescents (3 females, mean age: 14.0±3.3, age range: 8.6e21.8) diagnosed
with TS according to DSM-IV (APA, 2000) and 35 typically developing controls (CS; 3 females, mean age: 13.9±3.3, age range: 8.5e21.2) matched for age and gender. Patients with TS were recruited from a specialist TS clinic based at the Queen's Medical Centre, Nottingham. Current symptoms of TS were assessed using the Yale Global Tic Severity Scale (YGTSS;
Leckman et al., 1989). Participants were encouraged to
describe tics specifically with regard to the frequency and intensity of their tics. Premonitory urges (PU) were assessed using the Premonitory Urge for Tics Scale (Woods et al., 2005). All participants were screened for symptoms of: ADHD using the Conners-3 self-report measure (Conners, 2008); obsessive-compulsive behaviour (OCB) using Children's Yale-Brown Obsessive Compulsive Scale (CY-BOCS; Scahill et al., 1997); and autism spectrum disorders (ASD) using Social Commu-nication Questionnaire (SCQ;Berument, Rutter, Lord, Pickles, & Bailey, 1999) by a trained clinical research nurse. IQ esti-mates were obtained from each participant using the vocab-ulary and matrix reasoning sub-tests from the Wechsler's Abbreviated Scale of Intelligence (WASI; Wechsler, 1999). Exclusion criteria included an IQ below 70, diagnosis of anxi-ety, depression or any other form of psychiatric disorder, and learning and sight disabilities. Written informed consent was obtained from all patients (or their guardians). The study was approved by an appropriate local ethical review committee.
2.2. MRI parameters
Brain imaging data from all participants was acquired using a Philips 3T Achieva MRI scanner (Best, The Netherlands) equipped with a 32-channel SENSE head-coil at the Sir Peter Mansfield Imaging Centre (SPMIC), University of Nottingham. Participants were placed supine and head first into the scan-ner. Head motion was minimized by inserting foam pads be-tween the participants'head and the head coil. Participants also wore headphones for hearing protection that provided additional control over head motion. Participants were instructed to lie as still as possible during and in between scans. Diffusion images were collected using an Echo-Planar Imaging sequence with 48 slices with 2 mm slice thickness and no inter-slice gap, TR/TE ¼ 7655/55 msec, voxel size¼112 mm3, FOV¼224224, matrix¼112112, 32
gradient directions and a diffusion weighting (b-value)¼1000 sec/mm2. The first volume in the sequence for each subject has no diffusion weighting (b¼0) and is used to align the brain to the diffusion-weighted data during analysis. In addition, we acquired high-resolution T1-weighted anatomical images using a magnetization-prepared rapid gradient echo (MPRAGE) sequence with the following param-eters: TR/TE ¼ 8.41 msec/40 msec, FOV ¼ 256 256, flip angle¼8, 180 contiguous axial slices with 1 mm3isotropic
resolution.
2.3. MRI image processing
All DTI data was pre-processed using FSL's (v. 5.0.8) FDT toolkit
(Behrens et al., 2003; Smith et al., 2004). Diffusion-weighted
images were corrected for subject motion and Eddy currents using affine registration to the non-diffusion weighted images (B0 volume). Next, the brain was extracted from the skull and
excess air removed using the Brain Extraction Tool (BET v. 2.1;
Smith, 2002) with a fractional intensity threshold of .3.
Diffu-sion tensors were fitted to each voxel of the brain using DTIFIT within FSL. The output images generated included: the three eigenvectors (V1, V2and V3) and eigenvalues (l1,l2,l3); FA; and
an MD map at each brain voxel for each subject. The first eigenvalue (l1) was used to represent AD and average of the
second and third eigenvalues (l2þl3/2) to represent radial diffusivity. For each participant, we quantified head motion. Visual inspection was conducted for all data after every pro-cessing step to ensure data quality and to screen for any obvious MR scanning artefacts. Head motion parameters were calculated to provide a quantitative measure of movement inside the scanner. These were derived from the three trans-lation (x, y, z in mm) and three rotation (a,b, g, in radians) parameters. Rotational parameters were converted from ra-dians to degrees at radius of 50 mm. Participants were excluded if any obvious distortions or artefacts were present during visual inspection or if any of the rotation or translation parameters exceeded 1.5 mm/degree.
2.4. TBSS
Diffusion maps were entered into a voxelwise statistical analysis using TBSS(Smith et al., 2006) to quantify differences in WM microstructure between patients and controls. TBSS projects volumetric data onto a WM skeleton. This method gains statistical power due to dimensionality reduction and thus circumvents the partial volume effect (Smith et al., 2006). TBSS is an attractive method due to its power in adjusting for image misalignment and renders data smoothing unnec-essary. The TBSS processing pipeline consisted of nonlinear registration using the FLIRT function and b-spline represen-tation of the registration warp field (Rueckert et al., 1999). Next, since the FMRIB58_FA target might be unsuitable for our young sample the most representative subject (one that re-quires the least amount of warping to match every other subject) across both groups was identified and all FA maps aligned to this target. Both target and individual FA maps were transformed into standard MNI space. A WM skeleton was created from the mean FA image to represent centres of all tracts with an intensity threshold of .2 (to exclude GM and CSF) and each subject's aligned FA image projected to the skeleton. Between-group comparison on FA maps was accomplished using this skeleton. Furthermore, original nonlinear registration of FA images can be used on other diffusion scalars (i.e., MD, AD and RD images), creating WM skeletons for each diffusion scalar (i.e., MD skeleton, RD skeleton, AD skeleton).
2.5. Region specific connectivity by probabilistic tractography
2.5.1. Regions of interest
In addition to TBSS, region specific probabilistic streamline tractography was accomplished using the open-source diffu-sion MRI toolkit Camino (Cook et al., 2006), and using bayesian techniques (Friman, Farneb€ack,&Westin, 2006) to track WM fibres between each region of interest (ROI) and to construct
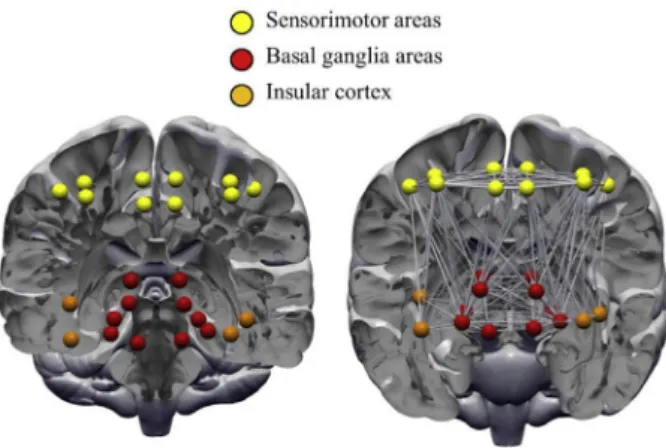
connectivity matrices for each participant in native space. With Bayesian techniques, the probability distribution func-tion can be estimated on the principal fibre direcfunc-tion at each voxel in the brain and distribution of connectivity values be-tween a particular seed and all other points are generated by repeatedly sampling connected pathways (Friman et al., 2006). Twelve ROIs (Fig. 1) were carefully selecteda prioriROIs based upon previous studies (Tinaz et al., 2015; Worbe et al., 2015) since we wanted to assess connectivity between cortical, subcortical and insular GM structures. ROIs were extracted from established and widely used templates avail-able in the literature. Specifically, we used sensorimotor ROIs specified in the human motor area template (HMAT;Mayka,
Corcos, Leurgans, & Vaillancourt, 2006), including the
pri-mary motor and sensory cortices (M1 and S1), SMA and pre-SMA, and the dorsal premotor cortex. Next, subcortical structures were selected based on the BG human area tem-plate (BGHAT;Prodoehl, Yu, Little, Abraham,&Vaillancourt, 2008), including the caudate, putamen, globus pallidus and thalamus, in addition to adding the nucleus accumbens (part of the ventral striatum). Finally, we included the anterior and posterior portions of the insular cortex, extracted from the comprehensive parcellation analysis done byKelly et al. (2012)
whose analysis was based on over 1000 MR scans derived from the 1000 Functional Connectomes Project.
Registration of ROIs from MNI space to individual DTI native space was accomplished in three steps: 1) Individual anatomical images were co-registered to the B0 image using linear transformation (FLIRT), 2) the transformed T1-weighted images were next transferred to a standard template [ICBM152 Montreal Neurological Institute (MNI)] space using linear and non-linear transformation (FLIRT and FNIRT), and 3) the resulting transformation matrix was applied inversely to bring each ROI into DTI native space (i.e., each ROI had a voxel dimension of 112 mm3). Distinct labelling of the ROIs was
preserved using nearest neighbour interpolation. Finally, in-dividual ROIs were combined into a single mask.
2.5.2. Assessment of connectivity
Transformed, co-registered, T1-weighted images were segmented into GM, WM and CSF using the FAST segmentation tool in FSL (Zhang, Brady,&Smith, 2001). Whole-brain proba-bilistic streamline tractography was accomplished using the ‘track’command within Camino. Segmented WM served as a starting seed for fibre tracking in a whole-brain technique termed ‘exhaustive search method’(Basser, Pajevic, Pierpaoli,
Duda,&Aldroubi, 2000; Gong et al., 2009; Mori&Van Zijl, 2002).
Individual FA maps were entered to restrict the tracking pro-cedure to voxels with FA.2 to exclude tracts entering GM or CSF. Tracking was initiated from the centre of each WM voxel with a step size of .5 mm. Tracking continued until a voxel was entered which fell below the termination criteria or when local streamline curvature exceeded 60. Next, connectivity matrices were generated by recording how many streamlines connect each pair of ROI targets. Mean tract statistics from DTI scalars were extracted from each connected ROI pair. As a result, an undirected weighted structural brain network for each participant was represented by a symmetric 2424 ma-trix. Finally, since raw streamline connectivity matrices might be influenced by brain volume we calculated total intracranial volume (TIV) as the sum of WM and GM.
2.5.3. Network construction
We used graph theoretical analysis to quantify any differences in connectivity across the 24 ROIs. A graph is represented byV
number of nodes connected byEedges (Bullmore&Sporns, 2009). An important step in graph theory analysis is assess-ing networks at different thresholds. However, few guidelines exist on the choice of these thresholds. Therefore, in this study networks were constructed based on a proportional thresh-olding method such that any connection value above an arbi-trary percent threshold (i.e., .15 or 15%) were included as a connection, while other connections falling below this threshold were excluded. Subsequently, matrices were binar-ized and entered into the analysis. All analyses were con-ducted across a variety of thresholds ranging from .15 to .40 in steps of .01, equalling to 26 thresholds. Proportional thresh-olding ensures network compatibility across groups by keeping the number of nodes and edges the same and improves network measure stability (Garrison, Scheinost, Finn, Shen,&
Todd, 2015). Nine graph metrics: global efficiency;
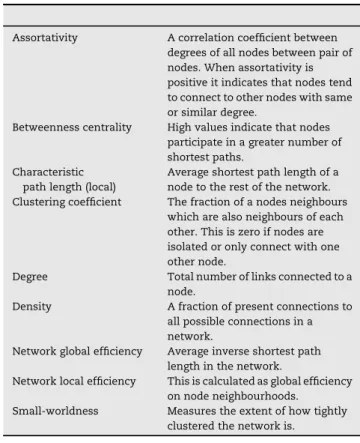
small-worldness; assortativity; density; degree; betweenness cen-trality; shortest path length; clustering coefficient; and local efficiency, were calculated and are detailed inTable 1. It is possible that with 24 ROIs our networks could lack small-world properties, which is an essential factor in graph theory. Ac-cording to the seminal work done byWatts and Strogatz (1998)
and further iterated by others (e.g., Humphries, Gurney, &
Prescott, 2006) small worldness can be confirmed in networks
using real and random network clustering coefficient and characteristic path length. Therefore, to examine the small worldness of our networks we calculated the normalised clustering coefficient (g) and normalised path length (l). The small-world coefficientsis then calculated wheres¼g/l. If
s > 1, a network can be considered to reflect small-world properties. Finally, we defined ‘hubs’ using the following
criteria: betweenness centrality and degree were normalised across nodes (z-score) and thresholded at z 2. Hubs are thought to promote integration between different parts of functional networks.
2.6. Statistical analysis
Statistical differences in demographics between the two groups and head motion parameters were determined using parametrict-tests.
2.6.1. TBSS
When assessing differences in water diffusivity, age and IQ were de-meaned and entered as variables of no interest to remove any confounding differences between the two groups (TSvs. CS). Diffusion maps were entered into voxelwise cross-subject statistics in FSL with 5000 permutations using the inbuilt function ‘randomise’ (Winkler, Ridgway, Webster,
Smith,&Nichols, 2014). For all analyses, multiple voxel-wise
comparison was controlled using family-wise error correc-tion with a threshold set atp<.05 and cluster size of20 voxels. Therefore, all TFCE value images reported here were fully corrected for multiple comparisons. In addition, we ran correlation analyses in patients with TS only to assess whether any TBSS values correlated significantly with PU (PUTS) and/or tic severity scores. Clinical scores and patient diffusion maps were entered into a linear regression model in FSL with age and IQ as nuisance variables.
Tracts were identified using the JHU White-Matter Trac-tography and JHU ICBM-DTI-81 White-Matter Label atlases embedded within the FSL package.
2.6.2. Graph metrics
Graph metrics were assessed across groups using a general linear model (GLM) with group as a between subjects factor and age, IQ and TIV as nuisance covariates. We generated 500 null-networks, with the same number of nodes and edges, and degree distribution as the real networks for each subject
(Maslov&Sneppen, 2002). These null networks can be used for
normalisation of network measures such as small-worldness (i.e., to produce the normalisedg,l, andsmetrics). We then used a multiple linear regression to assess any association between graph metrics and clinical measures in patients only. As such, we ran the association analysis using the two clinical measures separately, between all nodes and across all thresholds and all graph metrics. Thus, 262419¼5,616 correlation coefficients were corrected for using multiple comparison correction. We also note that we ran the associ-ation analysis in patients only since the two clinical measures (YGTSS and PUTS) were not recorded in the control group.
Statistical differences in graph metrics were assessed using 1000 permutation tests. Statistical difference was first explored at a more lenientp<.001 uncorrected threshold.p -values were corrected for multiple comparison using false discovery rate (FDR; Benjamini and Hochberg, 1995) at p-FDR<.05. Graph metrics and statistical analysis was accom-plished using the Graphvar interface for the Brain Connec-tivity Toolbox (Kruschwitz, et al., 2015; Rubinov & Sporns,
2010).
3.
Results
3.1. Sample characteristics
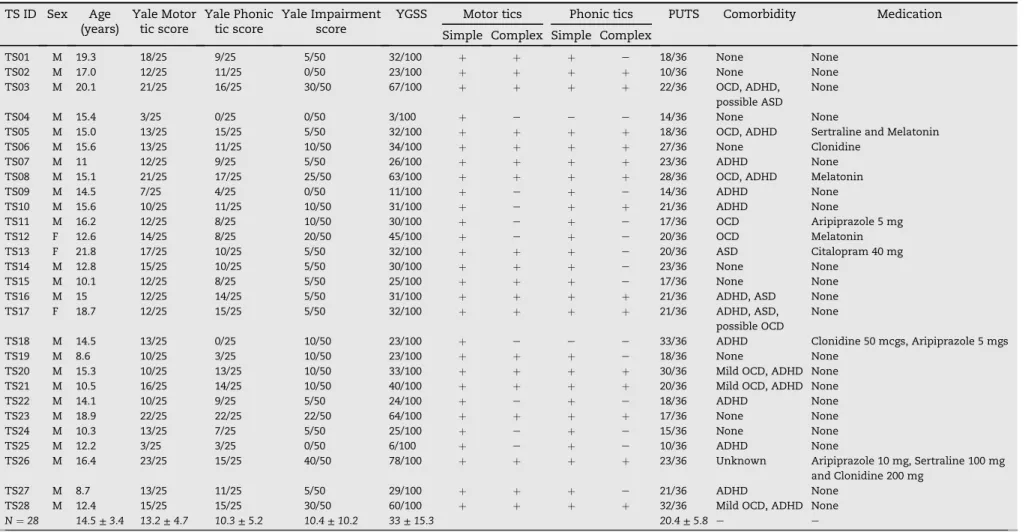
Post pre-processing showed that 7 patients with TS and 5 control subjects had to be excluded due to excessive head motion during the DTI scan as measured using rotation and translation parameters. The final sample therefore consisted of 28 patients with TS (3 females, mean age: 14.5±3.8, age range: 8.6e21.8) and 30 control subjects (2 females, mean age: 14.1±2.9, age range: 9.6e21.2). Details of the patient sample can be seen inTable 2. In our sample, eight patients were medicated at the time of scanning. Nine out of 28 patients had no comorbidities, six had comorbid ADHD, two had OCD, and eight had combined ADHD, OCD and/or ASD. One participant was not screened. All patients reported PU. IQ was not significantly different between the two groups in our final sample (TS mean: 110.1±14.6, CS mean: 119.9±12.1,p>.05).
3.2. Between-group differences in voxel-wise cross-subject statistics
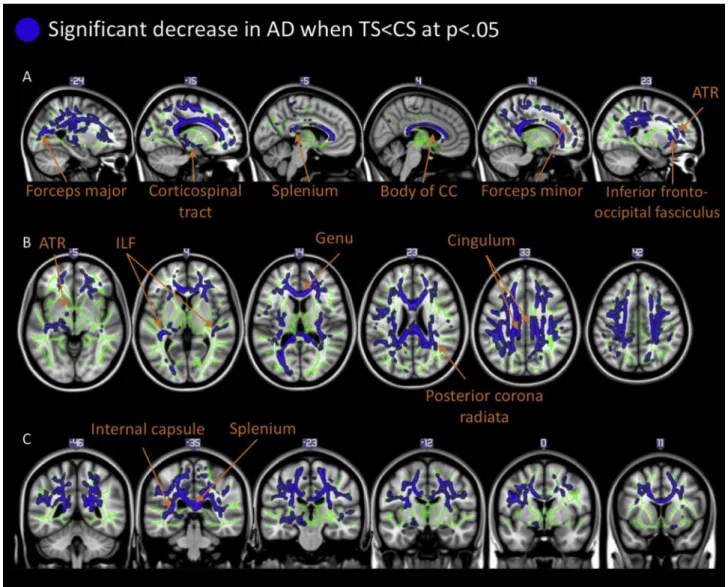
Results of the comparison between the group of patients with TS and matched control subjects demonstrated that there were widespread decreases in AD values in the TS group bilaterally (one large cluster of 32,988 voxels). Relevant data are presented inFig. 2. Four peak coordinates were identified being the right anterior thalamic radiation [ATR; MNI co-ordinates: X: 23 Y:40 Z: 28, t (56)¼2.99,p<.05], the splenium
of the corpus callosum [MNI coordinates: X:11 Y:35 Z: 24, t (56)¼ 3.00,p<.05], the genu of the corpus callosum [MNI coordinates: X:11 Y: 20 Z: 20, t (56)¼2.56,p<.05] and the left forceps minor [MNI coordinates: X:12 Y: 36 Z: 4, t (56)¼2.70,
p<.05]. We did not find any significant increases of AD in patients compared to controls. Furthermore, there were no differences between the two groups for FA or RD atp<.05. Finally, we found no effect of medication since a separate TBSS analysis, excluding patients on medication, yielded the same results demonstrating widespread decrease in AD in TS, but unaffected FA and RD.
3.3. Relationship between water diffusion and clinical measures in patients with TS
We found no significant association between any diffusion measure (FA, AD, MD or RD) and PU (PUTS) or tic severity (Yale score) in patients (allp>.05).
3.4. A trend for altered WM connectivity in patients
Analysis of tractography data was carried out using AD maps for each subject. This was preferred over using the more conventional FA maps since our TBSS result showed signifi-cant group differences on AD maps. We are aware that AD is perhaps not as representative as a connectivity measure in comparison to FA. However, FA is a composite measure of all diffusion directions, while AD represents the diffusion paral-lel to the principal axis of the tensor. We also believe that using AD, which is clearly altered in TS (whereas FA is not), adds depth to the discussion of the pathology of TS. Therefore, for each pair of ROIs we extracted the mean AD value of WM tract that connects the two.
Network density was not significantly different across groups at any threshold [Fig. 3A; t (56)¼.61e.68,p>.001]. This indicates that the any observed differences between groups in graph metrics cannot be attributed to differences in network density. No other global metric (i.e., small-worldness, g, l, global efficiency, and assortativity) showed any significant difference across groups (Fig. 3BeF; allp>.05). By contrast, we found significantly enhanced betweenness centrality with respect to the left putamen of the TS patients at several thresholds [thresholds: 25-24%, 22-19%, CS grand mean: 39.6, TS grand mean: 46.65, t (56)¼ 1.69 to2.17,p<.001 uncor-rected]. The difference in betweenness centrality became non-significant after stringent multiple comparison correc-tion, and results are interpreted with this in mind. The char-acteristic path length was also significantly higher in patients across several thresholds for the right accumbens [thresholds: 28%e20%, CS grand mean: 4.30, TS grand mean: 4.62, t (56) ¼ 1.37 to 1.89,p < .001 uncorrected]. No threshold survived our stringent multiple comparison correction. No other graph metric showed any significant between group differences. Additionally, we calculated hubs from metrics betweenness centrality and degree. Nodes satisfying the condition of having z-scores 2 across both metrics were considered as hubs. As can be seen inFig. 4, both groups had two nodes showing hub-like characteristics, the right puta-men and left SMA.
Table 1eGraph metrics used in the study.
Assortativity A correlation coefficient between degrees of all nodes between pair of nodes. When assortativity is positive it indicates that nodes tend to connect to other nodes with same or similar degree.
Betweenness centrality High values indicate that nodes participate in a greater number of shortest paths.
Characteristic path length (local)
Average shortest path length of a node to the rest of the network. Clustering coefficient The fraction of a nodes neighbours
which are also neighbours of each other. This is zero if nodes are isolated or only connect with one other node.
Degree Total number of links connected to a
node.
Density A fraction of present connections to
all possible connections in a network.
Network global efficiency Average inverse shortest path length in the network.
Network local efficiency This is calculated as global efficiency on node neighbourhoods.
Table 2ePatient specific characteristics.
TS ID Sex Age (years)
Yale Motor tic score
Yale Phonic tic score
Yale Impairment score
YGSS Motor tics Phonic tics PUTS Comorbidity Medication
Simple Complex Simple Complex
TS01 M 19.3 18/25 9/25 5/50 32/100 þ þ þ e 18/36 None None
TS02 M 17.0 12/25 11/25 0/50 23/100 þ þ þ þ 10/36 None None
TS03 M 20.1 21/25 16/25 30/50 67/100 þ þ þ þ 22/36 OCD, ADHD,
possible ASD
None
TS04 M 15.4 3/25 0/25 0/50 3/100 þ e e e 14/36 None None
TS05 M 15.0 13/25 15/25 5/50 32/100 þ þ þ þ 18/36 OCD, ADHD Sertraline and Melatonin
TS06 M 15.6 13/25 11/25 10/50 34/100 þ þ þ þ 27/36 None Clonidine
TS07 M 11 12/25 9/25 5/50 26/100 þ þ þ þ 23/36 ADHD None
TS08 M 15.1 21/25 17/25 25/50 63/100 þ þ þ þ 28/36 OCD, ADHD Melatonin
TS09 M 14.5 7/25 4/25 0/50 11/100 þ e þ e 14/36 ADHD None
TS10 M 15.6 10/25 11/25 10/50 31/100 þ e þ þ 21/36 ADHD None
TS11 M 16.2 12/25 8/25 10/50 30/100 þ e þ e 17/36 OCD Aripiprazole 5 mg
TS12 F 12.6 14/25 8/25 20/50 45/100 þ e þ e 20/36 OCD Melatonin
TS13 F 21.8 17/25 10/25 5/50 32/100 þ þ þ e 20/36 ASD Citalopram 40 mg
TS14 M 12.8 15/25 10/25 5/50 30/100 þ þ þ e 23/36 None None
TS15 M 10.1 12/25 8/25 5/50 25/100 þ þ þ e 17/36 None None
TS16 M 15 12/25 14/25 5/50 31/100 þ þ þ þ 21/36 ADHD, ASD None
TS17 F 18.7 12/25 15/25 5/50 32/100 þ þ þ þ 21/36 ADHD, ASD,
possible OCD
None
TS18 M 14.5 13/25 0/25 10/50 23/100 þ e e e 33/36 ADHD Clonidine 50 mcgs, Aripiprazole 5 mgs
TS19 M 8.6 10/25 3/25 10/50 23/100 þ þ þ e 18/36 None None
TS20 M 15.3 10/25 13/25 10/50 33/100 þ þ þ þ 30/36 Mild OCD, ADHD None
TS21 M 10.5 16/25 14/25 10/50 40/100 þ þ þ þ 20/36 Mild OCD, ADHD None
TS22 M 14.1 10/25 9/25 5/50 24/100 þ e þ e 18/36 ADHD None
TS23 M 18.9 22/25 22/25 22/50 64/100 þ þ þ þ 17/36 None None
TS24 M 10.3 13/25 7/25 5/50 25/100 þ e þ e 15/36 None None
TS25 M 12.2 3/25 3/25 0/50 6/100 þ e þ e 10/36 ADHD None
TS26 M 16.4 23/25 15/25 40/50 78/100 þ þ þ þ 23/36 Unknown Aripiprazole 10 mg, Sertraline 100 mg and Clonidine 200 mg
TS27 M 8.7 13/25 11/25 5/50 29/100 þ þ þ e 21/36 ADHD None
TS28 M 12.4 15/25 15/25 30/50 60/100 þ þ þ þ 32/36 Mild OCD, ADHD None
N¼28 14.5±3.4 13.2±4.7 10.3±5.2 10.4±10.2 33±15.3 20.4±5.8 e e
Abbreviations: YGSS: Yale Global Severity Scale; PUTS: Premonitory urge for tics scale; OCD¼Obsessive compulsive disorder; ADHD¼Attention-deficit hyperactivity disorder; ASD¼Autism spectrum disorder;þ ¼symptom is present;e¼symptom is not present.
cor
t
e
x
104
(2018)
75
e
89
3.5. Association between graph metrics and clinical measures
We used multiple linear regression analysis to investigate any association between the different graph metrics (adjusted for the effects of age, IQ and TIV) and tic severity (YGTSS) or premonitory urges (PUTS) in TS patients. PUTS scores showed a significant association with local efficiency on three nodes (ROIs). First, the left caudate was negatively associated with PUTS scores [thresholds: 27%e24%, 22-20%,b¼ .55 to.57, t (22)¼ 2.66 to2.94,p<.001]. Second, there was also a sig-nificant positive association with PUTS scores for the right posterior insula in four threshold [thresholds: 21-18%,b¼.55, t (22)¼2.79,p<.001]. Third, there was a positive association with PUTS scores for the left anterior insula [thresholds: 16-15%, b ¼ .60, t (22) ¼ 3.14e3.25, p < .001]. All thresholds
survived correction for multiple comparisons. The relation-ship between PUTS scores and the residual local efficiency is depicted in Fig. 5. Tic severity scores and measures of betweenness centrality showed a significant positive associ-ation on three nodes. The left thalamus [thresholds: 28%e
15%, b¼ 6.66e17.35, t (22)¼ 1.82e3.79,p< .001] with two thresholds surviving FDR correction; the right M1 [thresholds: 40-38%, 35e3% and 29e15%,b¼7.59e16.27, t (22)¼1.51e3.49,
p<.001], with one threshold surviving FDR correction; and the right dorsal premotor cortex [thresholds: 40e33%, 20% and 18e15%,b¼7.97e16.42, t (22)¼1.44e3.45,p<.001] with no threshold surviving a multiple comparison correction. No as-sociation was found between clinical measures and any global metric (allp>.001). For brevity we decided not to describe or report any non-significant correlations (i.e., wherep> .001 uncorrected).
4.
Discussion
In this study, we used TBSS and probabilistic tractography to investigate alterations in WM microstructure in a large sam-ple of children and adolescents with TS compared to a group of age- and gender matched typically developing controls. Our TBSS analysis revealed a marked and widespreaddecreasein AD in patients with TS (seeFig. 2.). In addition, patients also demonstrated altered WM connectivity measured using WM tractography. These results are in line with past studies showing altered WM microstructure in patients with TS
(Govindan et al., 2010) and altered connectivity of
fronto-striatal areas (Worbe et al., 2012, 2015). However, we failed to note any significant alterations in the most commonly used diffusion metric (FA). Nonetheless, the novelty of our results is showing, for the first time in a sample of patients with TS, a direct relationship between structural connectivity and fre-quency of PU. This is, to our knowledge, the first study to
employ both TBSS and probabilistic tractography to examine potential atypical WM microstructure in a young sample of patients with TS.
4.1. TS is associated with marked and widespread alterations in AD
DTI is used to describe diffusion of water in tissue and is useful since random motion of water molecules in the brain are influenced by architectural properties of tissue (Le Bihan, 2003). Diffusion of water in tissue varies with direction and is least restricted parallel to the orientation of the fibres, while being much more restricted perpendicular to them (Nucifora,
Verma, Lee, & Melhem, 2007). Our results of marked and
widespreaddecreasein AD is in contrast to recently published results byLiu et al. (2013), showing regionalincreasesof AD in very early TS. However, this apparent discrepancy could be explained by differences in the age of participants. Our sample
Fig. 3eComparison of global metrics between groups. Global metrics: A) density, B) small-worldness, C) global efficiency and D) assortativity, were compared across the two groups. None of the global metrics were significantly different across groups (allp>.05).
largely consisted of adolescents whereas participants in Liu et al.'s study were very young children with short disease duration. Age has previously been shown to be a significant factor in diffusion MR studies (Asato, Terwilliger, Woo, &
Luna, 2010; Bennett, Madden,& Vaidya, 2010). Specifically,
we tend to see a significant linear decline in AD with age in healthy participants in almost all parts of the brain (Kumar,
Nguyen, Macey, Woo, & Harper, 2012). Therefore, the two
studies indicate that whereas AD is enhanced in very young patients this reverses by early adolescence, in comparison with healthy control subjects. It is difficult to interpret these findings as TS is not known to affect WM directly. However, we theorise that these differences seen in patients with TS are due to increased freedom of cross-fibre diffusion as the pa-tient grows older, affecting AD (Alexander, Lee, Lazar,&Field,
2007; Song et al., 2002). Therefore, the apparent discrepancy of
our results and the ones by Liu et al.'s could also indicate a more rapid decline of AD values in patients with TS by increased branching of WM tracts. At present this is a postu-lation at best and a longitudinal study would clarify this. It is important to reiterate that our results cannot be attributed to differences in age of participants since age was used as vari-able of no interest. This is imperative since a recent study by
Worbe et al. (2015) showed that diffusion was significantly
influenced by age of participants.
Our sample of patients with TS also presented with several comorbid disorders such as ADHD and OCD (see Table 1). Interestingly, our TBSS results do conform to diffusion studies in patients with OCD but not ADHD. Young patients with ADHD are thought present withincreasedAD in several fronto-striatal, prefrontal and occipital WM pathways in comparison with control subjects (T. J.Silk, Vance, Rinehart, Bradshaw,&
Cunnington, 2009; Tamm, Barnea-Goraly, & Reiss, 2012).
However, AD seems to be significantly increased (there was no effect of any other diffusion scalar) in healthy controls in comparison with young OCD patients in both the genu and splenium of the CC (T.Silk, Chen, Seal,&Vance, 2013). These results indicate that whereas AD seems to be increased in ADHD patients, AD seems to be diminished in TS and OCD
patients. Unfortunately, we were unable to carry out any sub-group analyses due to lack of power. Plessen et al. (2006)
showed however that there is a significant reduction of WM connectivity in the CC in patients with TS, and these results remained following subgroup analyses (TS þ ADHD, TSþOCD).
We were unable to find any significant associations be-tween clinical measures and measures of WM diffusion. This is in line with recent study by Jeppesen et al. (2014). By contrast, other studies have reported significant correlations. For example,Liu et al. (2013)showed that WM microstructure in the right ATR pathway and right cingulum were positively correlated with tic severity. Likewise, in a similar sample as in the current study we previously demonstrated that WM water diffusion in the CC and forceps minor positively predicted tic severity (Jackson, Parkinson, Jung, et al., 2011). These results were interpreted by Jackson and colleagues to indicate that having TS might induce a compensatory functional reorga-nization. Regression analyses in the current study suggest that syndrome related decreases in AD are not associated with tic severity or frequency of PU. Instead, structural differences in the brain can only be attributed to having TS.
4.2. A trend for altered structural connectivity in TS
In addition to TBSS, we also assessed WM connectivity using probabilistic tractography and graph theoretical analysis with a set ofa priorispecified ROIs to quantify any differences in structural connectivity across the two groups. ROIs were specified from sensorimotor areas, subcortical regions and the insular cortex (seeFig. 1). Tractography, in conjunction with high resolution anatomical images, gains information about inter-voxel connectivity and WM structural connectivity, non-invasively (Behrens, Berg, Jbabdi, Rushworth, & Woolrich, 2007). We used graph theory with our tractography data and found some support for our second hypothesis. Patients in our sample displayed an increased number of connections amongst our ROIs but also exhibited a less functionally inte-grated network, as measured using the characteristic path
length metric. However, as our results did not survive a stringent multiple comparison correction, possibly due to lack of power, interpretation of these effects should be made with caution. PreviouslyWorbe et al. (2012)reported a complete lack of hubs, more functionally integrated networks and increased number of connections in adult patients with TS. In our sample we found no hub-related differences between the two groups. Hubs are considered to be important nodes in a network, with a maximum number of connections, they also facilitate integration between parts of a network (Rubinov&
Sporns, 2010). In our data, we identified two nodes (left SMA
and right putamen) classified as hubs in both groups. Inter-estingly, this was also demonstrated in a recent paper where both patients and control subjects had highly similar hub distribution (Wen et al., 2017). Similarly, in adults, both the left SMA and right putamen have been shown to display increased betweenness centrality in patients (Tinaz et al., 2015). This
indicates that amongst both children and adults, these two nodes might play a significant role in the pathology of TS.
4.3. Node specificity for tic severity and PU
To ascertain any relationship between clinical variables and graph metrics we ran a multiple regression analysis in our sample of patients. Most notably, we observed a positive linear association between the frequency of PU in patients and the efficacy of information transfer in the right posterior insula and left anterior insula as well as a negative relation-ship with information transfer in the left caudate after cor-recting for age, IQ and TIV. Thus, PUTS scores explain a significant amount of variance in local efficiency after the variance associated with these other variables has been controlled for. The insular cortex has been associated with interoception and activates significantly in fMRI studies
Fig. 5eLocal metrics showing association with PUTS scores. Local efficiency of three nodes showed a significant association with PUTS scores. Column A shows results from the left anterior insula; Column B shows results from the left caudate; Column C shows results from the posterior insula. Top row:p-values across thresholds. Middle row; nodes are coded in green. Bottom row: regression plots showing relationship between local efficiency and PUTS scores. *p-FDR<.05.
during somatosensory stimulation and suppression of bodily urges (Berman, Horovitz, Morel, & Hallett, 2012; Jackson,
Parkinson, Pears,& Nam, 2011). More specifically, the right
posterior insula has been shown to be specific for action and perception while the left anterior insula is important for cognition and emotion (Kelly, et al., 2012). In the context of TS, it has been demonstrated that functional connectivity of the right dorsal anterior insula has a significant relationship with urge frequency and tic severity in adult patients with TS
(Tinaz et al., 2015). Similarly, in children it has been shown
that GM thickness of the left insula is negatively associated with PUTS scores (Draper et al., 2015).
We also noted that tic severity was significantly associated with betweenness centrality on two nodes; a positive corre-lation with the left thalamus and right M1, indicating that as tic severity increases in patients these two nodes participate in a greater number of shorter paths within the network and might act as aberrant hub-like nodes.
4.4. Implication for clinical practice
Although not the main focus of our study, it is interesting to consider how our results could be implemented into clinical practice. For example, our results of increased information transfer (i.e., efficiency of certain areas of the insula) contributing to increased frequency of PU suggests hyper-connectivity of the insula to the rest of the nodes in a network. It is yet to be explored whether this increased con-nectivity can be reversed with behavioural therapy. One pre-vious study showed that comprehensive behavioural intervention for tics (or CBIT) resulted in decreased task-related activation of the putamen in patients with TS
(Deckersbach et al., 2014). By contrast, typically developing
individuals demonstrated increased activity in the same re-gion. The authors interpreted this finding as to indicate that CBIT might reduce hyper-elevated activity of the putamen and improve inappropriate activation of the putamen. The efficacy of other non-pharmacological remedies such as high aerobic exercise has been shown to reduce the frequency of tics, outlasting the duration of the exercise (Nixon, Glazebrook,
Hollis,&Jackson, 2014). No study has investigated the effect
of behaviour therapy on WM connectivity. Nonetheless, the evidence exists that greater habitual behaviour in patients with TS is related to stronger WM connectivity within the cortico-striatal network. We therefore urge future studies to look at the effect of behavioural therapy or exercise on the integrity of WM pathways.
5.
Conclusion
In this study we have demonstrated, for the first time in a young sample of patients with TS, clear atypical WM micro-structure and evidence for altered structural connectivity using diffusion MRI in comparison to matched typically developing control subjects. These results add to the existing literature of altered connectivity of the insula which might play a role in the frequency of PU experienced by patients. We also show that in contrast to very young patients, AD de-creases exponentially as the patient grows older.
Acknowledgment
This work was supported by the Medical Research Council (grant number G0901321) and the James Tudor Foundation. The authors would like to thank Jane Fowlie and Tourettes Action for assisting in participant recruitment.
r e f e r e n c e s
Albin, R. L., & Mink, J. W. (2006). Recent advances in Tourette syndrome research.Trends in Neurosciences, 29(3), 175e182.
https://doi.org/10.1016/j.tins.2006.01.001.
Alexander, A. L., Lee, J. E., Lazar, M., & Field, A. S. (2007). Diffusion tensor imaging of the brain.NeurotherapeuticseThe Journal of the American Society for Experimental NeuroTherapeutics, 4(3),
316e329.https://doi.org/10.1016/j.nurt.2007.05.011.
American Psychiatric Association. (2000).Diagnostic and statistical
manual of mental disorders(4th ed.). Washington DC: American
Psychiatric Association. text rev.
Asato, M. R., Terwilliger, R., Woo, J., & Luna, B. (2010). White matter development in adolescence: A DTI study.Cerebral Cortex, 20(9), 2122e2131.https://doi.org/10.1093/cercor/bhp282.
Basser, P. J., Mattiello, J., & LeBihan, D. (1994). MR diffusion tensor spectroscopy and imaging.Biophysical Journal, 66(1), 259e267.
https://doi.org/10.1016/S0006-3495(94)80775-1.
Basser, P. J., Pajevic, S., Pierpaoli, C., Duda, J., & Aldroubi, A. (2000). In vivo fiber tractography using DT-MRI data.Magnetic Resonance in Medicine, 44, 625e632.https://doi.org/10.1002/
1522-2594(200010)44.
Behrens, T. E. J., Berg, H. J., Jbabdi, S., Rushworth, M. F. S., & Woolrich, M. W. (2007). Probabilistic diffusion tractography with multiple fibre orientations: What can we gain?
Neuroimage, 34(1), 144e155.https://doi.org/10.1016/
j.neuroimage.2006.09.018.
Behrens, T. E. J., Woolrich, M. W., Jenkinson, M., Johansen-Berg, H., Nunes, R., & Clare, S. (2003). Characterization and
propagation of uncertainty in diffusion-weighted MR.Magnetic
Resonance in Medicine, 50, 1077e1088.
Benjamini, Y., & Hochberg, Y. (1995). Controlling the false discovery rate: A practical and powerful approach to multiple
testing.Journal of the Royal Statistical Society, 57(1), 289e300.
Bennett, I., Madden, D., & Vaidya, C. (2010). Age related differences in multiple measures of white matter integrity: A diffusion tensor imaging study of healthy aging.Human Brain, 31(3),
378e390.https://doi.org/10.1002/hbm.20872.Age-Related.
Berman, B. D., Horovitz, S. G., Morel, B., & Hallett, M. (2012). Neural correlates of blink suppression and the buildup of a natural bodily urge.Neuroimage, 59(2), 1441e1450.https://
doi.org/10.1016/j.neuroimage.2011.08.050.
Berument, S. K., Rutter, M., Lord, C., Pickles, A., & Bailey, A. (1999). Autism screening questionnaire: Diagnostic validity.The British Journal of Psychiatry, 175, 444e451.https://doi.org/
10.1192/bjp.175.5.444.
Bliss, J. (1980). Sensory experiences of Gilles de la Tourette syndrome.Archives of General Psychiatry, 37(12), 1343e1347. Retrieved fromhttp://www.ncbi.nlm.nih.gov/pubmed/
6934713.
Bohlhalter, S., Goldfine, A., Matteson, S., Garraux, G.,
Hanakawa, T., Kansaku, K., et al. (2006). Neural correlates of tic generation in Tourette syndrome: An event-related functional MRI study.Brain, 129, 2029e2037.https://doi.org/
10.1093/brain/awl050.
patients with schizophrenia using transcranial magnetic
stimulation.The British Journal of Psychiatry, 175, 375e379.
Bullmore, E., & Sporns, O. (2009). Complex brain networks: Graph theoretical analysis of structural and functional systems.
Nature Reviews Neuroscience, 10(3), 186e198.https://doi.org/
10.1038/nrn2575.
Caligiore, D., Mannella, F., Arbib, M. A., & Baldassarre, G. (2017). Dysfunctions of the basal ganglia-cerebellar-cortical system produce motor tics in Tourette syndrome.PLOS Computational Biology, 13(3).https://doi.org/10.1371/journal.pcbi.1005395. e1005395.
Cath, D. C., Hedderly, T., Ludolph, A. G., Stern, J. S., Murphy, T., Hartmann, A., et al. (2011). European clinical guidelines for Tourette syndrome and other tic disorders. Part I: Assessment.
European Child and Adolescent Psychiatry, 20(4), 155e171.https://
doi.org/10.1007/s00787-011-0164-6.
Cavanna, A. E., Black, K. J., Hallett, M., & Voon, V. (2017). Neurobiology of the premonitory urge in Tourette's syndrome: Pathophysiology and treatment implications.Journal of Neuropsychology Clinical North, 29(2), 95e104.https://doi.org/
10.1176/appi.neuropsych.16070141.
Comings, D. E., Himes, J. A., & Comings, B. G. (1990). An epidemiological study of Tourette's syndrome in a single
school district.Journal of Clinical Psychiatry, 51(11), 463e469.
Conners, C. K. (2008).The Conners 3rd edition (Conners 3). North
Tonawanda: Multi-Health system.
Cook, P. A., Bai, Y., Seunarine, K. K., Hall, M. G., Parker, G. J., & Alexander, D. C. (2006). Camino: Open-Source diffusion-MRI
reconstruction and processing. In14th Scientific Meeting of the
International Society for Magnetic Resonance in Medicine(Vol. 14, p.
2759).
Deckersbach, T., Chou, T., Britton, J. C., Carlson, L. E., Reese, H. E., Siev, J., et al. (2014). Neural correlates of behavior therapy for Tourette׳s disorder.Psychiatry Research Neuroimaging, 224(3),
269e274.https://doi.org/10.1016/j.pscychresns.2014.09.003.
Draganski, B., Martino, D., Cavanna, A. E., Hutton, C., Orth, M., Robertson, M. M., et al. (2010). Multispectral brain
morphometry in Tourette syndrome persisting into adulthood.Brain, 133(12), 3661e3675.https://doi.org/10.1093/
brain/awq300.
Draper, A., Jackson, G. M., Morgan, P. S., & Jackson, S. R. (2015). Premonitory urges are associated with decreased grey matter thickness within the insula and sensorimotor cortex in young people with Tourette syndrome.Journal of Neuropsychology, 10(1), 143e153.https://doi.org/10.1111/jnp.12089.
Du, J.-C., Chiu, T.-F., Lee, K.-M., Wu, H.-L., Yang, Y.-C., Hsu, S.-Y., et al. (2010). Tourette syndrome in children: An updated review.Pediatrics and Neonatology, 51(5), 255e264.https://
doi.org/10.1016/S1875-9572(10)60050-2.
Freeman, R. D., Fast, D. K., Burd, L., Kerbeshian, J., Robertson, M. M., & Sandor, P. (2000). An international perspective on Tourette syndrome: Selected findings from 3,500 individuals in 22 countries.Developmental Medicine and Child Neurology, 42(7), 436e447.
https://doi.org/10.1111/j.1469-8749.2000.tb00346.x.
Friman, O., Farneb€ack, G., & Westin, C.-F. (2006). A Bayesian approach for stochastic white matter tractography.IEEE Transactions on Medical Imaging, 25(8), 965e978.https://doi.org/
10.1109/TMI.2006.877093.
Garrison, K. A., Scheinost, D., Finn, E. S., Shen, X., & Todd, R. (2015). The (in)stability of functional brain network measures across thresholds.Neuroimage, 118, 651e661.https://doi.org/
10.1016/j.neuroimage.2015.05.046.
Gong, G., He, Y., Concha, L., Lebel, C., Gross, D. W., Evans, A. C., et al. (2009). Mapping anatomical connectivity patterns of human cerebral cortex using in vivo diffusion tensor imaging tractography.Cerebral Cortex, 19(3), 524e536.https://doi.org/
10.1093/cercor/bhn102.
Govindan, R. M., Makki, M. I., Wilson, B. J., Behen, M. E., & Chugani, H. T. (2010). Abnormal water diffusivity in
corticostriatal projections in children with tourette syndrome.
Human Brain Mapping, 31(11), 1665e1674.https://doi.org/
10.1002/hbm.20970.
Greene, D. J., Williams, A. C., III, Koller, J. M., Schlaggar, B. L., Black, K. J., & Consortium, T. neuroimaging. (2017). Brain structure in pediatric Tourette syndrome.Molecular Psychiatry, 22, 972e980.https://doi.org/10.1038/mp.2016.194.
Hayhow, B. D., Hassan, I., Looi, J. C. L., Gaillard, F., Velakoulis, D., & Walterfang, M. (2013). The neuropsychiatry of hyperkinetic movement disorders: Insights from neuroimaging into the neural circuit bases of dysfunction.Tremor Other Hyperkinet
Mov, 1e13.https://doi.org/10.7916/D8SN07PK.
Humphries, M., Gurney, K., & Prescott, T. (2006). The brainstem reticular formation is a small-world, not scale-free, network.
Proceedings of the Royal Society B Biological Sciences, 273(1585),
503e511.https://doi.org/10.1098/rspb.2005.3354.
Jackson, S. R., Parkinson, A., Jung, J., Ryan, S. E., Morgan, P. S., Hollis, C., et al. (2011). Compensatory neural reorganization in Tourette syndrome.Current Biology, 21(7), 580e585.https://
doi.org/10.1016/j.cub.2011.02.047.
Jackson, S. R., Parkinson, A., Pears, S. L., & Nam, S.-H. (2011). Effects of motor intention on the perception of somatosensory events: A behavioural and functional magnetic resonance imaging study.Quarterly Journal of Experimental Psychology, 64(5), 839e854.https://doi.org/10.1080/17470218.2010.529580. Jeppesen, S. S., Debes, N. M., Simonsen, H. J., Rostrup, E.,
Larsson, H. B. W., & Skov, L. (2014). Study of medication-free children with Tourette syndrome do not show imaging abnormalities.Movement Disorders, 29(9), 1212e1216.https://
doi.org/10.1002/mds.25858.
Kalanithi, P. S., Zheng, W., Kataoka, Y., DiFiglia, M., Grantz, H., Saper, C. B., et al. (2005). Altered parvalbumin-positive neuron distribution in basal ganglia of individuals with Tourette syndrome.Proceedings of the National Academy of Sciences of the USA, 102(37), 13307e13312.https://doi.org/10.1073/
pnas.0502624102.
Kane, M. J. (1994). Premonitory urges as“Attentional Tics”in Tourette's syndrome.Journal of the American Academy of Child and Psychiatry, 33(6), 805e808.https://doi.org/10.1097/
00004583-199407000-00005.
Kataoka, Y., Kalanithi, P. S., Grantz, H., Schwartz, M. L., Saper, C., Leckman, J. F., et al. (2010). Decreased number of parvalbumin and cholinergic interneurons in the striatum of individuals with tourette syndrome.Journal of Comparative Neurology, 518(3), 277e291.https://doi.org/10.1002/cne.22206. Kelly, C., Toro, R., Di Martino, A., Cox, C. L., Bellec, P.,
Castellanos, F. X., et al. (2012). A convergent functional architecture of the insula emerges across imaging modalities.
Neuroimage, 61(4), 1129e1142.https://doi.org/10.1016/
j.neuroimage.2012.03.021.
Kruschwitz, J. D., List, D., Waller, L., Rubinov, M., & Walter, H. (2015). GraphVar: A user-friendly toolbox for comprehensive graph analyses of functional brain connectivity.Journal of Neuroscience methods, 245, 107e115.https://doi.org/10.1016/
j.jneumeth.2015.02.021.
Kumar, R., Nguyen, H. D., Macey, P. M., Woo, M. A., & Harper, R. M. (2012). Regional brain axial and radial diffusivity changes during development.Journal of Neuroscience Research, 90(2),
346e355.https://doi.org/10.1002/jnr.22757.
Kwak, C., Dat Vuong, K., & Jankovic, J. (2003). Premonitory sensory phenomenon in Tourette's syndrome.Movement Disorders, 18(12), 1530e1533.https://doi.org/10.1002/mds.10618. Le Bihan, D. (2003). Looking into the functional architecture of the
brain with diffusion MRI.Nature Reviews Neuroscience, 4,
469e480.https://doi.org/10.1038/nrn1119.
Leckman, J. F. (2002). Tourette's syndrome.Lancet, 360, 1577e1587.
https://doi.org/10.1016/S0140-6736(02)11526-1.
Leckman, J. F., Riddle, M. A., Hardin, M. T., Ort, S. I., Swartz, K. L., Stevenson, J., et al. (1989). The Yale global tic severity scale: Initial testing of a clinician-rated scale of tic severity.Journal of the American Academy of Child and Adolescent Psychiatry, 28(4),
566e573.https://doi.org/10.1097/00004583-198907000-00015.
Leckman, J. F., Walker, D. E., & Cohen, D. J. (1993). Premonitory urges in Tourette's syndrome.American Journal of Psychiatry, 150(1), 98e102.https://doi.org/10.1176/ajp.150.1.98.
Liu, Y., Miao, W., Wang, J., Gao, P., Yin, G., Zhang, L., et al. (2013). Structural abnormalities in early Tourette syndrome children: A combined voxel-based morphometry and tract-based spatial statistics study.Plos One, 8(9), 1e11.https://doi.org/
10.1371/journal.pone.0076105.
Ludolph, A. G., Juengling, F. D., Libal, G., Ludolph, A. C., Fegert, J. M., & Kassubek, J. (2006). Grey-matter abnormalities in boys with Tourette syndrome: Magnetic resonance imaging
study using optimised voxel-based morphometry.The British
Journal of Psychiatry, 188, 484e485.
Makki, M. I., Behen, M. E., Bhatt, A., Wilson, B., & Chugani, H. T. (2008). Microstructural abnormalities of striatum and thalamus in children with tourette syndrome.Movement Disorders, 23(16), 2349e2356.https://doi.org/10.1002/
mds.22264.
Makki, M. I., Govindan, R. M., Wilson, B. J., Behen, M. E., & Chugani, H. T. (2009). Altered fronto-striato-thalamic connectivity in children with Tourette syndrome assessed with diffusion tensor MRI and probabilistic fiber tracking.
Journal of Child Neurology, 669e678.https://doi.org/10.1177/
0883073808327838.
Maslov, S., & Sneppen, K. (2002). Specificity and stability in topology of protein networks.Science, 296, 910e913.https://
doi.org/10.1126/science.1065103.
Mayka, M. A., Corcos, D. M., Leurgans, S. E., & Vaillancourt, D. E. (2006). Three-dimensional locations and boundaries of motor and premotor cortices as defined by functional brain imaging: A meta-analysis.Neuroimage, 31(4), 1453e1474.https://doi.org/
10.1016/j.neuroimage.2006.02.004.
McCairn, K. W., Iriki, A., & Isoda, M. (2013). Global dysrhythmia of cerebro-basal ganglia-cerebellar networks underlies motor Tics following striatal disinhibition.The Journal of Neuroscience, 33(2),
697e708.https://doi.org/10.1523/JNEUROSCI.4018-12.2013.
Mink, J. W. (2001). Basal ganglia dysfunction in Tourette's syndrome: A new hypothesis.Pediatric Neurology, 25(3),
190e198.https://doi.org/10.1016/S0887-8994(01)00262-4.
Mori, S., & Van Zijl, P. C. M. (2002). Fiber tracking: Principles and strategiesea technical review.NMR in Biomedicine, 15(7e8),
468e480.https://doi.org/10.1002/nbm.781.
Nixon, E., Glazebrook, C., Hollis, C., & Jackson, G. M. (2014). Reduced Tic symptomatology in Tourette syndrome after an acute bout of exercise: An observational study.Behavior Modification, 38(2), 235e263.https://doi.org/10.1177/
0145445514532127.
Nomoto, F., & Machiyama, Y. (1990). An epidemiological study of
tics.Japanese Journal of Psychiatry and Neurology, 44, 649e655.
Nucifora, P. G. P., Verma, R., Lee, S., & Melhem, E. R. (2007). Diffusion-tensor MR imaging.Radiology, 245(2), 367e384.
https://doi.org/10.1148/radiol.2452060445.
Orth, M., & Rothwell, J. C. (2009). Motor cortex excitability and comorbidity in Gilles de la Tourette syndrome.Journal of Neurology Neurosurgery and Psychiatry, 80(1), 29e34.https://
doi.org/10.1136/jnnp.2008.149484.
Patrick, H. T. (1905). Convulsive tic.JAMA, 6, 437e442.https://
doi.org/10.1001/jama.1905.92500330005001a. XLIV.
Peterson, B. S., Thomas, P., Kane, M. J., Scahill, L. D., Zhang, H., Bronen, R., et al. (2003). Basal ganglia volumes in patients with
Gilles de la Tourette syndrome.Arch Gen Psychiatry, 60(4),
415e424.https://doi.org/10.1001/archpsyc.60.4.415.
Plessen, K. J., Gru¨ner, R., Lundervold, A., Hirsch, J. G., Xu, D., Bansal, R., et al. (2006). Reduced white matter connectivity in the corpus callosum of children with Tourette syndrome.
Journal of Child Psychology and Psychiatry, 47(10), 1013e1022.
https://doi.org/10.1111/j.1469-7610.2006.01639.x.
Plessen, K. J., Wentzel-Larsen, T., Hugdahl, K., Feineigle, P., Klein, J., Staib, L. H., et al. (2004). Altered interhemispheric connectivity in individuals with Tourette's disorder.American Journal of Psychiatry, 161(11), 2028e2037.https://doi.org/
10.1176/appi.ajp.161.11.2028.
Prodoehl, J., Yu, H., Little, D. M., Abraham, I., & Vaillancourt, D. E. (2008). Region of interest template for the human basal ganglia: Comparing EPI and standardized space approaches.
Neuroimage, 39(3), 956e965.https://doi.org/10.1016/
j.neuroimage.2007.09.027.
Rosario, M. C., Prado, H. S., Borcato, S., Diniz, J. B., Shavitt, R. G.,
Hounie, A. G., et al. (2009). Validation of the university of s~ao
Paulo sensory phenomena scale: Initial psychometric
properties.CNS Spectrums, 14(6), 315e323.
Rubinov, M., & Sporns, O. (2010). Complex network measures of brain connectivity: Uses and interpretations.Neuroimage, 52(3), 1059e1069.https://doi.org/10.1016/
j.neuroimage.2009.10.003.
Rueckert, D., Sonoda, L. I., Hayes, C., Hill, D. L. G., Leach, M. O., & Hawkes, D. J. (1999). Nonrigid registration using free-form deformations: Application to breast MR images.IEEE Transactions on Medical Imaging, 18(8), 712e721.https://doi.org/
10.1109/42.796284.
Saporta, A. S. D., Chugani, H. T., Juhasz, C., Makki, M. I., Muzik, O., Wilson, B. J., et al. (2010). Multimodality neuroimaging in Tourette syndrome: Alpha-[ 11 C]Methyl-L-Tryptophan positron emission tomography and diffusion tensor imaging studies.Journal of Child Neurology, 336e342. Retrieved from
http://www.ncbi.nlm.nih.gov/pubmed/19749182.
Scahill, L., Riddle, M. A., McSwiggin-Hardin, M., Ort, S. I., King, R. A., Goodman, W. K., et al. (1997). Children's Yale-Brown obsessive compulsive Scale: Reliability and validity.
Journal of the American Academy of Child and Adolescent Psychiatry, 36(6), 844e852.
https://doi.org/10.1097/00004583-199706000-00023.
Silk, T., Chen, J., Seal, M., & Vance, A. (2013). White matter abnormalities in pediatric obsessive-compulsive disorder.
Psychiatry ResearcheNeuroimaging, 213(2), 154e160.https://
doi.org/10.1016/j.pscychresns.2013.04.003.
Silk, T. J., Vance, A., Rinehart, N., Bradshaw, J. L., & Cunnington, R. (2009). White-matter abnormalities in attention deficit hyperactivity disorder: A diffusion tensor imaging study.
Human Brain Mapping, 30(9), 2757e2765.https://doi.org/
10.1002/hbm.20703.
Smith, S. M. (2002). Fast robust automated brain extraction.
Human Brain Mapping, 17(3), 143e155.https://doi.org/10.1002/
hbm.10062.
Smith, S. M., Jenkinson, M., Johansen-Berg, H., Rueckert, D., Nichols, T. E., Mackay, C. E., et al. (2006). Tract-based spatial statistics: Voxelwise analysis of multi-subject diffusion data.
Neuroimage, 31(4), 1487e1505.https://doi.org/10.1016/
j.neuroimage.2006.02.024.
Smith, S. M., Jenkinson, M., Woolrich, M. W., Beckmann, C. F., Behrens, T. E. J., Johansen-Berg, H., et al. (2004). Advances in functional and structural MR image analysis and
implementation as FSL.Neuroimage, 23(Suppl. 1), S208eS219.
https://doi.org/10.1016/j.neuroimage.2004.07.051.
Neuroimage, 17(3), 1429e1436.https://doi.org/10.1006/
nimg.2002.1267.
Sowell, E. R., Kan, E., Yoshii, J., Thompson, P. M., Bansal, R., Xu, D., et al. (2008). Thinning of sensorimotor cortices in children with Tourette syndrome.Nature Neuroscience, 11(6), 637e639.
https://doi.org/10.1038/nn.2121.
Tallur, K., & Minns, R. A. (2010). Tourette's syndrome.Paediatrics and Child Health, 20(2), 88e93.https://doi.org/10.1016/
j.paed.2009.10.010.
Tamm, L., Barnea-Goraly, N., & Reiss, A. L. (2012). Diffusion tensor imaging reveals white matter abnormalities in attention-deficit/hyperactivity disorder.Psychiatry Researche Neuroimaging, 202(2), 150e154.https://doi.org/10.1016/
j.pscychresns.2012.04.001.
Tinaz, S., Malone, P., Hallett, M., & Horovitz, S. G. (2015). Role of the right dorsal anterior insula in the urge to tic in tourette syndrome.Movement Disorders.https://doi.org/10.1002/
mds.26230. Epub ahead.
Watts, D. J., & Strogatz, S. H. (1998). Collectivedynamics of“ small-world”networks.Nature, 393(6684), 440e442.https://doi.org/
10.1038/30918.
Wechsler, D. (1999).Wechsler abbreviated scale of intelligence. San
Antonio TX: The Psychological Corporation.
Wen, H., Liu, Y., Rekik, I., Wang, S., Zhang, J., Zhang, Y., et al. (2017). Disrupted topological organization of structural networks revealed by probabilistic diffusion tractography in Tourette syndrome children.Human Brain Mapping, 0(56),
1e21.https://doi.org/10.1002/hbm.23643.
Winkler, A. M., Ridgway, G. R., Webster, M. A., Smith, S. M., & Nichols, T. E. (2014). Permutation inference for the general linear model.Neuroimage, 92, 381e397.https://doi.org/10.1016/
j.neuroimage.2014.01.060.
Wolff, N., Luehr, I., Sender, J., Ehrlich, S., Schmidt-Samoa, C., Dechent, P., et al. (2016). A DTI study on the corpus callosum of treatment-naı¨ve boys with“pure”Tourette syndrome.
Psychiatry ResearcheNeuroimaging, 247, 1e8.https://doi.org/
10.1016/j.pscychresns.2015.12.003.
Woods, D. W., Piacentini, J. C., Himle, M. B., & Chang, S. (2005). Premonitory urge for tics scale (PUTS): Initial psychometric results and examination of the premonitory urge
phenomenon in youths with tic disorders.Journal of
Developmental and Behavioral Pediatrics, 26(6), 397e403. Worbe, Y., Gerardin, E., Hartmann, A., Valabregue, R., Chupin, M.,
Tremblay, L., et al. (2010). Distinct structural changes underpin clinical phenotypes in patients with Gilles de la Tourette syndrome.Brain, 133(12), 3649e3660.https://doi.org/
10.1093/brain/awq293.
Worbe, Y., Malherbe, C., Hartmann, A., Pelegrini-Issac, M., Messe, A., Vidailhet, M., et al. (2012). Functional immaturity of cortico-basal ganglia networks in Gilles de la Tourette syndrome.Brain, 135(6), 1937e1946.https://doi.org/10.1093/
brain/aws056.
Worbe, Y., Marrakchi-Kacem, L., Lecomte, S., Valabregue, R., Poupon, F., Guevara, P., et al. (2015). Altered structural connectivity of cortico-striato-pallido-thalamic networks in Gilles de la Tourette syndrome.Brain, 138(2), 472e482.https://
doi.org/10.1093/brain/awu311.
Xu, D., Hao, X., Bansal, R., Plessen, K. J., Geng, W., Hugdahl, K., et al. (2007). Unifying analyses of anatomical and diffusion tensor images using volume-preserved warping.Journal of Magnetic Resonance Imaging, 25(3), 612e624.https://doi.org/
10.1002/jmri.20858.
Zhang, Y., Brady, M., & Smith, S. (2001). Segmentation of brain MR images through a hidden Markov random field model and the expectation-maximization algorithm.IEEE Transactions on Medical Imaging, 20(1), 45e57.https://doi.org/10.1109/
42.906424.
Zohar, A. H., Apter, A., King, R. A., Pauls, D. L., Leckman, J. F., & Cohen, D. J. (1999). Epidemiological studies. In J. F. Leckman, &
D. J. Cohen (Eds.),Tourette's syndrome-tics, obsessions and
compulsions: Developmental pathology and clinical care(pp.
177e193). New York: Wiley.