Contracting institutions and development
17
0
0
Full text
(2) REVIEW OF ECONOMICS AND INSTITUTIONS, Vol. 3, Issue 3 - Fall 2012, Article 3. 1 Introduction The impact of institutional quality on economic development has been the focus of a great deal of recent empirical work. Knack and Keefer (1995), Hall and Jones (1999), Easterly and Levine (2003) and Rodrik et al. (2004) have all looked to establish the robustness of the connection between institutional quality and economic development; Beck (2010) is a recent and thorough survey of the literature. Following North (1981), Acemoglu and Johnson (2005) considered two types of institutions: Those that affect transaction costs and the costs of forming contracts (‘contracting institutions’) and those that determine the security of private property (‘property rights institutions’). Using historical data to instrument for and distinguish between each type of institution, Acemoglu and Johnson (2005, henceforth AJ) concluded that the quality of property rights institutions can be robustly related to various economic outcomes, particularly income per capita, while contracting institutions in general cannot. This paper explores the impact of contracting institutions in more depth and contributes to our understanding of the role of historical determinants in economic development more generally (see the survey paper, Nunn, 2009). We show that higher quality contracting institutions decrease income per capita. This finding is consistent across the proxies and instruments used in AJ and is robust to the introduction of a number of controls. It also holds when we expand the range of proxies for contracting institutions to include some more recent data from Djankov et al. (2008). One interpretation is that the costs of sustaining good contracting institutions are themselves significant, and that those costs can sometimes dominate the gains that low transaction costs deliver to the rest of the economy. We present some evidence to support this interpretation: Net gains from good contracting institutions are found when property rights institutions are also good, but not when property rights are of poor quality. The study of the costs of institutions relative to their gains would appear to be an important topic for future research. In Section 2 we describe the data and empirical strategy. Section 3 shows that, in the cross-section, the effect of better contracting institutions is to reduce income per capita. In Section 4 we check the robustness of these results against some newer data for contracting institutions, and present results from regressions conditioning on other potential determinants of income. In Section 5 we look to understand some parts of these results and propose an interpretation based on the costs of contracting institutions. Section 6 offers some concluding remarks.. 2 Estimating the Effect of Contracting Institutions This paper follows AJ in distinguishing between property rights and contracting institutions. There are a number of reasons to think that each Copyright c 2012 University of Perugia Electronic Press. All rights reserved. 2.
(3) Trew: Contracting Institutions and Development. type of institution could determine economic outcomes. The transaction cost literature after Coase (1960) and Williamson (2000) argues that poor contracting institutions limit the ability of private agents to settle disputes, to diversify against risks, to form large markets and to choose optimal organizational structures. Contracting institutions, in this view, are directly related with income levels and growth rates. Alongside contracting institutions, the importance for development of securing property rights has been raised by De Soto (2001), while the potential economic consequences of the power of minority elites has been put forcefully by Acemoglu and Robinson (2006). The quality of property rights institutions should also, then, be expected to affect economic outcomes. In order to isolate a separate role for each type of institution, AJ estimate, using instrumental variables, the following model: Yi = β0 + β1 Ci + β2 Pi + β3 Zi + ε. (1). where Yi is the 1995 level of log GDP per capita in country i, Ci denotes the measure of contracting institutions in country i, Pi the measure of property rights institutions, and Zi can be a vector of control variables. We first use the six proxies of institutional quality used in AJ and then consider alternatives in Section 4. The three proxies for the quality of contracting institutions are measures of the number of procedures and of procedural complexity from World Bank (2004), and an index of legal formalism from Djankov et al. (2003). For property rights, we employ the measure of protection against expropriation averaged over 1985-1995 used in Knack and Keefer (1995), a 1990s average of the constraint on executive power from Polity IV (2006), and a measure of the degree of protection of private property from Gwartney and Lawson (1997). OLS regressions using the institutional proxies reveal significant univariate correlations between institutional proxies and income per capita, investment to GDP ratio and stock market capitalization and the ratio of private credit to GDP (AJ, Table 2). Better contracting and a greater degree of security of rights over property can be associated, at least on a simple level, with better economic outcomes. We could proceed to use a multivariate OLS approach and estimate the effect of contracting institutions when controlling for property rights. An immediate problem in interpreting such results is that both sets of institutional proxies are likely endogenous, so reverse causality or the effect of omitted variables could be showing up in the OLS coefficients. Moreover, likely measurement error in the proxies introduces downward bias to the estimated coefficients and, where they are correlated, that variable measured with greatest error will appear less significant. AJ addresses both issues by establishing that historical data from colonial settlements can be used with legal origins data to instrument separately for each type of institution. The instrument for contracting institutions is a dummy variable for whethttp://www.rei.unipg.it/rei/article/view/82. 3.
(4) REVIEW OF ECONOMICS AND INSTITUTIONS, Vol. 3, Issue 3 - Fall 2012, Article 3. her the country has a civil or common law tradition. The legal origins literature, such as La Porta et al. (1998), argues that an historical tradition of common law is correlated with institutions that better enforce private contracts. Djankov et al. (2003) show the strong connection between legal origin and their measure for legal formalism. The instruments for property rights institutions are the mortality rates of colonial settlers and population density in each country in year 1500. Acemoglu et al. (2001) showed that higher mortality rates meant that settlers were more likely to install extractive institutions with greater centralisation of power in a governing elite. Acemoglu et al. (2002) found that colonial settlers who found dense local populations were more likely to establish authoritarian systems of governance. The firststage regressions are thus: Ci = α0 + α1 Li + α2 Mi + ν1 Pi = δ0 + δ1 Li + δ2 Mi + ν2. (2) (3). where Li is the dummy variable equal to one if country i has a common law tradition and where Mi is either the log of population density in 1500 in country i or the log of the mortality rate of the European settlers that arrived in country i. The first stage regressions for testing the validity of these instruments in separating out each type of institution are given in AJ Table 3. The legal origins instrument is significantly correlated with proxies for contracting institutions, but not with those for property rights. The settlement data is significantly correlated with proxies for property rights institutions, and not with those for contracting institutions.1 The use of both instruments in the 2SLS procedure thus enables AJ to isolate the separate effects of each type of institution of economic outcomes.. 3 Empirical Results Table 1 reports the 2SLS results based on the following second-stage regression (having conducted first-stage regressions (2)-(3)): Yi = β0 + β1 Ci + β2 Pi + ε.. (4). All permutations of the three proxies for each type of institution, one instrument for contracting and two instruments for property rights institutions are reported in Table 1. The dependent variable is the log of the level of per capita GDP in 1995. Because of the nature of the instruments, results are restricted to the sample of former colonies.2 Panel A refers to results using the log of population density in 1500 as an instrument for property rights institutions; Panel B gives results using 1. Specifically, AJ regress each of the six institutional proxies on legal origin with log settler mortality and legal origin with log population density. The explanatory power of the Copyright c 2012 University of Perugia Electronic Press. All rights reserved. 4.
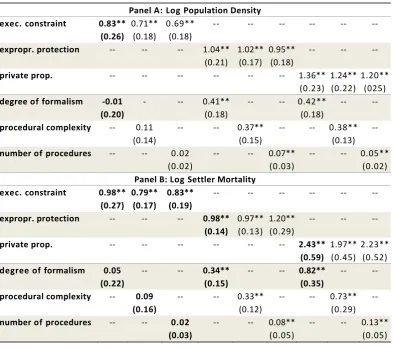
(5) Trew: Contracting Institutions and Development. Table 1 - Institutions and Log GDP Per Capita in 1995 (Second Stage Results) exec. constraint expropr. protection private prop. degree of formalism procedural complexity number of procedures. exec. constraint expropr. protection private prop. degree of formalism procedural complexity number of procedures. Panel A: Log Population Density 0.83** 0.71** 0.69** ----(0.26) (0.18) (0.18) ---1.04** 1.02** 0.95** -(0.21) (0.17) (0.18) ------- 1.36** (0.23) -0.01 -0.41** --- 0.42** (0.20) (0.18) (0.18) -0.11 --0.37** --(0.14) (0.15) --0.02 --0.07** -(0.02) (0.03) Panel B: Log Settler Mortality 0.98** 0.79** 0.83** ----(0.27) (0.17) (0.19) ---0.98** 0.97** 1.20** -(0.14) (0.13) (0.29) ------- 2.43** (0.59) 0.05 --0.34** --0.82** (0.22) (0.15) (0.35) -0.09 --0.33** --(0.16) (0.12) --0.02 --0.08** -(0.03) (0.05). --. --. --. --. 1.24** 1.20** (0.22) (025) --0.38** -(0.13) -0.05** (0.02) --. --. --. --. 1.97** 2.23** (0.45) (0.52) --0.73** -(0.29) -0.13** (0.05). N.B. Results in bold are those reported in AJ. ** and * denote significance at 5 and 10% respectively. Numbers in parentheses are robust standard errors. Results are for the sample of former colonies. The instrument for contracting institution is always a dummy variable equal to one for each English colony. The number of observations varies between 51 and 69 according to data availability for each proxy and each instrument.. the log of settler mortality. In all regressions, the instrument for contracting institutions is a dummy variable for whether the country has a civil or common law history. In each cell the left (right) hand numbers are the coefficients on the respective contracting (property rights) institution. Regressions reported in AJ are here in bold.3 As can be seen in Table 1, the results for the relationship between property rights institutions and log GDP per capita are significant and of the expected sign for all permutations of proxies and instruments. This is the finding of AJ: More secure property rights, and greater constraints on executive power, have a first order and positive instruments is generally strong (median R2 = 0.37). One limitation of using historical instruments based on colonial settlements is that our IV estimates must be based on the sub-sample comprised of former colonies. AJ Table 2 report univariate regressions of log GDP per capita in 1995 on each of the proxies for institutions; the coefficients on each proxy do not vary significantly across samples. 3 Estimates are slightly different here because we use data from a more recent revision of the Penn World Table, see Heston et al. (2009). 2. http://www.rei.unipg.it/rei/article/view/82. 5.
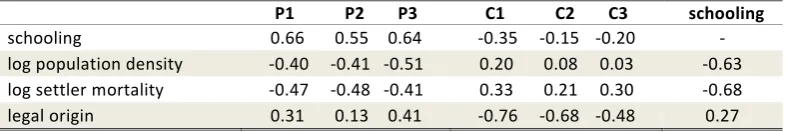
(6) REVIEW OF ECONOMICS AND INSTITUTIONS, Vol. 3, Issue 3 - Fall 2012, Article 3. impact on income per capita. AJ did not stress, however, the two regressions which reported a positive and significant coefficient on the degree of formalism. When we expand the number of regressions to all permutations, we see that contracting institutions can more generally be related robustly with worsening incomes per capita. In all regressions except those where the degree of executive constraint is used as a proxy for property rights, the contracting institution is a significant determinant of log GDP per capita. The sign of this relationship is, however, unexpected. The coefficient on contracting institutions is always positive (except for a –0.01). Countries with more complex or more lengthy contractual processes appear to have higher per capita incomes. This effect also appears to be large, quantitatively: On average, a one standard deviation increase in the quality of contracting institutions leads to a 0.75 standard deviation decrease in the log of GDP per capita (though this is smaller than the 1.36 standard deviation impact that property rights institutions are estimated to have).4 Before considering how to interpret this result, we first present a number of robustness tests.. 4 Robustness Checks We present results when we condition on a large number of additional variables and also consider some more recently published proxies for contracting institutions from Djankov et al. (2008). First, we consider the influential critique of Glaeser et al. (2004) in the context of this paper.. 4.1. The Glaeser et al. (2004) Critique. In an influential study, Glaeser et al. (2004) questioned the validity of the colonial origins instruments as employed in AJ. A key argument is that the instruments used to identify the robust effects of property rights institutions are correlated with the error term of the regression equation; in particular, that they are strongly correlated with current levels of human capital (as measured by average school years from Barro and Lee, 1996). In other words, it is not plausible that the only thing colonial settlers left behind was the quality of institutions. While the Glaeser et al. analysis is principally concerned with the property rights institutions, Table 2 reports correlations with schooling for both forms of institutions, where P1-3 (C1-3) are the proxies for the quality of property rights (contracting) institutions. The correlation between human capital and the instruments for property rights is stronger than the correlation between the instruments and the property rights proxies themselves. This is the Glaeser et al. problem: A 2SLS approach that excludes human capital has the potential to make prop4. The quantitative impact is calculated by taking the average of the significant coefficients for each proxy and then averaging across proxies for each type of institution. Copyright c 2012 University of Perugia Electronic Press. All rights reserved. 6.
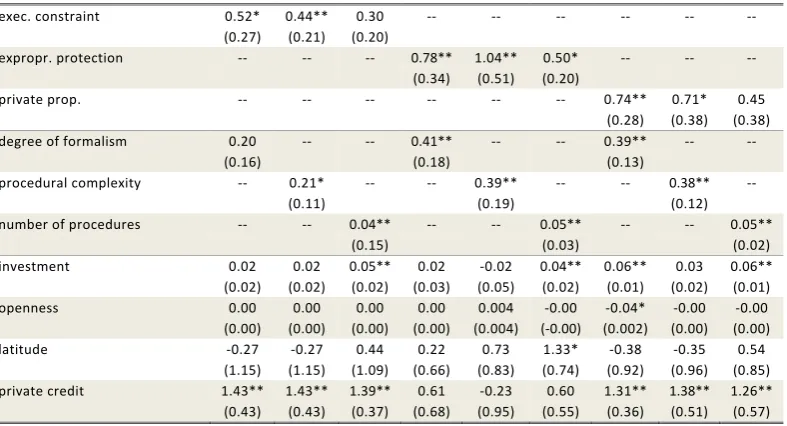
(7) Trew: Contracting Institutions and Development. Table 2 - Instruments and Human Capital, pairwise correlations schooling log population density log settler mortality legal origin. P1 0.66 -0.40 -0.47 0.31. P2 0.55 -0.41 -0.48 0.13. P3 0.64 -0.51 -0.41 0.41. C1 -0.35 0.20 0.33 -0.76. C2 C3 -0.15 -0.20 0.08 0.03 0.21 0.30 -0.68 -0.48. schooling -0.63 -0.68 0.27. N.B. Results are for the sample of former colonies. Legal origin is a dummy variable equal to one for each English legal tradition. Schooling is average years of schooling over the period 1960–2000. P1 is average expropriation; P2 is constraint on the executive; P3 is security of property rights. C1 is legal formalism; C2 is procedural complexity; C3 is number of procedures. See Table A.1 for detailed variable descriptions.. erty rights institutions appear more significant than they truly are. Unfortunately, as Bhattacharyya (2009) has shown, severe multicollinearity in the second stage regressions means that an attempt to condition on and instrument for human capital in estimating the effect of property rights institutions leaves no individual significance among institutional and human capital variables. Bhattacharyya shows that by exploiting the time-variation in the quality of some forms of institutions identification can proceed using the dynamic panel estimation à la Blundell and Bond (1998). Human capital and property rights institutions can then be shown to have separate and significant roles in explaining variations in growth. Unfortunately, available proxies for contracting institutions are not sufficient for such a panel approach. However, Table 2 demonstrates that the cross-country proxies for contracting institutions and legal origin do not suffer from the problem that Glaeser, et al. identify. Schooling and legal origin are less strongly related than any correlation between legal origin and the contracting proxies. Since AJ showed that this set of instruments succeeds in distinguishing between the two forms of institutional environments, it is not so surprising that the Glaeser et al. critique can only be applied to one of those types. Since the focus of this paper is on the role of contracting institutions, we bear in mind a more careful interpretation of the coefficients on property rights institutions but proceed along the same lines as AJ. Moreover, we omit human capital as a control variables in tests of robustness in Section 4.. 4.2. Results with Control Variables. Table 3 gives second-stage results of 2SLS estimates based on equation second; i.e., of the effect of institutions when we control for a number of other potential determinants of long-run growth, using log population density as the instrument for property rights institutions. In particular, we control for the investment share of real GDP and real openness from Heston et al. (2009), each averaged over 1985–2004 in constant 2005 prices. We also control for the 1985–2004 average ratio of private credit to GDP from Beck et al. (2000) and, in addition, include absolute latitude from La Porta et al. (1999). Although this measure of geography is a simple one, we use http://www.rei.unipg.it/rei/article/view/82. 7.
(8) REVIEW OF ECONOMICS AND INSTITUTIONS, Vol. 3, Issue 3 - Fall 2012, Article 3. it for comparability with AJ. Alternative measures of geography, such as of disease, endowments, distance from coastlines, climate and sanitary conditions, could be better proxies (see Sachs, 2003; Presbitero, 2006). Auer (2012) finds that the estimated importance of institutions are mildly biased when fuller measures of geographical endowments are incorporated in 2SLS regressions of the sort employed here. The wider debate about whether institutions dominate geographical factors in their importance for long-run economic outcomes (cf. Acemoglu and Robinson, 2012; Diamond, 2012; Sachs, 2012) is beyond the scope of this paper. Table 3 - Second Stage Results for Institutions, with Control Variables exec. constraint. 0.52* (0.27) --. 0.44** (0.21) --. 0.30 (0.20) --. --. --. --. --. --. procedural complexity. 0.20 (0.16) --. --. number of procedures. --. 0.21* (0.11) --. 0.02 (0.02) 0.00 (0.00) -0.27 (1.15) 1.43** (0.43). 0.02 (0.02) 0.00 (0.00) -0.27 (1.15) 1.43** (0.43). expropr. protection private prop. degree of formalism. investment openness latitude private credit. 0.04** (0.15) 0.05** (0.02) 0.00 (0.00) 0.44 (1.09) 1.39** (0.37). --. --. --. --. --. --. 0.78** (0.34) --. 1.04** (0.51) --. 0.50* (0.20) --. --. --. --. 0.41** (0.18) --. --. --. 0.71* (0.38) --. 0.45 (0.38) --. --. --. 0.38** (0.12) --. --. --. 0.39** (0.19) --. 0.74** (0.28) 0.39** (0.13) --. 0.02 (0.03) 0.00 (0.00) 0.22 (0.66) 0.61 (0.68). -0.02 (0.05) 0.004 (0.004) 0.73 (0.83) -0.23 (0.95). 0.06** (0.01) -0.04* (0.002) -0.38 (0.92) 1.31** (0.36). 0.03 (0.02) -0.00 (0.00) -0.35 (0.96) 1.38** (0.51). 0.05** (0.03) 0.04** (0.02) -0.00 (-0.00) 1.33* (0.74) 0.60 (0.55). 0.05** (0.02) 0.06** (0.01) -0.00 (0.00) 0.54 (0.85) 1.26** (0.57). N.B. ** and * denote significance at 5 and 10% respectively. Numbers in parentheses are robust standard errors. Results are for the sample of former colonies. Control variables are investment share of GDP, real openness, absolute latitude and private credit to GDP. The instrument for contracting institution is always a dummy variable equal to one for each English colony; that for property rights is always log population density in 1500. The number of observations varies between 55 and 65 according to data availability for each proxy and each instrument.. As can be seen by the results in Table 3, our previous conclusions about the interactions between GDP per capita and institutions are robust to conditioning on these additional variables. Coefficients on proxies for contracting institutions are very similar to those found in the baseline results. The coefficients on contracting institutions when executive constraint is used are now positive and sometimes significant. Overall, the quantitative impact is slightly smaller: The effect of a one standard deviation change in contracting institutions is to decrease GDP per capita by 0.50 standard deviations. The coefficients on proxies for property rights institutions are now smaller and sometimes insignificant (the overall quantitative impact is now 0.76 standard deviations). It appears that the effect of the conditioning variables is to confirm the effect of contracting institutions and weaken slightly the role that property rights institutions play. Again, we see that better property rights institutions lead to higher GDP per capita while higher quality contracting institutions reduce the level of GDP per capita. Copyright c 2012 University of Perugia Electronic Press. All rights reserved. 8.
(9) Trew: Contracting Institutions and Development. 4.3. Djankov et al. (2008) Debt Enforcement Data. Djankov et al. (2008) present survey responses from 88 countries regarding a hypothetical case study of an hotel company called ‘Mirage’. Lawmakers are questioned about the likely legal outcome for the company when it is unable to pay its single creditor. Responses include data on the likely time it takes between default and final decision and the time between default and payments to the creditor. Using private sector lending rates, reported likely time and expected costs, Djankov et al. (2003) also calculate a measure of efficiency, the present value of the eventual worth of the firm after costs. Each of these variables can be considered as proxies for the quality of contracting institutions. Table 4 gives first stage results when we consider each of these variables against potential instruments in the sample of former colonies. Table 4 - First Stage Regressions for Djankov et al. (2008) Contracting Institutions legal origin log mortality log pop. density R2 Obs.. efficiency 0.34** 0.30** (0.07) (0.07) --0.08** (0.03) -0.02 -(0.02) 0.50 0.56 35 32. time -2.24** -2.23** (0.34) (0.39) -0.03 (0.14) 0.06 -(0.08) 0.45 0.43 35 32. time to pay -2.09** -2.08 (0.35) (0.41) --0.005 (0.14) 0.06 -(0.09) 0.43 0.39 35 32. N.B. ** and * denote significance at 5 and 10% respectively. Numbers in parentheses are robust standard errors. All regressions are based on the 35 former colonies with Djankov et al. (2008) data.. Legal origin is a dummy equal to one when the country has an English legal history. The efficiency variable is that in Djankov et al. (2008) divided by 100. The sample sizes are smaller than before, but it is clear that legal origin still works as a strong instrument across all of the proxies, with significant coefficients of the expected sign5 and good explanatory power. Moreover, log population density is not significantly correlated with any of the proxies. We can thus use the approach employed in Section 2 to separate out the effects of the different types of institutions. Table 5 reports the second stage of 2SLS results using the three new proxies for contracting institutions with the property rights enforcement measure. The effect of property rights institutions on the level of GDP per capita is as found previously (after all, this is a sub-sample of data that we already know to exhibit that relationship). In addition, and despite the small sample size, Table 5 shows that results for the quality of contracting institution using the new proxies are in line with those when using the set of proxies from AJ: An economy characterized by better contracting institutions appears to have lower long-run growth. 5. Note that the efficiency variable is a measure of contractual quality, while time and time to pay are measures of contractual impediments, so we expect different signs.. http://www.rei.unipg.it/rei/article/view/82. 9.
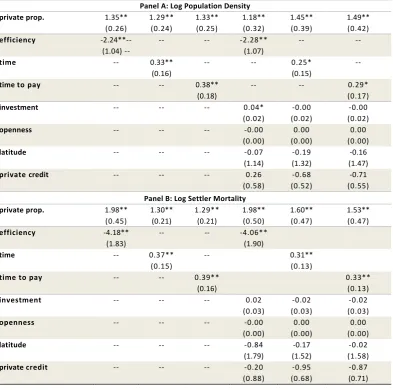
(10) REVIEW OF ECONOMICS AND INSTITUTIONS, Vol. 3, Issue 3 - Fall 2012, Article 3. Table 5 - Second Stage Results with Djankov et al. (2008), with and without Controls private prop. efficiency time. 1.35** (0.26) -2.24**-(1.04) ---. time to pay. --. investment. --. openness. --. latitude. --. private credit. --. private prop.. 1.98** (0.45) -4.18** (1.83) --. efficiency time time to pay. --. investment. --. openness. --. latitude. --. private credit. --. Panel A: Log Population Density 1.29** 1.33** 1.18** (0.24) (0.25) (0.32) ---2.28** (1.07) 0.33** --(0.16) -0.38** -(0.18) 0.04* --(0.02) -0.00 --(0.00) -0.07 --(1.14) 0.26 --(0.58) Panel B: Log Settler Mortality 1.30** 1.29** 1.98** (0.21) (0.21) (0.50) ---4.06** (1.90) 0.37** -(0.15) -0.39** (0.16) 0.02 --(0.03) -0.00 --(0.00) -0.84 --(1.79) -0.20 --(0.88). 1.45** (0.39) --. 1.49** (0.42) --. 0.25* (0.15) --. --. -0.00 (0.02) 0.00 (0.00) -0.19 (1.32) -0.68 (0.52). 0.29* (0.17) -0.00 (0.02) 0.00 (0.00) -0.16 (1.47) -0.71 (0.55). 1.60** (0.47). 1.53** (0.47). 0.31** (0.13). -0.02 (0.03) 0.00 (0.00) -0.17 (1.52) -0.95 (0.68). 0.33** (0.13) -0.02 (0.03) 0.00 (0.00) -0.02 (1.58) -0.87 (0.71). N.B. ** and * denote significance at 5 and 10% respectively. Numbers in parentheses are robust standard errors. Results are for the sample of former colonies. Control variables are investment share of GDP, real openness, absolute latitude and private credit to GDP. The instrument for contracting institution is always a dummy variable equal to one for each English colony. The number of observations varies between 30 and 32. The efficiency variable is that in Djankov et al. (2008) divided by 100.. Copyright c 2012 University of Perugia Electronic Press. All rights reserved. 10.
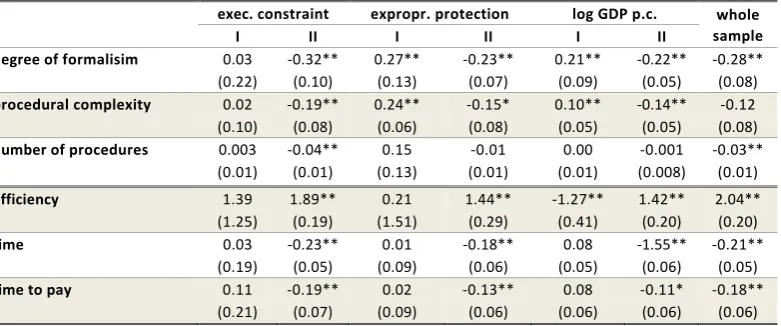
(11) Trew: Contracting Institutions and Development. 5 The Costs of Institutions The relationship between contracting institutions and the level of GDP per capita does appear as a puzzle. The simplest explanation would be to interpret the contracting proxies as measures of a greater sophistication in the contracting environment – contracts might be more complex where more complex, higher value-added goods are traded; the number of procedures may be greater when there is greater specialization of the legal sector among those procedures; and so on. This would support Wallis and North (1986), which found that what they define as the ‘transaction sector’ roughly doubled as a proportion of US GDP from 1870 to 1970.6 North (1993) has recently argued that greater wealth changes the nature of exchange, increasing the complexity of the firm and making investments in contracting institutions a more important part of economic activity. AJ present evidence against this interpretation of our results, however. In their §VI it is shown that all the proxies for contracting institutions used in this paper are aligned with firm-level responses from managers asked specifically about impediments to doing business. The data suggest, then, that better contracting institutions can reduce the level of per capita income. We might start to understand this in the context of a model where the costs of contracting are endogenous to investments made into the institutions that facilitate transactions. This echoes Coase (1992, p.716), who argues that “a large part of what we think of as economic activity is designed to accomplish what high transaction costs would otherwise prevent.” A similar argument has been formalized in a general equilibrium framework of endogenous transaction costs and diversification against risk (see Nolan and Trew, 2011). Total transaction costs are part ex ante investments in technologies that reduce the costs of exchange and part ex post cost of making individual exchanges happen. One interpretation is that when all countries in our sample are taken together, the gains from investments in contracting institutions are outweighed by their costs. This is more plausible in contracting institutions than in property rights institutions: An elite that decides not to expropriate private property can do so at little or no cost; in contrast, maintaining a high quality legal system to enforce individual contractual arrangements can represent a prolonged drain on state revenues. If sufficient gains from lowering transaction costs are not realised, investments in contracting institutions can have deleterious economic consequences. Whether the costs of contracting institutions are outweighed by the economic gains they engender might be dependent on a number of other factors. As a first step, Table 6 presents results from OLS regressions of log GDP per capita on each measure of the quality of contracting institutions, stratified by the quality of property rights institutions and by income per capita. These results can only be suggestive 6. See also the survey in Klaes (2008).. http://www.rei.unipg.it/rei/article/view/82. 11.
(12) REVIEW OF ECONOMICS AND INSTITUTIONS, Vol. 3, Issue 3 - Fall 2012, Article 3. Table 6 - OLS Correlations with 1995 log GDP per Capita, by Quantile. degree of formalisim procedural complexity number of procedures efficiency time time to pay. exec. constraint I II 0.03 -0.32** (0.22) (0.10) 0.02 -0.19** (0.10) (0.08) 0.003 -0.04** (0.01) (0.01) 1.39 (1.25) 0.03 (0.19) 0.11 (0.21). 1.89** (0.19) -0.23** (0.05) -0.19** (0.07). expropr. protection I II 0.27** -0.23** (0.13) (0.07) 0.24** -0.15* (0.06) (0.08) 0.15 -0.01 (0.13) (0.01) 0.21 (1.51) 0.01 (0.09) 0.02 (0.09). 1.44** (0.29) -0.18** (0.06) -0.13** (0.06). log GDP p.c. I II 0.21** -0.22** (0.09) (0.05) 0.10** -0.14** (0.05) (0.05) 0.00 -0.001 (0.01) (0.008). whole sample -0.28** (0.08) -0.12 (0.08) -0.03** (0.01). -1.27** (0.41) 0.08 (0.05) 0.08 (0.06). 2.04** (0.20) -0.21** (0.05) -0.18** (0.06). 1.42** (0.20) -1.55** (0.06) -0.11* (0.06). N.B. Results are for the entire sample of countries. Each column I reports estimates from the sample of countries less than or equal to the median value of the variable noted at the top of the column, with each column II being the sample of countries with a (non-missing) value greater than the median. ** and * denote significance at 5 and 10% respectively. Numbers in parentheses are robust standard errors.. of an explanation for the results in Sections 2 and 4 and the data are not sufficient to conduct IV estimation on subsamples of former colonies.7 Table 6 shows results from splitting the sample of countries into those with high or low quality property rights institutions as well as OLS results on the whole sample. The results suggest that better contracting institutions benefit long-run growth only when property rights are also good. This holds for all proxies used in this paper. In the sample of countries with low quality property rights, the coefficients on contracting institutions are, when significant, of the opposite sign. A similar pattern is seen when we split the sample into rich and poor countries; contracting institutions appear to have a positive effect when the country is already wealthy (this is perhaps not so surprising, given the strong, positive impact that property rights have been found to have on development). While it should be treated with caution because of the sample size, this interpretation of the evidence is a natural one. When investments are likely to be expropriated, or when constraints on the executive are weak, the ease with which contracts can be written or enforced with counterparties is less relevant for economic development. When executive constraints are secure, investments in contracting institutions can translate into economic growth.. 6 Concluding Remarks As difficult to interpret as these results are, they are based on an established cross-country dataset of proxies for institutional quality and the identification strategy has been used in many other contexts to support the idea 7. This appears to be a sample size problem; neither type of institutions are consistently significant when we split the samples and instrument in the manner of Section 2. Copyright c 2012 University of Perugia Electronic Press. All rights reserved. 12.
(13) Trew: Contracting Institutions and Development. that institutions are of fundamental importance. The interpretation in terms of contracting institutions is largely suggestive, and no doubt other interpretations exist; as Rodrik et al. (2004, p.153) states, ‘an instrument does not a theory make’. Nonetheless, the results do raise questions that point in a number of potentially fruitful research directions. First, the costs of institutions are little stressed and would seem here to be essential to understanding the interaction between the quality of contracting institutions and economic development. Second, the factors which determine whether the gains from good institutions are realised are likely to be complex. Further research is required to develop a more thorough understanding of both the positive and negative consequences of good contracting institutions. Part of the problem in both the theory and measurement of the relationship between contracting institutions and economic outcomes is in defining what transaction costs are; that is, where should we look to find the gains from better contracting institutions? We have suggested that transaction costs can be thought of as part ex ante investments in technologies that reduce the costs of exchange and part ex post costs of exchange themselves. The macroeconomic conception of a transaction sector, as in Wallis and North (1986), may be too broad while the measurement of the legal costs involved in bilateral relationships, as in Djankov et al. (2008), may be too narrow. For theoretical analyses, we need to understand, more generally, whether treating the costs of exchange as endogenous to private decisions about investments in institutions really does make a difference to the qualitative implications of models that typically invoke exogenous transaction costs. Clearly, these findings suggest that we place greater stress on the costs associated with contracting institutions. What is missing is evidence of the net gains that supporting high quality contracting institutions might bring. Given the limitations of the cross-country data, we leave a search for those net gains to future research.. http://www.rei.unipg.it/rei/article/view/82. 13.
(14) REVIEW OF ECONOMICS AND INSTITUTIONS, Vol. 3, Issue 3 - Fall 2012, Article 3. References Acemoglu, D., Johnson, S., 2005. Unbundling Institutions. Journal of Political Economy 113, 949-995. Acemoglu, D., Johnson, S., Robinson, J.A., 2001. The Colonial Origins of Comparative Development: An Empirical Investigation. American Economic Review 91, 1369-1401. Acemoglu, D., Johnson, S., Robinson, J.A., 2002. Reversal of Fortune: Geography and Institutions in the Making of the Modern World Income Distribution. Quarterly Journal of Economics 117, 1231-1294. Acemoglu, D., Robinson, J.A., 2006. Economic Origins of Democracy and Dictatorship. Cambridge University Press. Acemoglu, D., Robinson, J.A., 2012. Why Nations Fail. Profile Books. Auer, R., 2012. Geography, Institutions, and the Making of Comparative Development. CESifo Working Paper 3874. Barro, R., Lee, J.W., 1996. International Measures of Schooling Years and Schooling Quality. American Economic Review: Papers and Proceedings 86, 218-223. Beck, T., 2010. Legal Institutions and Economic Development. CentER Discussion Paper 2010-94, Tilburg University. Beck, T., Demirgüç-Kunt, A., Levine, R., 2000. A New Database on Financial Development and Structure. World Bank Economic Review 14, 597605. May 2009 revision. The dataset is updated at the World Bank Finance Research website, http://econ.worldbank.org/. Bhattacharyya, S., 2009. Unbundled Institutions, Human Capital and Growth. Journal of Comparative Economics 37, 106-120. Blundell, R., Bond, S., 1998. Initial Conditions and Moment Restrictions in Dynamic Panel Data Models. Journal of Econometrics 87, 115-143. Coase, R.H., 1960. The Problem of Social Cost. Journal of Law and Economics 3, 1-44. Coase, R.H., 1992. The Institutional Structure of Production. American Economic Review 82, 713-719. De Soto, H., 2001. The Mystery of Capital. Black Swan. Diamond, J., 2012. What Makes Countries Rich or Poor? New York Review of Books, June 7, 2012. Copyright c 2012 University of Perugia Electronic Press. All rights reserved. 14.
(15) Trew: Contracting Institutions and Development. Djankov, S., Hart, O., McLiesh, C., Shleifer, A., 2008. Debt Enforcement Around the World. Journal of Political Economy 116, 1105-1149. Djankov, S., La Porta, R., Lopez-de Silanes, F., Shleifer, A., 2003. Courts. Quarterly Journal of Economics 118, 453-517. Easterly, W., Levine, R., 2003. Tropics, Germs and Crops: How Endowments Influence Economic Development. Journal of Monetary Economics 50, 339. Glaeser, E.L., La Porta, R., Lopez-de Silanes, F., Shleifer, A., 2004. Do Institutions Cause Growth? Journal of Economic Growth 9, 271-303. Gwartney, J.D., Lawson, R., 1997. Economic Freedom of the World: 1997 Annual Report. Heritage Foundation. Hall, R.E., Jones, C.I., 1999. Why Do Some Countries Produce So Much More Output Per Worker Than Others? Quarterly Journal of Economics 114, 83-116. Heston, A., Summers, R., Aten, B., 2009. Penn World Table Version 6.3. Center for International Comparisons of Production, Income and Prices at the University of Pennsylvania. Klaes, M., 2008. The History of Transaction Costs. The New Palgrave Dictionary of Economics, 2nd Edition. Durlauf, S.N., Blume. L.E., (Eds.), Palgrave Macmillan. Knack, S., Keefer, P., 1995. Institutions and Economic Performance: CrossCountry Tests Using Alternative Institutional Measures. Economics and Politics 7, 207-227. La Porta, R., Lopez-de Silanes, F., Shleifer, A., 1999. The Quality of Government. Journal of Law, Economics and Organization 15, 222-279. La Porta, R., Lopez-de Silanes, F., Shleifer, A., Vishny, R.W., 1998. Law and Finance. Journal of Political Economy 106, 1113-1155. Nolan, C., Trew, A.W., 2011. Transaction Costs and Institutions. Centre for Dynamic Macroeconomic Analysis Working Paper No. 1103. North, D.C., 1981. Structure and Change in Economic History. Norton. North, D.C., 1993. Institutions, Transaction Costs and Productivity in the Long Run. prepared for the Eighth World Productivity Congress, Stockholm, Sweden. Nunn, N., 2009. The Importance of History for Economic Development. Annual Review of Economics 1, 65-92. http://www.rei.unipg.it/rei/article/view/82. 15.
(16) REVIEW OF ECONOMICS AND INSTITUTIONS, Vol. 3, Issue 3 - Fall 2012, Article 3. Polity IV 2006. Polity IV Annual Time-Series 1800-2007. Integrated Network for Societal Conflict Research (INSCR), Center for Systemic Peace. Available at http://www.systemicpeace.org/inscr/inscr.htm. Presbitero, A.F., 2006. Institutions and Geography as Sources of Economic Development. Journal of International Development 18, 351-378. Rodrik, D., Subramanian, A., Trebbi, F., 2004. Institutions Rules: The Primacy of Institutions over Geography and Integration in Economic Development. Journal of Economic Growth 9, 131-165. Sachs, J.D., 2003. Institutions Don’t Rule: Direct effects of geography on per capita income. NBER Working Paper No. 9490. Sachs, J.D., 2012. Government, Geography, and Growth. Foreign Affairs, September/October 2012. Wallis, J.J., North, D.C., 1986. Measuring the Transaction Sector in the American Economy, 1870-1970. Chapter 3 in Engerman, S.L., Gallman, R.E., (Eds.). Long-Term Factors in American Economic Growth. University of Chicago Press. Williamson, O.E., 2000. The New Institutional Economics: Taking Stock, Looking Ahead. Journal of Economic Literature 38, 595-613. World Bank 2004. Doing Business in 2004: Understanding Regulation. Oxford University Press.. Copyright c 2012 University of Perugia Electronic Press. All rights reserved. 16.
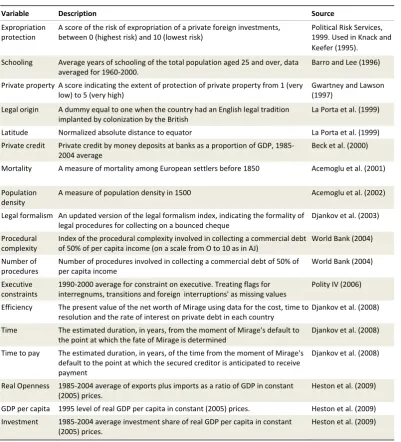
(17) Trew: Contracting Institutions and Development. Table A.1 - List of Variables and Sources Variable. Description. Source. Expropriation protection. A score of the risk of expropriation of a private foreign investments, between 0 (highest risk) and 10 (lowest risk). Political Risk Services, 1999. Used in Knack and Keefer (1995).. Schooling. Average years of schooling of the total population aged 25 and over, data averaged for 1960-2000.. Barro and Lee (1996). Private property A score indicating the extent of protection of private property from 1 (very low) to 5 (very high). Gwartney and Lawson (1997). Legal origin. A dummy equal to one when the country had an English legal tradition implanted by colonization by the British. La Porta et al. (1999). Latitude. Normalized absolute distance to equator. La Porta et al. (1999). Private credit. Private credit by money deposits at banks as a proportion of GDP, 19852004 average. Beck et al. (2000). Mortality. A measure of mortality among European settlers before 1850. Acemoglu et al. (2001). Population density. A measure of population density in 1500. Acemoglu et al. (2002). Legal formalism An updated version of the legal formalism index, indicating the formality of Djankov et al. (2003) legal procedures for collecting on a bounced cheque Procedural complexity. Index of the procedural complexity involved in collecting a commercial debt World Bank (2004) of 50% of per capita income (on a scale from O to 10 as in AJ). Number of procedures. Number of procedures involved in collecting a commercial debt of 50% of per capita income. World Bank (2004). Executive constraints. 1990-2000 average for constraint on executive. Treating flags for interregnums, transitions and foreign `interruptions' as missing values. Polity IV (2006). Efficiency. The present value of the net worth of Mirage using data for the cost, time to Djankov et al. (2008) resolution and the rate of interest on private debt in each country. Time. The estimated duration, in years, from the moment of Mirage's default to the point at which the fate of Mirage is determined. Time to pay. The estimated duration, in years, of the time from the moment of Mirage's Djankov et al. (2008) default to the point at which the secured creditor is anticipated to receive payment. Real Openness. 1985-2004 average of exports plus imports as a ratio of GDP in constant (2005) prices.. Heston et al. (2009). GDP per capita. 1995 level of real GDP per capita in constant (2005) prices.. Heston et al. (2009). Investment. 1985-2004 average investment share of real GDP per capita in constant (2005) prices.. Heston et al. (2009). http://www.rei.unipg.it/rei/article/view/82. Djankov et al. (2008). 17.
(18)
Figure

+4
Related documents
Department of Educational Leadership & Policy Studies Higher Education and Cultural Studies Program 427 Farish Hall Houston, Texas 77204-5029 Contact Information Work
the franchise disclosure document. 50 Such a requirement may present issues for the lender, particularly when information provided directly to the lender by the franchisor serves
In 21 models we tested, by means of linear regression, both the direct effects of the social capital variables (cognitive, relational and structural social capital) on the
Technical Requirements., 5.3 Telecommunications Support: , subparagraph A at page 14 of the RFP.] “Please provide any statistics available regarding current MACD
The stunning collapse of a pair of western Canadian banks, a number of major Canadian trust companies and several insurance companies, as well as some other precarious near misses
The respondents recognized the negative impact of agricultural land expansion and settlement on the ecosystem such as the provision of wild food, livestock feed,
In this Agreement, "Sof tware" means the program modules and f eatures of the Juniper or Juniper-supplied sof tware, f or which Customer has paid the applicable license
