ANALYTICAL METHOD DEVELOPMENT AND VALIDATION OF
NIFEDIPINE IN FORMULATION BY RP-HPLC
Tejaswini*, Ch. M. M. Pradada Rao and D. Dhachinamoorthi
Department of Pharmaceutical Analysis and Quality Assurance, QIS College of Pharmacy,
Ongole-523272.
ABSTRACT
The developed method was a simple, efficient, economical method for
the Validation of Nifedipine reverse phase high pressure liquid
chromatography and UV spectrophotometer. For Nifedipine Impurities
Chromatography was performed on Intersil C18-column (4.6×250mm,
5µm) with mobile phase TBH: Acetonitrile 25:75 (v/v) at a flow rate
of 1.0 mL/min and eluents were monitored at 238 nm The percent
recoveries ranged between 92.1 – 108.2 %,. RSD for all Parameters are
within the acceptance. The method could be successfully used for the
analysis Nifidepine in both API and Marketed tablet formulations.
KEYWORDS: Nifidipine, TBH, Acetonitrile, Intersil, API.
INTRODUCTION
Nifedipine is the prototype of the dihydropyridine family of calcium channel blocker.[1,2]
Chemically it 1, 4-dihydro-2, 6-dimethyl-4-(2-nirophenyl)-3,5-pyridine dicarboxylic acid
dimethyl ester.[3,4,5] In general, the dihydropyridine-type calcium-channel antagonists have
more prominent effects on vasodilation and coronary flow than do diltiazem and
verapamil6,7,8. Combined use of atenolol with nifedipine decrease the rate, conduction and
contractility of heart particularly in patients of ventricular or conduction abnormalities by
decreasing peripheral vascular resistance.[9,10,11] The chemical structures of the assayed
compounds are given below.
Volume 7, Issue 1, 1075-1085. Research Article ISSN 2277– 7105
Article Received on 10 Nov. 2017,
Revised on 20 Nov. 2017, Accepted on 30 Dec. 2017
DOI: 10.20959/wjpr20181-10542
*Corresponding Author
Tejaswini
Department of
Pharmaceutical analysis
and Quality Assurance,
QIS college of Pharmacy,
Fig: 1. Chemical structures of nifedipine.
The proposed method was optimized and validated in accordance with International
Conference on Hormonization (ICH) guidelines.[12,13,14] The aim of present work is to
develop a simple, rapid, precise, accurate and selective reversed phase chromatographic
method and to estimate the Nifedipine in bulk and its solid dosage forms.
MATERIALS AND METHODS
The reference sample of Nifedipine standard was supplied as gift sample by Cipla Ltd,
Vikroli West, Mumbai, India and Ajanta Pharmaceutical, Mumbai, India, respectively. All
the chemicals were of analytical grade. Acetonitrile (HPLC grade) was used of Merck
Pharmaceuticals Private Ltd., Mumbai, India. TBH used was of HPLC grade and purchased
from Loba Chemicals. Commercial Tablets of Nifedipine procured from local market.mg are
manufactured by Hetero drugs Pvt. Ltd. Hyderabad, A.P. The liquid chromatographic system
was of Perkin Elmer (USA), series 200, which consisted of following components: a gradient
pump, variable wavelength programmable UV/Vis detector, a manual injection facility with
20 μl fixed loop. The chromatographic analysis was performed using Total Chrom Navigator
version 6.3 software on a HiQ Sil C8- 250×4.6 mm, particle size 5μm column.
Preparation ofmobile phase
The Mobile phase contains TBH: Acetonitrile 25:75 (v/v) was prepared by mixing250 ml of
TBH solution and Acetonitrile 750 ml. The above solution was filtered through 0.22µm nylon
membrane filter and degassed by sonication.
Preparation of Drug and standard stock solutions
Accurately 10 mg of Nifidepine weighed and taken in 10 ml volumetric flask. Dissolved by
sonication in 5 ml of Diluent (and then diluted to 10 ml with the Diluent to get 1000μg/ml
standard stock solution. 1ml of the above standard stock solution was taken in 100 ml
Nifidepine. Then it was filtered through membrane filter paper. The Standard stock was
prepared in the range 5-25µg/ml. The solutions were injected under the above
chromatographic conditions and peak areas were measured.
Preparation of Sample solution
Ten tablets (ANGIFINE-SR) were accurately weighed and crushed into a fine powder. The
powder equivalent to one tablet (10 mg of ANGIFINE-SR) was taken in 100 ml volumetric
flask. About 75 ml diluents was added and sonicated for 20mins with intermediate shaking.
Then the volume was finally made up to the mark (100 ml). Sample solution was filtered
through whatman filter paper to get a clear solution. Then solution was used as final sample
solution of a concentration of 10 μg/ml.
Preparation of tetra butyl ammonium hydrogen sulphate (10 mM): 3.3954 grams of tetra
butyl ammonium hydrogen sulphate (10 mM) was accurately weighed and dissolved in
HPLC grade water in a 1000 mL volumetric flask (pH 3.37).
Chromatographic Run: Standard solution of Nifidepine was loaded in the injector; enter
the HPLC parameters were entered as per table the method was saved, injected and run for 8
min.
Selection of Wavelength
Appropriate dilution was prepared using standard stock solution of 10µg/ml ofNifidepine.
The solution were scanned over range of 400-200nm, using medium scan speed. The sampling wavelength for analysis includes,
[image:3.595.151.448.577.747.2] Absorption maxima (λmax) ofNifidepine= 238nm.
CALIBRATION CURVES FOR Nifedipine
Several aliquots of standard stock solution (0.5, 1, 1.5, 2, 2.5 ml) of ANGIFINE-SR were
taken in different 10 ml volumetric flask and diluted up to the mark with Diluents. Evaluation
was performed with UV detector at 238 nm and Peak area was recorded for all the peaks and
a calibration graph was obtained by plotting peak area versus concentration of
ANGIFINE-SR. The plot of peak area of each sample against respective concentration was found to be
linear in the range of 2-10 μg/ml with correlation coefficient of 0.999 and linear regression
equation being Y=605213 X+426937.5.
Fig: 2. Calibration curve for nifedipine.
METHODOLOGY
To optimize the RP-HPLC parameters, The pure drug of nifedipine (NFD) were injected into
the HPLC system and run in different solvent systems. Different mobile phases like methanol
and water, acetonitrile and water were tried in order to find the best conditions for the
separation of nifedipine. It was found that TBH: Acetonitrile 25:75 gives satisfactory results
as compared to other mobile phases. Finally, the optimal composition of the mobile phase
was determined to be TBH: Acetonitrile (25:75v/v). This mobile phase produced good
resolution, reasonable retention times and acceptable peak symmetry for both the drugs.
Using the optimized mobile phase, the flow rate was set to 1.3 ml/min and UV detection was
carried out at 238 nm. The mobile phase and samples were degassed by ultrasonic vibrations
for 20 min and filtered through 0.45μm Nylon, 47 mm membrane filter paper. The table 1
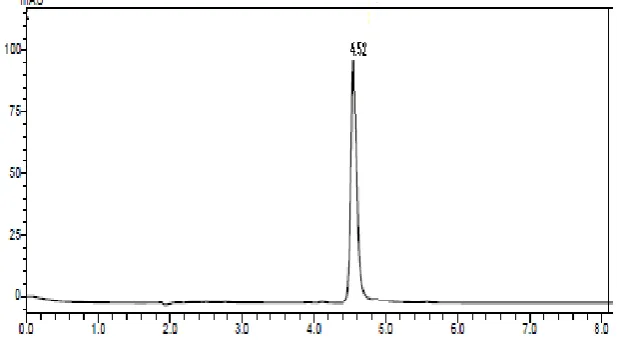
gives the Rt and peak area found in the estimation. Complete resolution of the peaks with
clear baseline was obtained (fig.3). System suitability test parameters for atenolol and
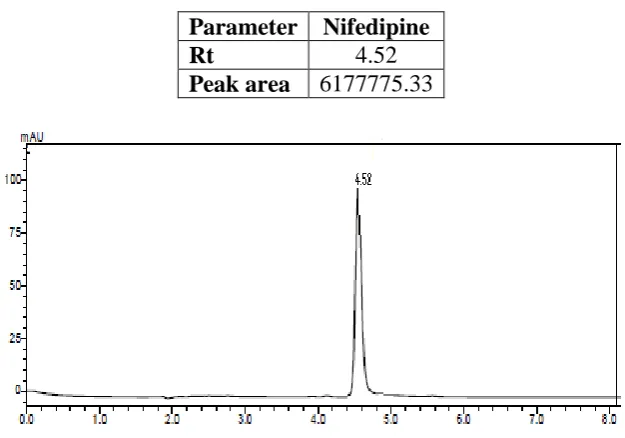
Table: 1 Results of simultaneous estimation of atenolol and nifedipine.
Parameter Nifedipine
Rt 4.52
[image:5.595.176.429.366.438.2]Peak area 6177775.33
Fig: 3. Graph for nifedipine with internal standard.
Table 2: System Suitability Parameters.
Parameter Values Acceptance criteria
Nifedipine
Plate count Tailing factor Capacity factor
2885 0.52 0.42
>2000 ≤ 2.0
>2
Analysis of tablet formulation
Ten tablets were accurately weighed and crushed into a fine powder. The powder equivalent
to one tablet (10 mg of Angifine-SR) was taken in 100 ml volumetric flask. About 75 ml
diluents was added and sonicated for 20mins with intermediate shaking. Then the volume
was finally made up to the mark (100 ml). Sample solution was filtered through whatman
filter paper to get a clear solution. Then solution was used as final sample solution of a
concentration of 10 μg/ml.
The values were tabulated
Table 3: Assay values for the marketed formulation.
S.no Drugs Brand name
Concentratio n in(µg/ml)
Label claim (mg)
Amount Found (mg)
% of
Assay SD MEAN
% of RSD
1
Nifedipine Angifine -SR
10 10 9.98 99.8
0.231 99.88 0.23
2 10 10 9.97 99.7
3 10 10 10.01 100.1
4 10 10 9.96 99.6
5 10 10 9.99 99.9
Fig: 3. Assay of Nifidipine tablets.
Evaluation of analytical method (method validation)
The proposed method has been validated for the simultaneous determination NFD in tablet
dosage form. Calibration curves were constructed by plotting peak areas versus
concentrations of NFD and the regression equations were calculated. The calibration curves
were plotted over the concentration range 2-10 μg/ml μg/ml for NFD. Aliquots (20μl) of each
solution were injected under the operating chromatographic conditions described as above.
I) Linearity
Several aliquots of standard stock solution (0.5, 1, 1.5, 2, 2.5 ml) of Angifine-SR were taken
in different 10 ml volumetric flask and diluted up to the mark with Diluents. Evaluation was
performed with UV detector at 238 nm and Peak area was recorded for all the peaks and a
calibration graph was obtained by plotting peak area versus concentration of ANGIFINE-SR.
The plot of peak area of each sample against respective concentration was found to be linear
in the range of 2-10 μg/ml with correlation coefficient of 0.999 and linear regression equation
being Y=605213 X+426937.5.
Table 4: Linearity of Nifedipine.
S.NO Concentration in µg/ml
Nifedipine Absorbance at 238nm
1. 0 0
2. 2 0.146
3. 4 0.292
4. 6 0.438
5. 8 0.584
6. 10 0.734
Slope: 0.0732 Intercept: -0.000762
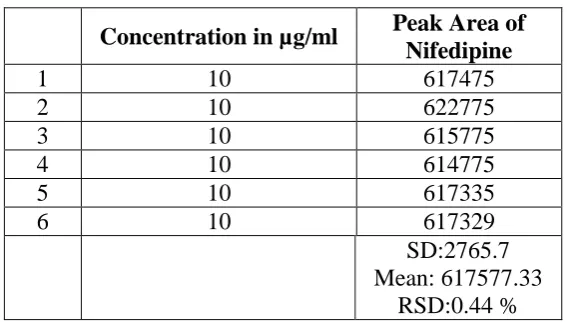
[image:6.595.163.438.598.756.2]II.Precision
Were prepared. All the solutions were analyzed thrice, in order to record any intra- day
variation in the result. The result obtained for intra-day variations are shown in the table 7
and 8. For inter-day variation study, three different concentrations of the combined standards
were analyzed for three days. The result obtained for inter-day variations are shown in the
[image:7.595.156.440.227.388.2]table5 and 6.
Table 5: Intra-day variability of Atenolol.
Concentration in µg/ml Peak Area of Nifedipine
1 10 617475
2 10 622775
3 10 615775
4 10 614775
5 10 617335
6 10 617329
SD:2765.7 Mean: 617577.33
RSD:0.44 %
Table 6: Inter-day variability of Nifedipine.
S.NO Concentration in µg/ml Peak Area of Nifedipine
1 10 617375
2 10 612775
3 10 605775
4 10 614775
5 10 604536
6 10 613544
SD:5144.11 Mean: 611463.3
RSD:0.841 %
III.Accuracy
To check the accuracy of proposed method, level of recovery carried out at 80, 100 and 120
% of the concentration as per standard addition method. To perform recovery studies of the
test concentration, a powder of preanalysed capsule sample containing 10 mg of nifedipine
was weighed such that it should contain 10mg of nifedipine then transferred into 100 ml
volumetric flask, add about 50 ml of methanol and sonicated for 20 min with intermediate
shaking and volume make up to the mark. 40µg/ml nifedipine pure drugs were used as
standard concentrations, finally % recovery was calculated and results and statistical
Table 7: Recovery studies.
% of Recovery
Initial conc. (µg/ml)
Spiked conc.
Total Conc. (µg/ml)
Conc. obtained in Nifedipine
% of Assay
Nifedipine S.D
80%
10 8 18 17.98 99.88889
0.166
10 8 18 18.01 100.0556
10 8 18 17.95 99.72222
100%
10 10 20 19.96 99.8
0.125
10 10 20 19.98 99.9
10 10 20 20.01 100.05
120%
10 12 20 21.96 99.81818
0.228
10 12 20 22.02 100.0909
10 12 20 22.06 100.2727
IV.Specificity
A blend of commonly used excipients was treated as per developed procedure and the
chromatogram showed no inferring peaks at retention time of the both drugs and internal
standard.
Fig 7: Blend of excipients with nifedipine.
V) Robustness
Robustness of the method was determined by carrying out the analysis under conditions
during which mobile phase ratio and ambient temperature were altered. Variations of mobile
phase pH and ratio are seemed to have greater impact on resolution and hence it should be
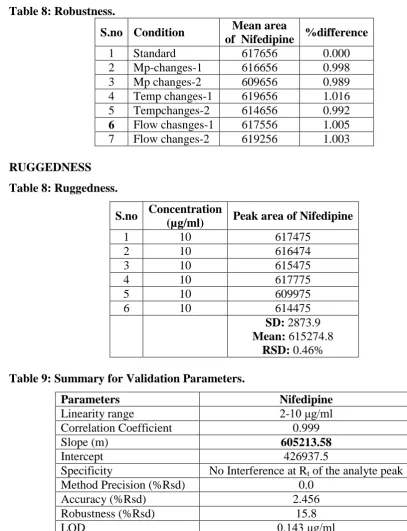
Table 8: Robustness.
S.no Condition Mean area
of Nifedipine %difference
1 Standard 617656 0.000
2 Mp-changes-1 616656 0.998
3 Mp changes-2 609656 0.989
4 Temp changes-1 619656 1.016
5 Tempchanges-2 614656 0.992
6 Flow chasnges-1 617556 1.005
7 Flow changes-2 619256 1.003
[image:9.595.117.479.456.621.2]RUGGEDNESS
Table 8: Ruggedness.
S.no Concentration
(µg/ml) Peak area of Nifedipine
1 10 617475
2 10 616474
3 10 615475
4 10 617775
5 10 609975
6 10 614475
SD: 2873.9
Mean: 615274.8
RSD: 0.46%
Table 9: Summary for Validation Parameters.
Parameters Nifedipine
Linearity range 2-10 μg/ml
Correlation Coefficient 0.999
Slope (m) 605213.58
Intercept 426937.5
Specificity No Interference at Rt of the analyte peak
Method Precision (%Rsd) 0.0
Accuracy (%Rsd) 2.456
Robustness (%Rsd) 15.8
LOD 0.143 μg/ml
LOQ 0.435 μg/ml
RESULTS AND DISCUSSION
A RP-HPLC method was developed and validated for the determination of NFD in tablet
dosage forms on a Intersil C18-column (4.6×250mm, 5µm) with mobile phase TBH:
Acetonitrile 25:75 (v/v) at a flow rate of 1.0 mL/min and eluents were monitored at 238 nm.
The retention times for Nifedipine 4.52 min, respectively. The LOD and the LOQ for
method is sensitive for the determination of Nifedipine and Atenolol The recovery
experiment was performed by the standard addition method The Percentage recovery for
Nifedipine l are ranged between 99.7–100.27 respectively. The results of recovery studies
indicate that the proposed method is highly accurate. The proposed validated method was
successfully applied to determine Nifedipine in their tablet dosage form. The results obtained
for Nifedipine comparable with the corresponding labeled amounts. No interference of the
excipients with the absorbance of interest appeared; hence, the proposed method is applicable
for the routine simultaneous estimation of Nifedipine in pharmaceutical dosage forms. A
simple, linear, accurate, specific and selective RP-HPLC method was developed and
validated for estimation of Nifedipine in their combined dosage form. In this proposed
method the linearity range for both Nifedipine was found to be 2.10 μg/ml with coefficient of
correlation, (r2)=0.999 for Nifedipine at 238 nm. The result of the analysis of pharmaceutical
formulation by the proposed method is highly reproducible and reliable and it is in good
agreement with the label claim of the drug. The method can be used for the routine analysis
of the Nifedipine dosage form without any interference of excipients.
CONCLUSION
In the present investigation, we have developed a simple, sensitive, precise and accurate RP-
HPLC method for the quantitative estimation of Nifedipine in bulk drug and pharmaceutical
formulations and a simple, sensitive, precise and accurate RP-HPLC method for the
simultaneous estimation of Nifedipine in bulk drug and pharmaceutical formulations. These
methods can be used for the routine determination of Nifedipine bulk drug and in
pharmaceutical formulations.
REFERENCES
1. Willard, H.H., Merritt, y L.L. (Jr)., Dean, J.A., Settle, F.A.(Jr)., In; Instrumental Methods
of Analysis, 6th Edn., CBS Publishers, Year, 82,83, 169-172
2. Sharma, Y.R., In; Introduction of Organic Spectroscopy, 4th Edn, CBS Publishers and
Distributors, New Delhi, 1991; 22.
3. Beckett, A.H. and Stenlake, J.B., In; Practical Pharmaceutical Chemistry, 4th Edn., Part
2, CBS Publishers and Distributors, 2002; 290- 300.
4. Skoog, D.A., Holler, F.J., Timothy, A. and Nieman, N.W., In; Principle of Instrumental
Analysis, 3rd Edn., Stanford University, Saunders College Publications, London, 1985;
5. ICH, Q2A, Text on Validation of Analytical Procedures, International Conference on
Harmonization, Geneva, 1-5.
6. ICH, Q2B, Validation of Analytical Procedures: Methodology, International Conference
on Harmonization, Geneva, 1-8.
7. Sethi, P.D., In; Quantitative Analysis of Drugs in Pharmaceutical Formulations, 3rd Edn.,
CBS Publishers and Distributors, New Delhi, 1997; 64.
8. Sethi, P.D., In; HPLC‘High Performance Liquid Chromatography’, Quantitative Analysis
of Pharmaceutical Formulations, 1st Edn., CBS Publishers and. Distributors, New Delhi,
2001; 3-72: 116-120.
9. Jeffery, G.H., Bassette, J., Mendham, J. and Denney, R.C., In; Vogel’s Textbook of
Quantitative Chemical Analysis, 5th Edn., Longman Publication, 1998; 668.
10.Chatwal. G., Anand. K.S., Hi Himalaya Publishing House, 1.1-1.24, 2.566-2.586:
2.624-2.639.
11.www.\An Introduction To Analytical Method Development For Pharmaceutical
Formulations Pharmainfo_net.htm.
12.www.\Analytical Method Development and Validation.htm.
13.www.\Reverse Phase HPLC Basics for LC-MS-IMP.htm.