Microstructures and Mechanical Behaviors of Ti-30Nb-1Fe-
x
Hf Alloys
Yen-Huei Hon
1;*1, Jian-Yih Wang
2and Yung-Ning Pan
1;*21Department of Mechanical Engineering, National Taiwan University Taipei, Taiwan 106, R. O. China 2Materials & Electron-Optics Research Division, Chung-Shan Institute of Science and Technology,
Lung-Tan, Tao-Yuan, Taiwan 325, R. O. China
Effects of iron (1 mass%) and hafnium (1–7 mass%) on the microstructure and mechanical properties of Ti-30Nb base alloys were investigated in this study. Experimental results indicate that the addition of 1 mass% Fe to the Ti-30Nb alloy transforms the originalþþ! structure into a singlephase structure. Accompanying the structure change, both the tensile strength and 0.2% proof stress were reduced by some 15%, while the elastic modulus was reduced from 80 GPa to 68 GPa. Regarding the effect of Hf, precipitation of sporadic!phase in the otherwise completephase structure can be detected when hafnium is added. An addition of just 1 mass% Hf to the Ti-30Nb-1Fe alloy increases the tensile strength and 0.2% proof stress by 32% and 27%, respectively, while slightly decreasing the elastic modulus by some 10%. The Ti-30Nb-1Fe-1Hf alloy has relatively high strength (914MPa T. S.), reasonable ductility (10%El), and an elastic modulus of around 62 GPa. Consequently, the ratio of 0.2% proof stress to elastic modulus increases moderately. The ratio of 0.2% proof stress to elastic modulus of Ti-30Nb-1Fe-1Hf was found to be1:39102, which was around 1.8 times higher than Ti-6Al-4V (0:78102), and around 3.5 times higher than c.p.Ti (0:4102). Hafnium content exceeding 1 mass% gives no further improvement in the ratio of 0.2% proof stress to elastic modulus. From the results obtained here, Ti-30Nb-1Fe-1Hf alloy has excellent potential for orthopedic implant applications.
(Received March 18, 2004; Accepted June 1, 2004)
Keywords: Titanium-niobium-iron-hafnium alloys, microstructure, mechanical properties
1. Introduction
Pure titanium and /-type Ti-6Al-4V ELI alloys are currently widely used as structural biomaterials for replacing failed hard tissues, such as dental implants, artificial hip, shoulder and knee joints, and so on, owing to their excellent specific strength, corrosion resistance and biocompatibility, as well as their freedom from allergy problems. Although Ti-6Al-4V alloy is an acceptable prosthetic biomaterial, recent investigations demonstrated that the release and excessive accumulation of Al and V ions could harm the human body.1–3)Furthermore, the low wear resistance of Ti-6Al-4V could accelerate metal ion release in cementless hip replace-ment, in which case, a surface treatment might be required.4,5) Additionally, although the elastic modulus of Ti-6Al-4V alloy (112 GPa) is significantly lower than that of Co-Cr alloys (210 GPa) or SUS stainless steel (200 GPa) used in biomedical applications,6)it is still considerably higher than that of cortical bones (1030GPa). Therefore, the use of Ti-6Al-4V alloy is vulnerable to premature implant failure. Biomechanical compatibility requires high permissible elastic strain, that is, strength to modulus ratio, and thus an ideal material should have high strength but low modulus. Regarding low modulus, -type titanium alloy is advanta-geous. Low-elastic modulus-type titanium alloys that have already been developed or currently are under development are useful in improving bone healing and remodeling.7)The theoretical studies of Songet al.indicated that elements such as Zr, Nb, Hf, and Ta are favorable not only for increasing the strength, but also for reducing the elastic modulus of bcc Ti.8,9) As for element toxicity, Nb, Hf and Ta are non-toxic elements, and thus are the most suitable alloying elements for
-type titanium alloys. Consequently, the biomedical tita-nium alloys developed recently mainly contain Ti, Nb, Ta, or
Zr.10–13)
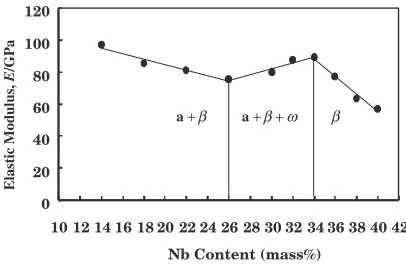
A previous study by the present authors,14)investigated the constitution/phase and mechanical properties characteristics of Ti-Nb binary alloys, which had the Nb content ranging from 14 to 40 mass%. This previous study found that within the Nb range studied, the elastic modulus value first decreases from 14 to 26 mass%Nb, then increases to a maximum at 34 mass%, and finally decreases again with further increase in Nb content, as illustrated in Fig. 1. The elastic moduli of the Ti-Nb alloys are closely related to the alloy phase constitution and crystal structure. The reduction in elastic modulus with increase in Nb from 14 to 26 mass% results from a gradual decrease in the volume fraction of the
phase (or increase in thephase), while the precipitation of the ! phase causes the increase in elastic modulus in the intermediate range of Nb (30 to 34 mass%). Regarding
reduction in stress shielding effect, the Ti-Nb system appears to be a highly suitable implant material owing to its combination of high strength and low modulus. For example, the binary Ti-30 mass%Nb alloy has a 0.2% proof stress of 820 MPa and an elastic modulus of 80 GPa, giving a 0.2%
a +β a +β ω β
0 20 40 60 80 100 120
10 12 14 16 18 20 22 24 26 28 30 32 34 36 38 40 42
Nb Content (mass%)
Elastic Modulus,
E
/GPa
+
Fig. 1 Change in elastic modulus with increase of Nb content in the Ti-Nb alloys.14)
*1Graduate Student, National Taiwan University
*2Corresponding author, E-mail: [email protected]
[image:1.595.324.527.626.758.2]proof stress to the elastic modulus ratio (a criterion for assessing the feasibility an implant material) of up to 1:03102, significantly higher than the commercial pure
titanium (c.p.Ti) (0:40102) and the Ti-6Al-4V alloy
(0:78102).
Iron is a strongeutectoid stabilizer that promotesphase formation in the Ti alloys.15,16)Furthermore, iron is consid-ered to have a relatively good biocompatibility.17) In this work, 1 mass% Fe was added to the base Ti-30Nb alloy to examine its effect on both the microstructure and mechanical properties. On the other hand, hafnium has been found to significantly influence the mechanical properties of Ti-Nb alloy system,18)and hafnium also is biocompatible with the human body.10,11) Therefore, this work introduced Hf (1– 7 mass%) to the base Ti-30Nb-1Fe alloy to investigate its influence on the microstructure and mechanical properties of the alloys of interest.
2. Experimental Procedures
2.1 Alloy preparation
Ti-30Nb-1Fe alloy and Ti-30Nb-1Fe-xHf alloys, with hafnium content ranging from 1 to 7 mass% (in two mass% increments), were prepared using pure titanium (99.7 mass% in purity), pure niobium (99.8 mass% in purity), pure iron (99.98 mass% in purity) and pure hafnium (99.98 mass% in purity). The weighed charge materials (some 400 grams) were placed in a U-shaped water-cooled copper crucible and then melted using a non-consumable tungsten electrode arc in a vacuum chamber. The melting chamber was first evacuated and then purged with argon. An argon pressure of 0.1 MPa was maintained throughout the melting process. The alloys were re-melted four more times to achieve chemical homogeneity.
2.2 Specimen preparation
The solidified Ti-30Nb-1Fe and Ti-30Nb-1Fe-xHf alloy ingots were homogenized at 1273 K for 21.6 ks at a vacuum of better than 0.27 Pa, and then hot-rolled at 1023 K into plates with a thickness of approximately 2 mm. The final rolled specimens were again annealed at 973 K for 3.6 ks, and then furnace cooled to room temperature.
2.3 Metallographic analysis
The microstructures of the prepared specimens were examined after being metallographically polished, and then etched in Keller’s reagent with 2 mL HF/3 mL HCl/5 mL HNO3/190 mL H2O.
2.4 XRD
The phases were analyzed using X-ray diffraction (XRD) at 40 kV and 30 mA. X-ray crystallography was conducted using an Ni-filtered Cu Kradiation source. The phases were identified by matching their characteristic peaks with those in the files of the Joint Committee on Powder Diffraction Standards (JCPDS).
2.5 TEM
TEM thin film specimens were prepared as follows. An Isomet cutter was used to slice the alloys into 1 mm thick
sheets, which were then mechanically ground to a thickness of approximately 0.1 mm. After the sheets were punched into 3 mm diameter discs, the final TEM thin film specimens were prepared using a twin- jet electropolisher with a 10% HClO4
and a 90% ethanol mixture, until perforation. The micro-structures were analyzed and the phases identified with a JEM-4000FX transmission electron microscope at an accel-erating voltage of 400 kV; the point resolution was 0.26 nm.
2.6 Tensile test
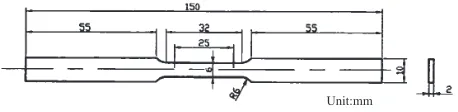
Figure 2 illustrates the dimensions of the tensile speci-mens. Tensile tests of the Ti-30Nb-1Fe-xHf alloys were conducted at room temperature, at a strain rate of 3:33 106m/s. The elastic modulus was determined following the
ASTM E111-97 specification.19)Moreover, the strains were determined using a clip-on extensometer attached to the specimens; the extensometer system was class B-1, accord-ing to the ASTM E83-00 specification.20)For comparisons, tensile tests for c.p.Ti and Ti-6Al-4V were also performed.
3. Results
3.1 Optical microstructures
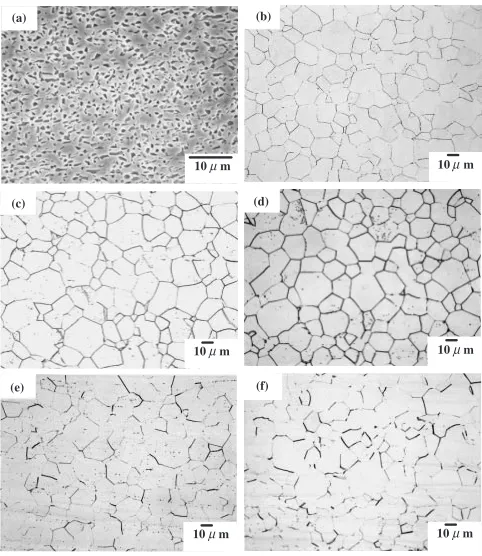
Figure 3 shows the microstructures of 30Nb alloy, Ti-30Nb-1Fe alloy,21) and Ti-30Nb-1Fe-xHf alloys (1–7 mass% Hf). The microstructure of the Ti-30Nb alloy displays a dualþ phase structure (Notably, sporadic !
phase can be detected through XRD analysis14)). An addition of 1 mass% Fe to the Ti-30Nb alloy transforms the dual phase structure into an equi-axed, single phase structure. More-over, additions of various amounts of Hf to Ti-30Nb-1Fe alloy cause little change in the microstructure; that is, an equi-axed, single -phase still persists, when observed optically.
3.2 XRD analysis
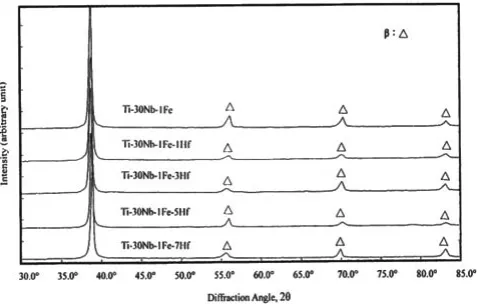
Figure 4 illustrates the XRD patterns for Ti-30Nb-1Fe alloy and a series of Ti-30Nb-1Fe-xHf alloys. The analytical results show that the only phase present in Ti-30Nb-1Fe alloy is the-phase. However, when hafnium was added to the Ti-30Nb-1Fe alloy, besides the primary peaks, sporadic !
peaks also can be detected in Ti-30Nb-1Fe-xHf alloys.
3.3 Transmission electron microstructures
Figure 5 shows a bright-field TEM micrograph, a dark-field TEM micrograph, an SADP and the interpretation of SADP of the Ti-30Nb-1Fe alloy. From the interpretation of the SADP, this alloy reveals an entire phase. A similar analysis of the Ti-30Nb-1Fe-5Hf alloy was conducted with the results displayed in Fig. 6. The dark field image in Fig. 6(b) was obtained from theð0001Þ! diffraction spot of the ! phase. Fig. 6(b) shows numerous minute particles in
Unit:mm
[image:2.595.313.542.72.128.2]the order of nano-meters distributed in the matrix. This diffraction pattern of the Ti-30Nb-1Fe-5Hf alloy is consistent with the report of Sass.22)The extra reflections, marked ‘þ’ in Fig. 6(d), illustrate the results of double diffraction.22)
3.4 Mechanical properties
Table 1 lists the tensile properties of 30Nb alloy, Ti-30Nb-1Fe alloy21)and a series of Ti-30Nb-1Fe-xHf alloys, in which the properties of the c.p.Ti and the Ti-6Al-4V alloy are also listed for comparison. Fig. 7 plots the tensile strength, 0.2% proof stress and elongation of Ti-30Nb-1Fe alloy as well as the changes in the above properties of Ti-30Nb-1Fe-xHf alloys, as a function of hafnium content over the range
studied here (1–7 mass%). The experimental results indicate that adding 1 mass% Fe to the Ti-30Nb alloy moderately reduces both tensile strength and 0.2% proof stress, from
Fig. 4 X-ray diffraction patterns of Ti-30Nb-1Fe and Ti-30Nb-1Fe-xHf alloys at the furnace-cooled state.
(a)
10µm 10µm
(b)
(c) (d)
(e) (f)
10µm 10µm
10µm 10µm
Fig. 3 Microstructures of Ti-30Nb (SEM) and Ti-30Nb-1Fe-xHf alloys (optical) having various Hf contents (a) Ti-30Nb (b) 0% Hf, (c) 1% Hf, (d) 3% Hf, (e) 5% Hf, and (f) 7% Hf.
(a)
(b)
100nm
100nm
(d) (c)
[image:3.595.312.543.56.688.2] [image:3.595.48.289.71.349.2] [image:3.595.49.290.422.579.2]835 MPa to 692 MPa, and 820 MPa to 680 MPa, respectively, accounting for a 17% reduction. However, when 1 mass% Hf was added to the Ti-30Nb-1Fe alloy, both the tensile strength and 0.2% proof stress increased markedly from 692 to 914 MPa, and 680 MPa to 862 MPa, respectively. However, further increase in Hf content essentially results in no change in strength. Regarding the tensile ductility, as expected, the results show just a reverse pattern of tensile strength.
As for the elastic modulus, the results shown in Table 1 and Fig. 8 indicate that the addition of 1 mass% Fe to the Ti-30Nb alloy moderately reduces elastic modulus, from 80 GPa to 68 GPa. The elastic modulus can be further reduced by adding 1 mass% Hf to the Ti-30Nb-1Fe alloy, namely, from 68 GPa to 62 Gpa. However, further increase in Hf content causes little change in elastic modulus.
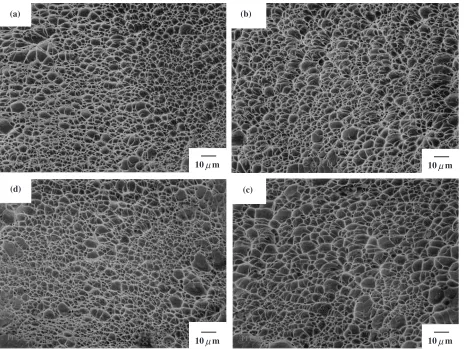
Figure 9 shows the tensile fractographic morphologies of Ti-30Nb-1Fe-xHf alloys, and reveals essentially a dimpled morphology, characteristic of a ductile fracture mode.
4. Discussion
The results presented here demonstrate that adding 1 mass% Fe to the Ti-30Nb alloy moderately reduces both the tensile strength and 0.2% proof stress, and also moderately reduces the elastic modulus. The reduction in the strength and the elastic modulus results from the elimination of and!phases in the microstructure caused (a)
100nm
(b)
100nm
(d) (c)
Fig. 6 TEM micrographs and SADP of Ti-30Nb-1Fe-5Hf alloy (a) the bright field image, (b) the dark field image, (c) SADP showing!and reflections, zone axes½1110and½11220!, and (d) an indexed diffraction
[image:4.595.54.284.70.728.2]pattern.
Table 1 Tensile properties of various Ti alloys.
Tensile 0.2%proof Elastic 0.2%proof Alloy strength stress modulus stress/Modulus
(MPa) (MPa) (GPa) 100
c.p.Ti 475 420 104 0.40
Ti6Al4V 925 870 112 0.78
Ti30Nb 835 820 80 1.03
Ti30Nb1Fe 692 680 68 1.00
Ti30Nb1Fe1Hf 914 862 62 1.39 Ti30Nb1Fe3Hf 877 836 67 1.25 Ti30Nb1Fe5Hf 843 817 64 1.28 Ti30Nb1Fe7Hf 857 844 65 1.30
[image:4.595.306.549.84.215.2] [image:4.595.314.538.157.409.2]by iron addition. The present results also indicate that by adding only 1 mass% hafnium to the base Ti-30Nb-1Fe alloy, the tensile strength and 0.2% proof stress are increased markedly from 692 to 914 MPa, and 680 MPa to 862 MPa, respectively, accounting for 27–32% increases. The signifi-cant increase in strength was first speculated to be due to the grain refining and solid solution strengthening effects of hafnium in the phase matrix, combined with the re-precipitation of the relatively hard ! phase in the
Hf-containing Ti-30Nb-1Fe alloys. Grain size and Vickers micro-hardness measurements were performed on both the Ti-30Nb-1Fe and Ti-30Nb-1Fe-xHf alloys, and the results are listed respectively in Tables 2 and 3. The measurement
Fig. 8 Changes in elastic modulus as a function of Hf content of Ti-30Nb-1Fe-xHf alloys.
(a) (b)
(c) (d)
10 mµ
10 mµ 10 mµ
10 mµ
[image:5.595.305.549.162.238.2]Fig. 9 SEM fractographs of Ti-30Nb-1Fe-xHf alloys having various Hf contents (a) 1% Hf, (b) 3% Hf, (c) 5% Hf, and (d) 7% Hf.
Table 2 Measurements of grain size of Ti-30Nb-1Fe andTi-30Nb-1Fe-xHf alloys.
Alloy Average grain size*,mm
[image:5.595.68.271.205.363.2]Ti30Nb1Fe 17.5 (14:019:3) Ti30Nb1Fe1Hf 17.9 (16:020:9) Ti30Nb1Fe3Hf 18.4 (17:419:3) Ti30Nb1Fe5Hf 17.7 (14:020:6) Ti30Nb1Fe7Hf 17.1 (15:320:0) * Five measurements were conducted
Table 3 Micro-hardness measurements of Ti-30Nb-1Fe and Ti-30Nb-1Fe-xHf alloys
Alloy Solution treated and quenched Furnace-cooled Average hardness*, Hv Average hardness*, Hv
[image:5.595.307.549.292.382.2] [image:5.595.68.532.418.767.2]results of the grain size (Table 2) reveal almost no variation among the alloys investigated. Therefore, the grain refining effect of Hf on mechanical properties can be excluded. Regarding the micro-hardness measurements, the specimens were prepared under two different states, namely, solution treated and quenched state (solution treatment: 1173 K/ 14.4 ks, water quench: 293 K) and furnace-cooled state (973 K). Results of Vickers micro-hardness measurements are shown in Table 3. It has to be noted that for both Ti-30Nb-1Fe and Ti-Ti-30Nb-1Fe-xHf alloys at the solution treated and quenched state, they exhibit a singlephase structure, as can be concluded from the XRD analysis results shown in Fig. 10, whereas,!phase precipitates in thephase matrix when the above alloys are present at the furnace-cooled state (Fig. 4). From the micro-hardness results of Table 3, one can see that for alloys at the solution treated and quenched state only a slight increase (around 4%) in Vickers hardness was resulted by the addition of hafnium. Since both the Ti-30Nb-1Fe and Ti-30Nb-Ti-30Nb-1Fe-xHf alloys reveal a single phase structure at the solution treated and quenched state, the increase in micro-hardness of Ti-30Nb-1Fe-xHf alloys should be due to the solution hardening effect of Hf. The results, however, show that the increase in Vickers hardness is rather small, and thereby, the solution strengthening brought about by Hf is also minor. On the other hand, for alloys at the furnace-cooled state, a moderate increase (around 17%) in Vickers hardness was attained by the introduction of Hf. Based upon the results obtained here, we can conclude that the precipitation of the relatively hard !
phase in thephase matrix can be identified as the primary factor responsible for the significant increase in strength.
A comparison of the tensile strength and 0.2% proof stress among several Ti alloys of interest (Table 1) demonstrates that the strengths of the Ti-30Nb-1Fe-xHf alloys (T. S.: 914 MPa, 0.2% P. S.: 862 MPa) are almost twice those of c.p.Ti (T. S.: 475 MPa, 0.2%P. S.: 420 MPa), and approach those of Ti-6Al-4V (T. S.: 925 MPa, 0.2% P. S.: 870 MPa). On the other hand, the elastic moduli of the Ti-30Nb-1Fe-xHf alloys (6267GPa) are significantly lower than those of Ti-6Al-4V (112 GPa) and c.p.Ti (104 GPa). Considering that the ratio of 0.2% proof stress to elastic modulus can provide a criterion for assessing alloy suitability for biomedical applications, Ti-30Nb-1Fe-xHf alloys clearly display the
highest 0.2% proof stress to elastic modulus ratio among titanium alloys currently being used or developed. For example, the 0.2% proof stress to elastic modulus ratio of Ti-30Nb-1Fe-1Hf (1:39102) is around 1.8 times higher than
that of Ti-6Al-4V (0:78102), and around 3.5 times higher
than that of c.p.Ti (0:4102), as can be concluded from
both Table 1 and Fig. 11. Regarding orthopedic implant applications, Ti-30Nb-1Fe-1Hf alloy can be considered a favorable candidate owing to its relatively low elastic modulus value (62 GPa) and high 0.2% proof stress to elastic modulus ratio (1:39102).
5. Conclusions
(1) The microstructure of the base Ti-30Nb alloy reveals a dualþphase structure containing sporadic!phase. Addition of 1 mass% Fe to the Ti-30Nb alloy eliminates both the and! phases, and indicates an equi-axed, singlephase structure. Moreover, the introduction of hafnium to the Ti-30Nb-1Fe alloy causes re-precipita-tion of sporadic! phase in the otherwise complete
phase structure.
(2) Addition of 1 mass% Fe to the base Ti-30Nb alloy moderately reduces both tensile strength and 0.2% proof stress by some 17%. Additionally, the elastic modulus is also moderately reduced from 80 GPa to 68 GPa. The elimination of and! phases resulting from the introduction of iron explains the property change.
(3) Significant increases in both tensile strength and 0.2% proof stress, or some 30%, are obtained when only 1 mass% hafnium is added to the Ti-30Nb-1Fe alloy. However, further increase in hafnium, of up to 7 mass%, leads to minimal gain in both tensile strength and 0.2% proof stress. Regarding the elastic modulus, the value reduces slightly from 68 GPa to 62 GPa as 1 mass% hafnium is added to the Ti-30Nb-1Fe alloy. Again, the elastic modulus remains almost constant with further increase in hafnium content.
(4) For alloy Ti-30Nb-1Fe-1Hf, the ratio of 0.2% proof stress to elastic modulus is approximately1:39102,
[image:6.595.319.533.71.204.2]superior to currently used Ti alloys and those under development. Regarding orthopedic implant applica-tions, Ti-30Nb-1Fe-1Hf alloy can be considered a
[image:6.595.50.289.73.225.2]Fig. 10 X-ray diffraction patterns of Ti-30Nb-1Fe and Ti-30Nb-1Fe-xHf alloys at the solution treated and quenched state.
favorable candidate owing to its relatively low elastic modulus value (62 GPa) and high 0.2% proof stress to elastic modulus ratio (1:39102).
Acknowledgments
The authors would like to thank the National Science Council of the Republic of China, Taiwan for financially supporting this research under Contract No. NSC92-2216-E-002-024.
REFERENCES
1) S. Rao, T. Ushida, T. Tateishi, Y. Okazaki and S. Asao: Biomed. Mater. Eng.6(1996) 79–86.
2) P. R. Walker, J. Leblanc and M. Silorska: Biochemistry 28(1989) 3911–3915.
3) S. Yumoto, H. Ohashi, H. Nagai, S. Kakimi Y. Ogawa, Y. Iwata and K. Ishii: Int. J. PIXE2(1992) 493–504.
4) H. A. Mckellop and T. V. Ro¨stlund: J. Biomed. Mater. Res.24(1990) 1413–1425.
5) J. Rieu, A. Pichat, L. M. Rabbe, A. Rambert, C. Chabro and M. Robelet: Mater. Sci. Tech.8(1992) 589–596.
6) M. Ninimi: Metall. Mater. Trans.,33A(2002) 477–486.
7) M. Niinomi, T. Hattori, K. Morikawa, T. Kasuga, A. Suzuki, H. Fukui and S. Niwa: Mater. Trans.,43(2002) 2970–2977.
8) Y. Song, D. S. Xu, R. Yang, D. Li, W. T. Wu and Z. X. Guo: Mater. Sci. Eng. A260(1999) 269–274.
9) Y. Song, R. Yang, Z. X. Guo and D. Li:Structural Biomaterials for the 21stCentury, ed. by M. Niinoni, D. R. Lesuer, T. Okabe, H. E. Lippard and E. M. Taleff, (TMS, Warrendale, PA, 2001) pp. 273–280. 10) M. Long and H. J. Rack: Biomaterials19(1998) 1621–1639. 11) M. Niinoni, Mater. Sci. Eng. A243(1998) 231–236.
12) A. K. Mishra, J. A. Davidson, R. A. Poggie, P. Kovacs and T. J. Fitzgerald:Medical Application of Titanium and its Alloys, ed. by S. A. Brown and J. E. Lenons, (ASTM STP 1272, West Conshohocken, PA, 1996) pp. 96–113.
13) X. Tang, T. Ahmed and H. J. Rack: J. Mater. Sci.35(2000) 1805–1811. 14) Y. H. Hon, J. Y. Wang and Y. N. Pan: Mater. Trans.,44(2003), 2384–
2390.
15) F. A. Grossley: U. S. Patent 3986868 (1976).
16) M. J. Donachie, Jr., Titanium:A Technical Guide, (ASM international, Metals Park, OH, U.S.A., 1989) pp. 21–36.
17) S. G. Steinemann:Titanium’84: Science and Technology, ed. by G. Lu¨tjering, U. Zwicker and W. Bunk, (Deutsche Gesellschaft Fu¨r Metallkunde, Munich, Germany, 1985) pp. 1373–1379.
18) Y. H. Hon, J. Y. Wang and Y. N. Pan: Mater. Lett. (in review). 19) ASTM designation E111-97: Standard test method for Young’s
modulus, tangent modulus and chord modulus, (ASTM, Philadelphia. PA, U.S.A., 2002) pp. 1–7.
20) ASTM designation E83-00: Standard practice for verification and classification of extensometer system, (ASTM, Philadelphia. PA, U.S.A., 2002) pp. 1–12.