A Framework for Sustaining Rural
Development Program: Evidence from
Micro-Panel Data in Nigeria
Ekong, Christopher N. and Onye, Kenneth U.
University of Uyo, Uyo, University of Uyo, Uyo
2016
Online at
https://mpra.ub.uni-muenchen.de/88358/
A Framework for Sustaining Rural Development Program:
Evidence from Micro-Panel Data in Nigeria
Christopher N. Ekong, Ph.D. Kenneth U. Onye
Abstract
The jettisoning of virtually all rural development programs in Nigeria is a clear testimony to their unsustainable execution and the non-functionality of current methodology used in achieving sustainable rural development (SRD). This paper develops a basic framework for sustainable rural development projects execution based on a neo-concept of participation. We conceptualize that sustainable rural development is a function of institutional framework, managerial capacity, stakeholders’ participation, training and monitoring. The paper develops quantifiable proxies for an objective specification and went on to estimate our novel model of SRD. The findings from the study indicate that the index of managerial or entrepreneurial skill, stakeholders’ participation and training are the three most fundamental determinants of project sustainability.
Keywords: Sustainable Rural Development, Random Effect Model, Participation
Part 1 – Introduction
One of the unique qualities that separate man from the other animals on planet earth is his capacity for self-transcendence, the ability to make himself his own project. Man can stand “outside himself” and evaluate where he has been and a direction in which he can adapt to changes, either self- generated or externally imposed (Coomer, 1981:1).
Rural development is conventionally regarded as the improvement of the life qualities or welfare
of the various micro units of a vast macro rural system (Central Bank of Nigeria 1992:1). A Central Bank
of Nigeria and Nigeria Institute for Social and Economic Research (CBN/NISER) study team (1992) went on to re-qualify and specifically define the rural areas as it concerns Nigeria. In their specification, they captured the rural economy as the sector in the national economy that encapsulates agriculture and other rural enterprise as well as rural life. They went further to characterize the rural sector thus:
(i) a population of not more than 25,000 people;
(ii) overwhelming farming economy; (iii) poor living conditions;
(iv) lack of basic amenities such as health facilities, good drinking water; (v) low or no savings;
(vi) no real investment;
(vii) very low quality of food; and
(viii) a larger proportion of income is spend on consumption.
The CBN/NISER report (1992) confirms that the above characterization put over 75% of the Nigerian population in the rural areas.
Although Nigeria’s rural sector is an expression of a gloomy picture of underdevelopment; the economy of the nation is sustained by this sector. The agricultural and mineral resources of the country lie in these rural areas. This fact underscores the pressing need to develop the rural areas, which are currently agitating in a very violent manner.
Okonny (1994) see the objectives of rural development as including:
(i). sustained improvement of the quality of life and standard of living of a majority of the rural populace. That such included provision of regular potable water, regular electricity supplies for domestic and production use, and all–season roads for evacuation of farm products;
(ii). raising the quality, value and nutritional balance of their food intake at affordable prices;
(iii). enhancing the improvement of their health condition through accessible and reliable health services; (iv). improving their housing and general living and working condition including easy procurement of farm inputs and transportation of farm harvests;
(v). creating greater human resources development and employment opportunities, more importantly, self-employment, which in turn would lead to improved productive capacity and income levels within communities.
Another very important need for rural development has been observed by many including, Mensah and Ojowu (1991), Ekong (1991) Ekong (1998), among others, as curbing the menacing rural-urban migration. They all see urban development as a pull- factor to rural development. The absence of equivalent development in the rural areas in terms of good roads, potable drinking water, electricity, etc., pushes the rural dwellers to migrate. Of course, such out-migration implies severe reduction in agricultural productivity and rural labour–force.
million in Nigeria for several rural development programs which had all failed. The Nigerian Government corroborated the World Bank assertion by the confirmation that the country had spent billions of dollars in rural development programs in the country without commensurate compensation. The jettisoning of nearly all past rural development programs and projects by the Obasanjo’s government was a clear testimony to the unsustainable state of several rural development projects by these agencies.
The conviction that rural development projects if well-articulated and sustainably implemented can lead to national development, informed this paper. Thus, the objective of this paper is to show how stakeholders’ participation, institutional capacity, managerial capacity, monitoring and training in project planning and implementation can lead to a sustainable rural development project implementation which would then ensure a sustained national development. To achieve this objective, this paper develops a conceptual model of sustainable project implementation (SPI) and identifies quantifiable proxies for the variables in the model, and went on to estimates the model. The balance of the paper is structured as follows.
Part 1 – Introduction
Part 2 – Theoretical Issues
Part 3 – Eclectic Review of Government Financed Rural Development Program in Nigeria
3.1 Performance Status of Rural Development Programs in Nigeria
Part 4 – A conceptual Framework/model for sustaining rural development in Nigeria
4.1 How Model Variables Builds Synergy for Sustainable Development
Part 5 – Data and Methodology
Part 6 – Empirical Results
Part 7 – Conclusion
Part 2 - Theoretical Issues: ‘Sustainability’, ‘Sustainable development’, and ‘Sustainable Project Implementation’
The idea of sustainability came to the public attention after a 1972 report, “Limits to Growth,” issued by the international think tank Club of Rome (see Meadows et. al 1972). It, however, became a benchmark for international action in 1980 through the report ‘Living Resource Conservation for Sustainable Development’ of the Swiss-based World Conservation Union. The report was developed by the International Union for Conservation of Nature (IUCN), in collaboration with UNDP and World Wildlife Foundation. But the term “sustainable development” achieved international public prominence through the 1987 report of the World Commission on Environment and Development, Our Common Future, often called the “Brundtland Report” after the name of its chair, former Norwegian prime minister, Gro Harlem Brundtland. The Brundtland Report presented the famous definition: “Sustainable development is development that meets the needs of the present without compromising the ability of future generations to meet their own needs” (see World Commission on Environment and Development, WCED, 1987: 43). For many organizations and agencies, this definition or its derivatives remains a working definition.
Sustainability is, indeed, an ambiguous and inclusive concept because it brings society’s ecological dependency into moral relation with its economic and political systems. Some critics even dismissed sustainability as conceptually meaningless or, at least, too susceptible to competing ideas to be useful. But insofar as the disagreements generally recognize mutual feedback between human and ecological systems, they reflect substantive differences about what to sustain over time; hence, the use of such terms as sustainable development, sustainable community, sustainable rural development and sustainable project implementation, among others.
In its literal rudiments, sustainability refers to a capacity to maintain some entity, outcome, or process over time. Project execution, forest management and financial investment – for instance – might be deemed sustainable if the activities do not exhaust the material resources on which it depends. In its increasing common use, the concept of sustainability frames the ways in which environmental problems jeopardize the conditions of healthy economic, ecological, and social systems. Thus, while economic aspect of sustainability and sustainable development focuses on ways of conserving or sustaining natural and financial capital and maintaining manageable level of government and external debt; ecological or environmental sustainability look at ways of sustaining biological diversity, maintaining a stable resource base, avoiding over-exploitation of renewable resource system, and maintaining ecological integrity; and yet, socio-political aspect of sustainability explains social systems that realize human dignity by achieving distributional equity and adequate provision of social services (Harris, 2000; Norton 2005; Sen 1999). An economically sustainable system must be able to produce goods and services on a continuous basis and avoid extreme sectorial imbalance which damage agriculture and industrial production. For project implementation, therefore, sustainability would mean implementing the project in a way that ensures its continued existence, maintenance and realization of set targets. Sustainable project implementation (SPI) is, thus, an integral part of economic aspect of sustainable development.
Part 3 - Eclectic Review of Government Financed Rural Development Programs in Nigeria
synonymous with agricultural development. This reasoning could be seen in Nigeria, where the various rural development strategies of government focused on agricultural development. It was and is still the view of government, and many development economists that rural development could be achieved if the agricultural sector is harnessed and enhanced. Thus, in many cases, rural development has been seen and considered as agricultural development.
Rural development financing in Nigeria started in 1971 with the established of the Agricultural Development Program (ADP), a World Bank initiative (Ekong, 1991). This section of the paper, therefore presents a review of the various rural development programs that have been instituted in the country.
[1] Agricultural Development Program (ADP)
ADP was established in 1971 with the main objective of increasing food production and improving the standard of living and welfare of the farming population. Although the concept was formulated in 1971, it was actually established in 1974 with the initial centers at Funtua, Gombe, and Gausu (Ekong, 1997; Evbuomwam, 1997). As in Evbuomwam (1997), the apparent success of the early projects prompted both Federal Government and the World Bank to quickly replicate the ADP strategy in other States, apart from the original three. By 1988, the entire country was covered by the ADP system with networks spreading to all the Local Areas in the States. To achieve its objectives, the ADP needed to introduce simple techniques of farming that enhances the skill of the local populace, enabling them to be self-sufficient in food production (Evbuomwam, 1997).
With funding coming from the World Bank, Federal Government and the State Governments, in a counterpart funding agreement, ADP was liquid to purchase adequate farm implement and train various extension Officers. In many cases, demonstration farms were established. Extension agents were expected to directly work with farmers. They were to introduce new farming methods to the farmers, not by ordering the farmers, but by suggesting and facilitating the process of change. Farm settlements were also built to accommodate extension agents, other technical hands, some kind of farm secretariat, and processing units.
In an extensive study carried out by Philips (1999), it was discovered that with the withdrawal of World Bank funding of ADP, many of its structures collapsed. The study showed that extension agents were never met at stations, while other stations complained that they have never had any, notwithstanding the fact that a sign post indicating such presence were in their villages, Philips (1999) also reported that over half of ADP’s vehicles were broken down, while farm settlements were abandoned.
[2] River Basin Authority
Water resources development in Nigeria received the first noticeable mention in the IBRD (1955) report. It was noted that planning flood control, major irrigation, navigation and hydrological programs and schemes was rendered almost impossible by the paucity of information which existed in scattered form in several agencies (Olayide, et al, 1984:3). The report advocated the establishment of a laboratory for salt and silt analysis of water as well as the study of simple models of water control projects. The importance of collecting data, especially on River Niger and Benue, was stressed in view of the agricultural and navigational benefits that could be derived from using such data as a basis for planning. Arising from these, the River Basin Development Authorities Decree, 15 June 1976, of the Federal Republic of Nigeria established ten corporate River Basin Development bodies.
The River Basin Authorities were charged with the following specific objectives:
(i) undertaking a comprehensive development of underground water resources for multiple purpose use; (ii) undertaking schemes for the control of floods and erosion and for watershed management;
(iii) constructing and maintaining dams, dykes, plodders, wells, boreholes, irrigation and drainage systems and other works necessary for the achievement of the Authority’s function;
(iv) developing irrigation schemes for the production of crops and livestock and leasing the irrigated lands to farmers or organized associations in the locality of the area at a fairly economic fee;
(v) providing water from reservoirs, wells, and boreholes under the Authority’s control for urban and rural waters and supply schemes;
(vi) controlling pollution in rivers and lakes in the Authority’s area in accordance with nationally laid down standards; and
(vii) resettling persons affected by the works and schemes specified in (c) and (d) above under special resettlement schemes.
The obvious inability of the RBDA to sustain its capacity made it to excise some of its departments in the early 1990s. The board is now so epileptic and its impact is not felt anywhere in Nigeria.
[3] Agricultural Credit Guarantee Scheme Fund (ACGSF).
required:
(i) The establishment or management of plantation for the production of rubber, oil palm, cocoa, coffee, tea and similar crops.
(ii) The cultivation or production of cereal crops, rubbers, fruits of all kinds, cotton, beans, groundnut, sheanuts, benniseeds, vegetables, pine-apples, bananas and plantain; and
(iii) Animal husbandry, including poultry, piggery, cattle rearing, fish farming and the like.
Reports from the banking sector (Agene, 1995) have it that the level of loan repayment evasion in these areas was very high. This had made the banks to be very tight in releasing funds for the scheme, even when it had been guaranteed. Table 1 (in appendix 1) shows the discouraging repayment rate of loans guaranteed by ACGSF
[4] The Rural Banking Scheme
The realization by the Pius Okigbo Panel of 1975 that the rural sector of Nigeria, which held 50.4% of the country’s total money stock, was totally under-banked led to the commencement of the Rural Banking Scheme in 1977. The scheme was directed towards the Commercial Banks. The commercial banks were to be directed by the Central Bank of Nigeria (CBN) to establish rural branches, instead of concentrating exclusively on urban branches. The objectives of the scheme as in Abe (1984) included:
(i) cultivation of banking habits among the rural dwellers;
(ii) mobilization of saving from the rural areas for the purpose of channeling them to profitable ventures; (iii) creation of credit by way of equity and loans for small scale businesses;
(iv) development of agriculture and agro–allied industries in rural areas with a view to achieving the national objective of self-sufficiency in food production; and
(v) reducing the drift of young men and women from rural to urban areas.
The implementation of the scheme was divided into three phases: 1977-1980, 1981-1983, and 1984-1989. In all the phases, all rural outlets given by the CBN to the commercial banks were established: 200 in phase 1, 266 in phases 2, and 300 in phase 3. Although the expected rural branch target was achieved by the Commercial Banks, other important goals like, stimulating banking habits in terms of increased savings, rural investments, and general sustainability were not attained. The greatest evidence of the failure of the scheme was the large-sale closure of rural bank branches all over the country (Ekong, 1997).
[5] Community Banking
The lasting desire of the Federal Government of Nigeria to truly stimulate banking consciousness in the rural sector of the country made it to seek community participation in banking. The inability of the rural banking scheme of 1977 to achieve set targets and goals encouraged this new methodology to financial integration of the sector. By the Community Banks implementation Act of 1990, such banks were expected to be owned by Community Development Associations (CDAs), Co-operative societies, farmer’s group, community age grades, indigenous people and corporate bodies, at the local or community level (Agene, 1995; Ekong, 1997). The Federal Government, through the Central Bank of Nigeria (CBN), empowered the National Board for Community Banks (NBCB) to license community groups that meet the requirement to be established as community banks. The principal objectives for the community banking system included:
(a) the promotion of rural development by providing financial and banking services to communities inadequately supplied with such services;
(b) the rapid development of productive activities in the rural areas and hence the improvement of the economic status of both the rural people and the rural areas;
(c) the emergence of an effective and integrated national financial system that responds to the needs of the whole economy, especially at grassroots community levels;
(d) the inculcation of disciplined banking habits among the masses of low income workers in Nigeria, especially those in the rural areas; and
(e) the fostering of community ownership and use of economic asset, etc. (Agene, 1995).
As at 30 October 1997, one thousand, three hundred and sixty eight (1,368) Community Banks were established all over the country. However, on that day, two hundred and eighty two (282) Community Banks who have closed shop and could no longer perform the functions for which they were established had their provisional licenses withdrawn on the order of the CBN. Many other Community Banks, whose licenses were not withdrawn as at 1997, had since either remained closed or developed new strategies to cope with the competitive environment.
[6] The Better Life Program for Rural Women (BLPRW)
(i) raising the social consciousness of women about their rights, social, political and economic responsibilities, (ii) bringing women together and closer to themselves for better understanding of their problems,
(iii) mobilizing women for concrete steps to achieve specific objectives, including seeking leadership roles in all spheres of national life, and
(iv) stimulating and motivating rural dwellers towards achieving a better level of life as well as to sensitize the general populace to the plight of these women (Oyovbaire and Olagunju, 1994: 45).
The BLPRW identified and concentrated on four basic areas including health, education, farming, social, and political affairs. The program suddenly lost focus as urban and better-to-do women hijacked it at the detriment of the rural women. This condition manifested in 1993 when the government of Gen. Sanni Abacha decided to proscribe the program, restructure its organ and rename it Family Economic Advancement Program (FEAP).
[7] Directorate for Food, Roads, and Rural Infrastructure (DFRRI)
With the inability of the various rural developments strategies to yield expected results, government in 1986 established DFRRI through the promulgation of Decree No. 4 of 1987. DFRRI was to undertake the following: (i) to encourage increased agricultural and any other activities in the rural areas to provide agricultural and industrial raw materials;
(ii) to undertake the construction and repair of roads to facilitate communication and distribution of agricultural products,
(iii) to liaise with the appropriate Federal, State and Local Governments for the provision of water, health facilities, electricity, means of communication and such other things as the Directorate may determine within the rural economy; and
(iv) to enlighten the rural communities in order to give them a sense of belonging to the country.
To undertake this mandate, DFRRI identified and concentrated emphatically on road construction in rural areas; the promotion of horticulture (fruit tree and vegetable production, etc.), fish production, livestock production; and the provision of construction materials for rural development as well as providing storage and processing facilities (National Planning, 1994). By 1993, it was obvious that DFRRI was unable to meet its towering objectives. Several studies and prognosis about the agency confirmed the overt failure to meet targeted goals. Consequently, the Federal Government proscribed the agency and returned its structures back to the Ministry of Agriculture.
[8] Family Economic Advancement Program (FEAP)
FEAP came with the following objectives:
(i) to provide loans directly to people at ward level with the capital needed to set up and run cottage enterprises;
(ii) to provide opportunities for the training of ward-based business operation;
(iii) to encourage the design and manufacture of appropriate plant, machineries and equipment; (iv) to create employment opportunities at ward levels;
(v) to improve living conditions of people;
(vi) to encourage producers at ward levels to form co-operative societies; (vii) to promote production and consciousness for development;
(viii) to utilize all available local resources for the benefit of Nigerians through improved production, storage preservation, processing, recycling packaging and marketing;
(ix) to involve private sector participation;
(x) to involve state and Local government areas in funding rural activities; and (xi) to reduce rural-urban migration.
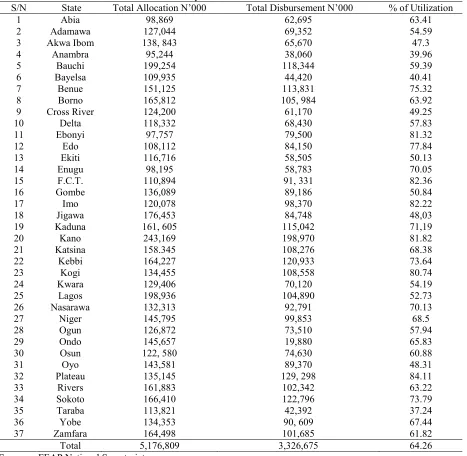
According to Olatoyinbo (1997), FEAP, taking cognizance of the lapses of past schemes decide to adopt appropriate strategies intended at its absolute goals. Such strategies, he continued, could be found in FEAP’s project identification procedure and processing of loan facilities. Also, to get FEAP loan, the beneficiary must have credibility and integrity in his ward to pass through the ward heads. The beneficiary is expected to have 10% of the loan required and this will be paid to the participating bank as a mark of commitment by the beneficiary. Beneficiaries are expected to pay back loan within three years after three months moratorium from the date of production with a notional interest of only 10% (Olatoyinbo, 1997). Initial money meant for FEAP has already been exhausted. As at 16 March 1999, FEAP was calling on the Federal Government for an additional N28m to help its course. Table 2 (in appendix 1) shows the extent of Utilization of Allocated FEAP loans by States of the Federation.
[9] International Fund for Agricultural Development (IFAD) Country Program in Nigeria
Since the start of its activities in Nigeria in 1985, IFAD has contributed to financing nine projects in the country. Some of these project which constitute the core of IFAD 2009 Country Programme Evaluation (CPE) include the Katsina State Agricultural and community Development Project (KSACDP) and Sokoto State Agricultural and Community Development Project (SSACDP) both of which closed in 2001; the ongoing Community –Based Agricultural and Rural Development Programme (CBARDP), Roots and Tubers Expansion Programme (RTEP), Rural Finance Institution-Building Programme (RUFIN), Rural Microenterprise Development Programme (RUMEDP) and the Community-Based Natural Resource Management Programme-Niger Delta (CBNRMP). The IFAD 2009 CPE which was the first full evaluation of the Nigerian portfolio since project funding commenced in 1985 shows that the total cost of the interventions amounts to approximately US$642 million (inclusive of counterpart funding and co-financing), of which IFAD loan accounts to US$187.4 million. IFAD has also provided over 31 technical assistant grants that were mostly of regional or sub-regional nature; some of which also covered some of the fund’s operations in Nigeria. Interestingly, IFAD has innovated with Community–Driven Development (CDD) programme in Nigeria. The success of its pilot CDD program that was first set up in Sokoto (STACDP) and Katsina (KSACDP) in the 1980s gave give to the Community–Based Agricultural and Rural Development Programme (CBARDP) in 2003, followed by the Community –Based Natural Resource Management Programme (CBNRMP) in the Niger-Delta in 2005, all of which are supported by IFAD. Notably, the CDD approach is a departure from the conventional ‘top-down’ approach that has never had a sustainable impact on beneficiaries’ living conditions. Instead, it develops a more democratic and inclusive ‘bottom-up’ approach that gives control over decisions and resources to the true agents of change in the rural communities, namely, peer groups, traditional organizations, women’s group, and producer’s union. CDD allow stakeholders to freely decide what action to take, and take responsibility for initiatives that affects their lives. It has taught communities how to set infrastructure priorities (drinking water, health care centres, roads and schools) and how to achieve these goals in a cost-effective, transparent and sustainable way.
IFAD was instrumental in promoting the community-driven development (CDD) approach in agriculture and rural development programs in Nigeria, which the government and other donors are following under their own programme in Nigeria. In this regard, the CPE found that positive achievements were made with regard to improvement in physical and financial assets; social capital and empowerment; and food security. The unit costs for development of infrastructure were found to be lower relative to similar quality of works that were carried out by line departments or private contractors.
[10] FADAMA Projects in Nigeria
Following the failure of most home-groomed rural development policies to produce the expected result, Fadama (Irrigable Land) project which is a project of the Federal Ministry of Agriculture and Rural Development that is jointly funded by The Federal Government of Nigeria and World Bank with component funding by state and local governments, was introduced. The First National Fadama Development Project (Fadama-1), which was implemented during the period 1993-1999 focused mainly on crop production and largely ignored support of post-production activities such as commodity processing, storage and marketing (downstream agricultural sector). The emphasis was on providing boreholes and pumps to farmers through simple credit arrangements aimed at boosting cumulative crop output (Nkoya et al., 2008). The design of Fadama 1 neither supported rural infrastructure development nor consider other resource users such as livestock producers, pastoralists, fish-folks. It also adopted top-down development approach (Umar and John, 2012). The focus on crop production increased crop output but since the project did not support post-harvest technology, the surplus output led to reduced crop prices and increased storage losses. Fadama II (the largest agricultural project in Nigeria in recent years) which was implemented between 2005-2010 sought to address the shortcomings of Fadama I by employing paradigm shift from a top-down and supply-driven public sector development progamme to the community-driven development (CDD) approach. In other words, the strategy represented a shift from public sector domination to a CDD approach, which is built around community-defined priorities. Fadama II included other resource users that the first project had ignored and supported activities and services other than production. Recent studies points to positive impact of Fadama II on the users (see Kadi et al. 2008; Umar, Phoa and Muhammed 2012; Akangbe et al. 2012). By offering technical assistance, business advice, support and extension services, Fadama II has made huge difference in the lives of its participants (NFDP, 2007). Owning to huge gain from Fadama II, the 3rd
Figure 1: Overall FADAMA III Project Performance
Source: Adapted from CSOs Independent Report of the 3rd National FADAMA Development Project (NFDP 3),
Third Joint World Bank/FGN and CSOs Supervision. Note: The finding is based on a scale of 0% -100%. A common checklist developed for all CSOs involved in the mission was adopted.
The result shows that transparency and positive impact of the project ranked highest with percentage score of 80% and 75% respectively. Youth participation ranked least. Overall, Fadama III thus has a systematic structure that gives voice to the communities and connection to the government, empowering the grassroots, creating employment and reducing poverty, giving hope to the poor and vulnerable people through the use of the bottom-top and CDD approach.
Performance Status of Rural Development Programs in Nigeria
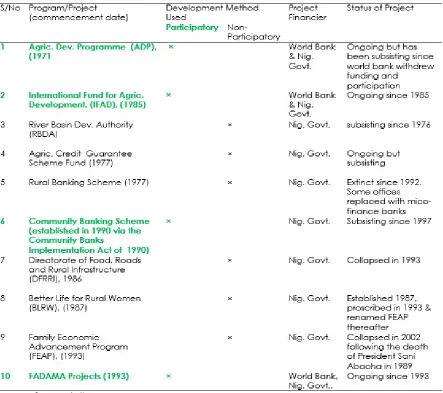
The performance status of the projects earlier reviewed is summarized in Table 1. Here, we adopt the analysis of the structure and implementation strategies of these programs which are key determinants of project sustainability.
Table 1 – Performance Status of Rural Development Programs in Nigeria
[image:8.595.78.521.351.744.2]For this study, the structure includes the ownership of the program and major sourcesof funding, while the implementation strategy is the level of stakeholders’ participation, managerial and institutional capacities, and the degree of monitoring and training offered. How a program is funded is fundamental to determining the structure. If it is internationally funded with donor funds, then the international community will be involved in deciding what project is implemented and how it is implemented. If domestically funded by the government, then government will unilaterally decide the structure. As is obvious from table 1, many rural programs in Nigeria were been funded by Nigerian government. In few cases, however, the programs have pushed a little further to include other stakeholders outside government in their planning and implementation phases. In the international scene, the popularity of this strategy had been orchestrated in the works of Chambers (1983), Chambers (1994a, 1994b) and Ekong (2002), among others. The strategy depicts a bottom-up approach, where many stakeholders are involved in the planning and implementation stages of programs, and where rural communities that are beneficiaries of such programs are facilitated to take ownership of the programs in order to ensure sustainability when funding agencies eventually exit. Table 1 shows that all the programs that had non-participatory implementation strategies are either subsisting (performing sub-optimally) or extinct. Contrastingly, those with participatory implementation strategy are still on-going.
Part 4 – A conceptual Framework/model for sustaining rural development
There is scant theoretical foundation upon which to analyze projects sustainability and, to our knowledge, absence of empirical literature on how indexes like Stakeholders’ Participation, Managerial Capacity, Project Monitoring, Training and Institution Framework influence sustainable project implementation. The conceptual framework developed in this paper serve mostly to motivate the variables included in the analysis and to provide benchmark against which to evaluate the relevance of the model variables. This paper conceptualizes an ingenuous strategic framework that can become that solution set to the problems of unsustainable rural development in Nigeria. Following the United Nations (2008:16) report of UNECE/OECD/Eurostat Working Group on statistics for sustainable development, a framework in this context is a practical set of principles and rules that allows one to select a limited set of determinant of sustainable rural development in a coherent and consistent manner. Our framework of analysis tries to locate those factors, which sustains the unsustainability and how such factors could be meaningfully reduced or controlled for sustainable development. This paper conceptualizes that sustainable rural development is determined by some factors, both quantitative and qualitative (but to which quantifiable proxies are derivable). We represent this conceptualization, thus, in equation form:
spi = f (inc, mac, stp, tra, mon) (1)
(see Table A1 for data construction and sources)
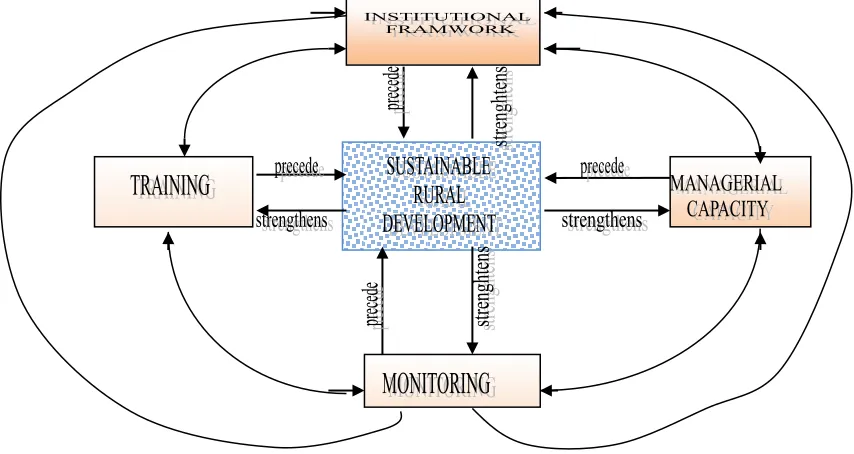
[image:9.595.106.533.502.729.2]Figure 2 presents a graphic model that show how the exogenous variables in equation (1) interact with the response variable and even within themselves to build synergy.
Fig. 2 – Relationship and Synergy of Model Variables
Source: study
in the model interact, they are fundamental in determining the response variable and ab initio have separate and independent effect on the response variable. A striking feature in the model is its skewness to participation. Every exogenous variable in the model indicates the case for participation as it is vital for their attainment of positive values. Therefore, participation is the main pivot of the model. To get these variables right, participation must be encouraged in the rural communities. On the strength of this realization, we develop a participatory model that will help to nurture the exogenous variables of the SRD model (see Figure 3)
The participatory model shows that if the rural communities are encouraged and facilitated to work together and to be interested in their development, they will easily and effectively develop the necessary ingredients for the attainment of positive values of the explanatory variables. This will make for the realization of the sustainable rural development (SRD) goals. In line with Ekong (1998), the following community participatory model for sustainable rural development is presented.
From the participatory model, stage 1 is the grassroots or start point, where interest groups are identified. The activities of the interest group as represented in the functions are shown in the model. In stage 2, the various interest groups come together. Each interest group selects its key officers: Chairman; Secretary; and Treasurer to represent her in the assembly of all interest groups in the community. Functions of the delegates’ assembly are stated in the model. In stage 3, the Delegates Assembly appoints one member from each interest group, preferably the Chairman, to join with the Village Heads and form the Community Development Association (CDA).
built at all levels of participation in the community. If the participatory model is encouraged and entrenched in all communities of the country, then rural development will be sustainable as communities will see all programs and projects as theirs. And with their earned capacities, communities will see failure of programs and projects as their collective failure. They will also create a competitive environment around themselves as all communities will be competing to be best in programs and projects sustainability.
Part 5 – Data and Methodology
This study makes use of micro-panel data obtained through the use of structured questionnaire for 10 projects1 in
Akwa Ibom state. The data include indexes of sustainable project implementation (spi), institutional capacity (inc), managerial capacity (mac), stakeholders’ participation (stp), monitoring (mon), and training (tra). Each series covered unequal period of 5years from 1998 to 2013.
Because our study relate to individual projects over some years, there is bound to be some heterogeneity across the projects. The technique of panel data regression takes such heterogeneity explicitly into account (Gujarati 2006: 637). The econometric specification of the general panel model with its random and fixed effect variants are as follows.
Yit = b0 + βXit + Ziy + αi + eit (2) general panel model
Yit = βXit + αi + uit (3) fixed effect model
Yit = βXit+ α + uit + εit (4) random effect model
Where:
Yit represents the dependent variable in our model (spi); b0 is the intercept of the model; β is a vector of
coefficients of the explanatory variables; Xit represents the observed factors that can be estimated by both
random effect model (REM) and fixed effect model (FEM) – they are time-variant factors and include those variables of our model (spi, mon, stp, inc, mac, tra) that changes over time; Ziy represents the observed factors
that can only be estimated by the REM but not the FEM – they are time invariant factors or types of measure such as age, occupation, sex/gender, politics, and religion that are stable across observations or entities; αi represents the unobserved entity- (cross-sectional-) specific effect or individual specific effect/term; eit represents
the unobserved residual of the model; uit represents between entity error; εit represents within entity error.
Model Diagnostics
To fix the appropriateness of our model and adjustments made thereof, we implement some preliminary diagnostics, including the Hausman Specification test2 for choice of fixed effect over random effect or vice
versa, Breusch-Pagan test for heteroscedasticity and, thereafter, we examine the graph correlation matrixes, splines, and scatter plots in search of proper functional form of the regression model.
Hausman basically test whether the unique errors (ui) are correlated with the regressors. Thus, the null hypothesis is that they are not. If the error terms are correlated with the regresssors, the observed time-invariant factors will effectively be eliminated from the general panel model. In this case, the fixed effect model will be the preferred model.
As can be seen from Table 3, the probability value of 0.8822 (˃0.05) indicates a test statistic that falls within the acceptance region so that we are unable to reject the null hypothesis. This fixes the appropriateness of the random effect model over the fixed effect model. An advantage of random effects is that it includes time invariant variables. In the fixed effects model, these variables are absorbed by the intercept. Based on this preliminary result, the random effect model3 (equation 4) is adopted. Next, we proceed with heteroscedasticity
test. If the data is heteroscedastic, our estimate will be spurious but we can correct for such heteroscedasticity using robustness check. Thus, the heteroscedastic test conducted here serves mainly to check the need for inclusion of robustness term.
A non-graphical way to detect heteroskedasticiy is the Breusch-Pagan test4. The Breusch-Pagan result
presented in table 3 returned a probability value of 77% (˃5%) indicating that we are unable to reject the null hypothesis (of equal variance) at 95% confidence interval. This shows that our residual is not heteroscedastic. A confirmatory test for homoscedasticity using the graphical approach returned results that are mixed when compared with those of Breusch-Pagan test (see Figure 6). Stock and Watson (2003) suggest that a safe approach
1 See Table A1 (in Appendix A) for data construction and Table A4 for list of projects in the sample. Tables in the body of the
work are numbered from 1 through 3 while those in the appendix are number A1 through A7.
2 The null hypothesis (Ho) for Hausman’s test is that the random effect model is the preferred model while the alternative
hypothesis is that the fixed effect model is preferred (see Green, 2008).
3 As we see in Green (2008: 183) the crucial distinction between fixed and random effects is whether the unobserved
individual effect embodies elements that are correlated with the regressors in the Model and not whether these effects are stochastic or not.
4 The null hypothesis Breausch-Pagan test is that the residuals are homoscedastic while the alternative hypothesis is that the
is to always assume the presence of heteroscedastic error term and correct1 for it through the robustness check.
Figure 4: Graphical Test for Heteroscedasticity
0
.2
.4
.6
.8
NASSI NDEADP FEAP FADAMA RBDA NSEHE RUFIN AK-R ACGSF (Rural Dev. Projects Implemented in Akwa Ibom State, Nigeria)
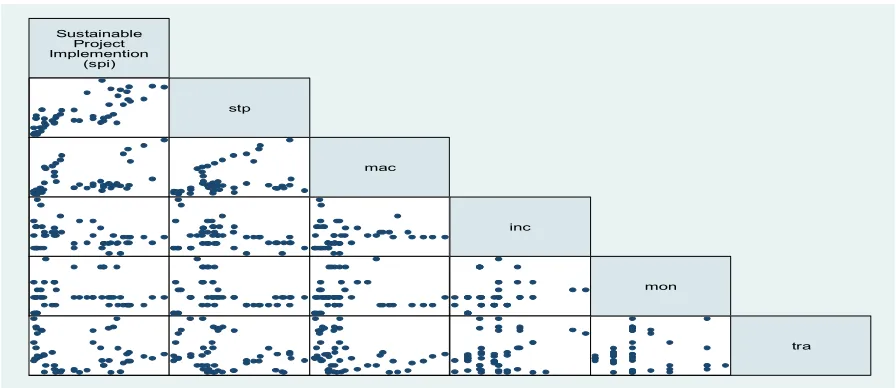
[image:12.595.74.522.348.542.2]Having discovered from the preliminary results earlier presented that the random effect model is more appropriate for examining the impact of stakeholders’ participation, managerial and institutional capacity, among others on SRD, we proceed to examine the scatter plots, regression fits and splines with an eye towards modeling the relationship. We set out by first examining the graph matrix of SPI (the proxy for sustainable rural development, SRD) with respect to each of the explanatory variable (see Table A1 for the variables and their construction and Table A3 for their correlation matrix).
Table 2 – Graph Matrix of SPI versus SPI-Determinants (stp, mac, inc, mon, tra)
Sustainable Project Implemention
(spi)
stp
mac
inc
mon
tra
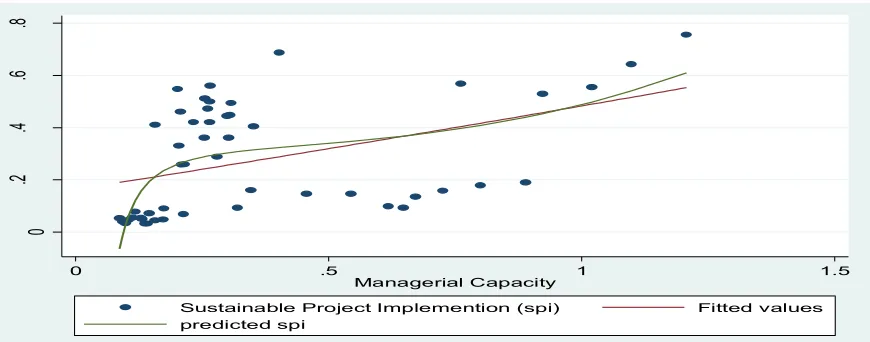
Table 2 provides evidence that is suggestive of a linear relationship between SPI and STP and a polynomial relationship between SPI and MAC. It did not, however, reveal any appreciable pattern between SPI on the one hand and TRA, MON, and INC on the other hand. In furtherance of the search for the nature on the relation between SPI and MAC, we evaluate the quadratic fit of SPI overlaid on the linear fit within the scatter plots (fig.5). The pattern reveals a cubic function that cut the straight line at three different points.
1
Figure 5: Scatter Plots of SPI against MAC (with Quadratic fit overlaid)
0
.2
.4
.6
.8
0 .5 1 1.5
Managerial Capacity
Sustainable Project Implemention (spi) Fitted values
predicted spi
The pattern, as has been noted, provides sufficient evidence that is suggestive of a non-linear and indeed a cubic function. This reinforces the need to iterate estimation of equations 5, 6 and 7 wherein SPI is modeled to be linear, quadratic and cubic in MAC, respectively.
SPIit = β1STPit + β2MACit + β4INCit + β5TRAit + β6MON6it + α + eit (5)
SPIit = β1STPit + β2MACit + β3MAC2it + β4INCit + β5TRAit + β6MON6it + α + eit (6)
SPIit = β1STPit + β2MACit + β3MAC2it + β3MAC3it + β4INCit + β5TRAit + β6MON6it + α + eit (7)
Where β1, β2, β3, β4, β5, β6, ˃ 0
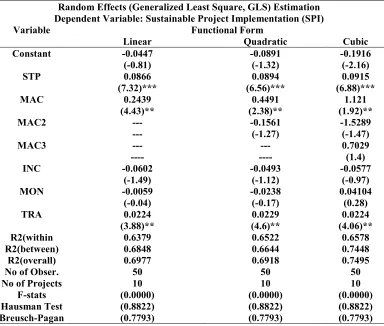
Part 6 – Empirical Result
Table 3 – Random Effect (GLS) Result
Random Effects (Generalized Least Square, GLS) Estimation Dependent Variable: Sustainable Project Implementation (SPI)
Variable Functional Form
Linear Quadratic Cubic
Constant -0.0447 -0.0891 -0.1916
(-0.81) (-1.32) (-2.16)
STP 0.0866 0.0894 0.0915
(7.32)*** (6.56)*** (6.88)***
MAC 0.2439 0.4491 1.121
(4.43)** (2.38)** (1.92)**
MAC2 --- -0.1561 -1.5289
--- (-1.27) (-1.47)
MAC3 --- --- 0.7029
---- ---- (1.4)
INC -0.0602 -0.0493 -0.0577
(-1.49) (-1.12) (-0.97)
MON -0.0059 -0.0238 0.04104
(-0.04) (-0.17) (0.28)
TRA 0.0224 0.0229 0.0224
(3.88)** (4.6)** (4.06)**
R2(within 0.6379 0.6522 0.6578
R2(between) 0.6848 0.6644 0.7448
R2(overall) 0.6977 0.6918 0.7495
No of Obser. 50 50 50
No of Projects 10 10 10
F-stats (0.0000) (0.0000) (0.0000)
Hausman Test (0.8822) (0.8822) (0.8822)
Breusch-Pagan (0.7793) (0.7793) (0.7793)
Note: Estimation is based on Robust standard errors; **, *** denotes significance at 5% and 1% respectively. Values in the bracket for the estimated coefficient are the z sttistics while those for the F-stats, Hausman and Breausch-Pagan tests are the P-values.
Part 7. Conclusions
This paper has shown with clear analyses the past rural development programs implemented by the Federal Government of Nigeria. These programs were aimed at improving the general welfare and condition of the rural sector of the economy, which literature opines is about 75% of the country population. The analyses exposed the obvious unsustainability of these programs. A re-strategization in order to achieve the objective of governments’ drive towards rural development is therefore suggested in the paper. The suggested models take care of all observable and latent issues that impede sustainable rural development financing in Nigeria. The novel models derived from participatory attributes after years of field experience facilitating rural development in Nigeria expectedly possesses the robustness to institute sustainable rural development in Nigeria.
Appendix A
Table A1: Data Construction and Sources
Variable Definition/Measurement source
SPI Sustainable project implementation is the proportion of executed projects that are functional/ working. It is a proxy for sustainable rural development (SRD)
study
MAC Managerial Capacity is the proportion of entrepreneurs (doctors, engineers, technicians, technologists, merchants, traders, building contractors, artisans, and framers) that participated in the project
study
STP Stake Holders’ Participation defined as the proportion (percentage) of community based organizations (women group,
village council, NGOs, elders’ forum, traditional birth attendants, youth associations, security agents, local donor agents,
study
INC Institutional Capacity is the proportion/percentage of institutions (churches, schools, age grades, government agencies, formal financial institutions, informal financial institutions, and aid agencies) that has working link with the project
study
TRA Training defined as the number of trainings that were organized (by project implementers/facilitators) study MON Monitoring defined as the number of times project monitors visited projects study
Table A2. Summary Statistics of Variables
variable Obs. Mean Std. Dev Min. Max
SPI 50 0.2779 0.2139 0.03204 0.7559
MAC 50 2.39 1.3375 0.5814 5.3871
STP 50 0.3655 0.2897 0.086 1.2077
INC 50 2.2109 1.4131 0.5814 5.3871
TRA 48 0.4791 0.1987 0.2222 1
MON 50 0.3205 0.1629 769 0.8462
Source: Authors’ summary from data obtained from survey
Table A3. Correlation Matrix of Variables (Pearson Product Moment)
0 . 4 8 9 2 0 . 1 0 4 2 0 . 0 2 9 2 0 . 0 2 2 2 0 . 9 8 0 4
t r a - 0 . 1 0 0 1 - 0 . 2 3 2 5 - 0 . 3 0 8 6 * 0 . 3 2 2 8 * - 0 . 0 0 3 6 1 . 0 0 0 0
0 . 9 4 4 9 0 . 2 3 9 4 0 . 7 5 3 6 0 . 1 4 7 3
m o n 0 . 0 1 0 2 - 0 . 1 7 3 1 - 0 . 0 4 6 5 0 . 2 1 2 4 1 . 0 0 0 0
0 . 0 3 4 8 0 . 0 4 8 6 0 . 4 8 2 6
i n c - 0 . 2 9 9 2 * - 0 . 2 8 0 4 * 0 . 1 0 1 6 1 . 0 0 0 0
0 . 0 0 1 6 0 . 0 1 8 8
m a c 0 . 4 3 5 4 * 0 . 3 3 1 1 * 1 . 0 0 0 0
0 . 0 0 0 0
s t p 0 . 7 8 3 8 * 1 . 0 0 0 0
s p i 1 . 0 0 0 0
s p i s t p m a c i n c m o n t r a
[image:15.595.74.527.397.531.2]Source: Authors’ summary. Note: statistically significant figure (at 5% LOS) are starred
Table A4: Projects Included in Sample
Acronym Project
NASSI Nigeria Association of Small Scale Industrialist AKADP Akwa Ibom State Agric. Dev. Program
FEAP Family Economic Advancement Program FADAMA Fadama 111 Project
RBDA River BASIN Dev. Authority NSEHE-BANK Nsehe Micro Finance Bank, ltd.
RUFIN-IFAD Rural Financial Institution Program of International Fund for Agric. Development (IFAD) AK-RUWATSUN Akwa Ibom State Rural Water Supply and Sanitation
ACGSF Agric. Credit Guarantee Scheme Facility
NDE National Directorate of Employment, Akwa Ibom State
[image:15.595.73.530.560.644.2]Note: Projects where randomly selected. Some figures used for FEAP are based on estimates
Table A5. Repayment Rate of Loans Guaranteed by ACGSF
year Loans Guaranteed (N’m) Loans Repaid Difference
1978-1988 537,619.30 65,183.90 -472,435.40
1989 129,300.30 25,183.90 -77,116.40
1990 98, 494.4 60, 681.3 -37,818.10
1991 82,107.40 67,245.70 -14,861.70
1992 88,031. 8 69,496.00 -18,535.80
1993 80, 845.8 91,062.20 -10,216.40
Table A6- Utilization of Allocated FEAP Loan by State
S/N State Total Allocation N’000 Total Disbursement N’000 % of Utilization
1 Abia 98,869 62,695 63.41
2 Adamawa 127,044 69,352 54.59
3 Akwa Ibom 138, 843 65,670 47.3
4 Anambra 95,244 38,060 39.96
5 Bauchi 199,254 118,344 59.39
6 Bayelsa 109,935 44,420 40.41
7 Benue 151,125 113,831 75.32
8 Borno 165,812 105, 984 63.92
9 Cross River 124,200 61,170 49.25
10 Delta 118,332 68,430 57.83
11 Ebonyi 97,757 79,500 81.32
12 Edo 108,112 84,150 77.84
13 Ekiti 116,716 58,505 50.13
14 Enugu 98,195 58,783 70.05
15 F.C.T. 110,894 91, 331 82.36
16 Gombe 136,089 89,186 50.84
17 Imo 120,078 98,370 82.22
18 Jigawa 176,453 84,748 48,03
19 Kaduna 161, 605 115,042 71,19
20 Kano 243,169 198,970 81.82
21 Katsina 158.345 108,276 68.38
22 Kebbi 164,227 120,933 73.64
23 Kogi 134,455 108,558 80.74
24 Kwara 129,406 70,120 54.19
25 Lagos 198,936 104,890 52.73
26 Nasarawa 132,313 92,791 70.13
27 Niger 145,795 99,853 68.5
28 Ogun 126,872 73,510 57.94
29 Ondo 145,657 19,880 65.83
30 Osun 122, 580 74,630 60.88
31 Oyo 143,581 89,370 48.31
32 Plateau 135,145 129, 298 84.11
33 Rivers 161,883 102,342 63.22
34 Sokoto 166,410 122,796 73.79
35 Taraba 113,821 42,392 37.24
36 Yobe 134,353 90, 609 67.44
37 Zamfara 164,498 101,685 61.82
Total 5,176,809 3,326,675 64.26
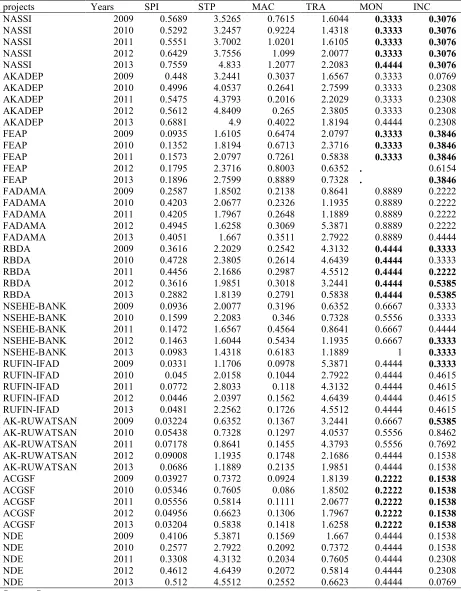
Table A7: Model Variables
projects Years SPI STP MAC TRA MON INC
NASSI 2009 0.5689 3.5265 0.7615 1.6044 0.3333 0.3076
NASSI 2010 0.5292 3.2457 0.9224 1.4318 0.3333 0.3076
NASSI 2011 0.5551 3.7002 1.0201 1.6105 0.3333 0.3076
NASSI 2012 0.6429 3.7556 1.099 2.0077 0.3333 0.3076
NASSI 2013 0.7559 4.833 1.2077 2.2083 0.4444 0.3076
AKADEP 2009 0.448 3.2441 0.3037 1.6567 0.3333 0.0769
AKADEP 2010 0.4996 4.0537 0.2641 2.7599 0.3333 0.2308
AKADEP 2011 0.5475 4.3793 0.2016 2.2029 0.3333 0.2308
AKADEP 2012 0.5612 4.8409 0.265 2.3805 0.3333 0.2308
AKADEP 2013 0.6881 4.9 0.4022 1.8194 0.4444 0.2308
FEAP 2009 0.0935 1.6105 0.6474 2.0797 0.3333 0.3846
FEAP 2010 0.1352 1.8194 0.6713 2.3716 0.3333 0.3846
FEAP 2011 0.1573 2.0797 0.7261 0.5838 0.3333 0.3846
FEAP 2012 0.1795 2.3716 0.8003 0.6352 . 0.6154
FEAP 2013 0.1896 2.7599 0.8889 0.7328 . 0.3846
FADAMA 2009 0.2587 1.8502 0.2138 0.8641 0.8889 0.2222
FADAMA 2010 0.4203 2.0677 0.2326 1.1935 0.8889 0.2222
FADAMA 2011 0.4205 1.7967 0.2648 1.1889 0.8889 0.2222
FADAMA 2012 0.4945 1.6258 0.3069 5.3871 0.8889 0.2222
FADAMA 2013 0.4051 1.667 0.3511 2.7922 0.8889 0.4444
RBDA 2009 0.3616 2.2029 0.2542 4.3132 0.4444 0.3333
RBDA 2010 0.4728 2.3805 0.2614 4.6439 0.4444 0.3333
RBDA 2011 0.4456 2.1686 0.2987 4.5512 0.4444 0.2222
RBDA 2012 0.3616 1.9851 0.3018 3.2441 0.4444 0.5385
RBDA 2013 0.2882 1.8139 0.2791 0.5838 0.4444 0.5385
NSEHE-BANK 2009 0.0936 2.0077 0.3196 0.6352 0.6667 0.3333
NSEHE-BANK 2010 0.1599 2.2083 0.346 0.7328 0.5556 0.3333
NSEHE-BANK 2011 0.1472 1.6567 0.4564 0.8641 0.6667 0.4444
NSEHE-BANK 2012 0.1463 1.6044 0.5434 1.1935 0.6667 0.3333
NSEHE-BANK 2013 0.0983 1.4318 0.6183 1.1889 1 0.3333
RUFIN-IFAD 2009 0.0331 1.1706 0.0978 5.3871 0.4444 0.3333
RUFIN-IFAD 2010 0.045 2.0158 0.1044 2.7922 0.4444 0.4615
RUFIN-IFAD 2011 0.0772 2.8033 0.118 4.3132 0.4444 0.4615
RUFIN-IFAD 2012 0.0446 2.0397 0.1562 4.6439 0.4444 0.4615
RUFIN-IFAD 2013 0.0481 2.2562 0.1726 4.5512 0.4444 0.4615
AK-RUWATSAN 2009 0.03224 0.6352 0.1367 3.2441 0.6667 0.5385
AK-RUWATSAN 2010 0.05438 0.7328 0.1297 4.0537 0.5556 0.8462 AK-RUWATSAN 2011 0.07178 0.8641 0.1455 4.3793 0.5556 0.7692 AK-RUWATSAN 2012 0.09008 1.1935 0.1748 2.1686 0.4444 0.1538
AK-RUWATSAN 2013 0.0686 1.1889 0.2135 1.9851 0.4444 0.1538
ACGSF 2009 0.03927 0.7372 0.0924 1.8139 0.2222 0.1538
ACGSF 2010 0.05346 0.7605 0.086 1.8502 0.2222 0.1538
ACGSF 2011 0.05556 0.5814 0.1111 2.0677 0.2222 0.1538
ACGSF 2012 0.04956 0.6623 0.1306 1.7967 0.2222 0.1538
ACGSF 2013 0.03204 0.5838 0.1418 1.6258 0.2222 0.1538
NDE 2009 0.4106 5.3871 0.1569 1.667 0.4444 0.1538
NDE 2010 0.2577 2.7922 0.2092 0.7372 0.4444 0.1538
NDE 2011 0.3308 4.3132 0.2034 0.7605 0.4444 0.2308
NDE 2012 0.4612 4.6439 0.2072 0.5814 0.4444 0.2308
NDE 2013 0.512 4.5512 0.2552 0.6623 0.4444 0.0769
Source: Survey
References
Abe, S. I. (1984). The Rural Banking Programme: An Appraisal. CBN Publication, CBN Bullion.
Afentiou. P. C., & Serletis, A. (1992). Modeling the Relationship between Output and Government Expenditure in Canada. Kero Economic Studies, 29 (1), 17-43.
Akangbe, J. A., Ogunyinka, W., Ayanda, I. F., Achem, B., & Adisa, R. S. (2012). An Assessment of Effects of Fadama II Project on Livelihood of Farmers in Orire Local Government Area of Oyo State, Nigeria. Nigerian Journal of Agriculture, Food and Environment, 8 (1), 27-32.
Amartya, K. S. (1983). Poverty and Famines: An Essay on Enlightenment and Deprivations. USA: Oxford University Press.
Agene, E. E. (1995). The Principles of Modern Banking. Abuja: Gene Publications Ltd. Batten, T. R. (1939). Tropical Africa in World History Bk, I, O.U. P. London pp24-41.
Binswanger, H., & Aiyar, S. (2003). Scaling up Community-Driven Development: Theoretical Underpinnings and Programme Design Implications. World Policy Research Working Paper No. 3039 Washington, DC.
CBN/ NISER (1992). Impact of Sap on Nigeria Agriculture and Rural Life: A Research Report. Lagos: Page Pub. Ltd.
Chambers, R. (1983). Rural Development: Putting the Last first. Harlow: Longman.
Chambers, R. (1994a). The Origins and Practice of Participatory Rural Appraisal. World Development, 22 (7), 953-969.
Chambers, R. (1994b). Participatory Rural Appraisal: Analysis of Experience. World Development, 22 (9), 1253-1268.
Coomer, J. C. (1981). Quest for a Sustainable Society. New York: Pergamon Press.
Country Programme Evaluation (2007) Nigeria, IFAD Office of Evaluation Approach Paper, October.
Dasgupta, A. & Beard, V. (2007). Community-Driven Development, Collective Action and Elite Capture in Indonesia. Development and Change, 38 (2), 229–249.
Demirbas, S., (1999). Cointegration Analysis-Causality Testing and Wagner’s Law: The Case of Turkey, 1950-1990. Paper presented at the annual Meeting of the European Public Choice Society held in Lisbo. Dongier, P., Van-Domelen, J., Ostrom, E., Rizvi, A., Wakeman, W., Bebbington, A., Alkire, S., Esmail, T., &
Polski, M. (2001). Community-Driven Development. In J.Klugman, eds.,“A Sourcebook for Poverty
Reduction Strategies” Vol.1. Washington, DC: World Bank.
Ekong, C. N. (1997). Framework for Building sustainable Poverty Alleviation Strategies in Nigeria. Nigerian Economic Society annual Conference Proceedings, pp.555- 568.
Ekong C. N. (1998). The Effectiveness of Government Rural Development Policies. A paper presented at the International Conference on Economic Development, Governance and Democracy in Africa, Howard University, Washington D. C. (Oct. 25).
Ekong, E. E. (1991). Rural Development and the Persistence of Poverty. Inaugural Lecture Series No. 1, Univ. of Cross River State, Uyo.
Ekong, C. N. & Ayara, N. N. (2002). The Gains and Strength in Participation: A case Study of Mbiabet Ikpe Rice Farm Project in Nigeria. International Institute for Environment and Development, (44), 60-64. Easang, S. (1981). Growth Models and Rural Development. In Olayide S. O. et al (eds) Element of Rural
Economics Ibadan Univ. Press.
Ekong, C. N., & Onye, K. U. (2012). Economic Development in Nigeria: The Basic Needs Approach. Journal of Economics and Sustainable Development, 3 (10), 54-65.
Ekpo, A.H. (1994). Fiscal Federalism: Nigeria's Post-independence Experience, 1960-90. World Development, 22 (8), 1129- 1146.
Evbuomuam, G. O. (1997). Poverty Alleviation through Agricultural Projects: A Review of the Concepts of the world Bank Assisted Agricultural Development Projects. Nigerian Economic Society Annual Conference Processing, pp.533-553.
Gerschenkeron, A. (1962). Economic Backwardness In Historical Perspective: A Book Of Essays. Cambridge, MA: Harvard University Press.
Harris Jonathan M. (2000). Basic Principles of Sustainable Developemnt. Global Developemt and Environmental Institute, Tufts University Medford MA USA. Working Paper 00-04.
IFAD (2009). Country Programme Evaluation, Federal Republic of Nigeria. Report No. 1959-NG. IFAD (2013). Enabling Poor Rural People to Overcome Poverty in Nigeria.
Inglis, A. & Hesse, C. (2002). Overview: Local Governments- potentially the most important day to day real-world users of innovative participatory approaches. International Institute for Environment and Development, (44), 4-7.
Jovanovic, B. (1982). Selection and the Evolution of Industry. Econometrica, 50(3), 649-670.
Koinyan, P. (1994). Why Integrated Rural Development is A must from Us as A People and Nation. Directorate for Food, Road and Rural Infrastructure (DFRRI), Lagos, Nigeria.
Labonne, J., Biller, D., & Chase, R. (2007). ‘Inequality and Relative Wealth’, Do they matter for trust?
Evidence from poor communities in the Philippines. Social Development Papers, Community-Driven Development, Paper No. 103. Washington, DC: World Bank.
Lele, U. (1975). The Design of Rural Development: Lesson from Africa. Balfiawore USA: The John Hopkins University Press.
Lipton, M. (1977). Why the Poor Stay Poor. London: Temple Smith.
Lucas, Robert E. Jr. 1978. "On the Size Distribution of Business Firms." Bell Journal of Economics 9(2):508-23. Mahbub ul, H. (1976). The Poverty Curtain. USA: Columbia University Press.
Mahbub ul, H. (1995). Reflections on Human Development. USA: Oxford University Press.
McKinnon, R. J. (1973). Money and Capital in Economic Development. Washington D. C: Brookings Institution. Meadows, D. H., Meadows, D. I., Randers, J., & Behrens, W. W. (1972). The limits to growth: A report for the
Club of Rome’s project on the predicament of mankind. New York: Universe Books.
Mensah, S. A., & Ojowu, O. (1991). Rural Urbanization and Rural Development: An Analysis of Rural Development Strategies in Nigeria. Nigerian Rural Sociological Association.
Nkonya, E., & Davis, K. (2008). The Statistical challenges of attributing Impact of demand- Driven advisory services programs and farmer school in Africa. Paper Presented at the Workshop on: Rethinking Impact: Understanding the Complexity of Poverty and Change. Columbia, March 26-29, 2008. IFPRI. Nkonya, E., Philip, D., Mogues, T., Pander, J., Yahaya, M.K., Adebowale, G., Arokoyo, T., & Kato, E. (2008).
Community-Driven Development in Nigeria. IFPRI discussion Paper 00756, IFPRI Washington. Norton, Bryan G. (2005). Sustainability: A philosophy of adaptive ecosystem management. Chicago: University
of Chicago Press.
Nwanchukwu and Ezeh, C. I. (2008). Impacts of Selected Rural Development Programmes on Poverty Alleviation in Ikwuano, LGA, Abia, Nigeria. Afr.J. Food Agric. Nutr. and Development, 7 (5).
Okonny, I. G. P. (1994). Rural Development: The Option Open to Community Banks. A Paper presented at the 3rd Anniversary Conference of Community Banks.
Olatoyinbo, A. (1997). Family Economic Advancement Programme: An Insight. Community Banks Newsletter,
Abuja, 2, 6-7.
Olayide S. O. et al. (1984). Perspective in Benin–Owenna River Basin Development. Ibadan: Ibadan University Press Nigeria.
Olayide, S. and (1981). Meaning and Scope of Rural Economics. In Olayide, S. O. et al (eds.) Element of Rural Economics. Ibadan: Ibadan University Press Publishing House.
Oyovbaire, S., & Olagunju, T. (1994). Foundation of A new Nigeria. Ibadan: Precision Press.
Phillips (1999). The Role of Agricultural Development Project (ADP) in the Economic Development of Nigeria. An Unpublished Project in the Department of Economics, University of Uyo, Uyo. Nigeria.
Robinson, J. (1952). The Rate of Interest and Other Essays. London: Macmillian.
Schumpeter, S. (1934): The Theory of Economic Development. Cambridge Mass: Harvard University Press. Sen, Amartya. (1999). Development as freedom. New York: Random House.
Shaw, E. S. (1973): Financial Deepening in Economic Development. New York: Oxford University Press. Thirwall, A. P. (1983). Growth and Development: with Special Reference to Developing Countries. ElBS/
Macmillan.
Umar, A. M., & Phoa, C. L. J. (2012). The Effect of Fadama II on Agro-Processing Among Farmers in Adamawa State of Nigeria. Global Advanced Research Journal of Agricultural Science, 1(5), 117-122.
Umar, A. M., Phoa, C. L. J., & Khalique, M. (2012). An Investigation of the Impact of Fadama II Project on the Adoption and Demand for Advisory Services in Adamawa State, Nigeria. International Journal of Academic Research in Business and Social Sciences, 2 (1), 62-71.
United Nation (2008). Measuring Sustainable Development. Report of the Joint UNECE/OECD/Eurostat Working Group on Statistics for Sustainable Development, New York and Geneva.
Van-Loon, E. (1950). The Story of Mankind. London: Hanrap
World Bank (2003). Poverty Environment Linkages in the Natural Resource, Nigeria.
World Bank (2004). Memorandum of the President of the International Development Association and the International Finance Corporation to the Executive Directors on a World Bank Group Second Joint Interim Strategy Progress Report for the Federal Republic of Nigeria.