ISSN: 1816-949X © Medwell Journals, 2014
Multifocus Image Fusion Using Improved Dual Tree Complex
Wavelet Transform and Discrete Optimization Method
K. Srilatha
Department of Electronics and Communication Engineering, Sathyabama University, Chennai, Tamilnadu, India
Abstract: This study deals with the integration of medical images with multimodal Medical Image Fusion (MIF)
problem, employing Improved DT-CWT (Dual Tree Complex Wavelet Transform) and a Discrete Optimization Method is to introduce a new approach to fuse panchromatic image and multi-spectral images. In image fusion, two approaches used namely Spatial and Transform. In Spatial fusion, it reduces structural distortions. But, wavelet transform affect the absence of shift invariance and low directional selectivity. These two disadvantages are overcome by Improved DT-CWT (Duel Tree Complex Wavelet Transform) and the problem as a discrete multilevel optimization of an energy functional that balances the offerings of three conflicting terms: a squared error of both MRI and CT Image which giving out strong MRI/CT edges and a prior which favours smooth results by encouraging neighbouring pixels to have similar fused-image values and introduce a transparency-labelling formulation which decreases the computational load. The proposed Improved DT-CWT discrete optimization method is remarkably better than the other fusion method.
Key words: Image fusion, DT-CWT, graph cut, MRI, CT
INTRODUCTION solution to be related to the MR input with preference
The fusion of images acquired from various a prior, favouring smooth solutions by encouraging instruments is of great significance in medical imaging, neighbouring pixels to have similar fused image value. computer vision, microscopic imaging and remote Further, introduce a transparency labelling formulation sensing. Image fusion can well-defined as the techniques (Miles et al., 2013) medical Image Fusion Via Graph Cuts by which numerous images or few of their features are a recommended which significantly reduces the combined together to form a single image with aiming at computational load. The proposed discrete optimization achieving improved CT, MR image quality to better of graph-cut fusion guarantees nearly global solutions improved image classification, monitoring. Fused image Praveena and Vennila (2009) whereas avoiding the will enrich reliability and rapidity of feature extraction, pixilation artifacts that affect standard wavelet based increase the usage of the data sets and extend medical methods.
images application area. Improved DT-CWT based image This study further discusses Boykov and fusion method has developed to combine a resultant Kolmogorov (2004) Image Fusion Improved DT-CWT image with enhanced perceptual as well as quantitative algorithms, entropy, image quality metrics and results with image feature indices. A bilateral sharpness established discussion.
weighting scheme has applied for the high frequency
coefficients taking mutually gradient and its phase The dual-tree complex wavelet transform: The main coherence in account. A normalized maximum gradient discussion of Kingsbury (1998) and Adelson et al. (1984) weighting scheme has executed for low frequency wavelet in this study bring into line along two methods. The components. The proposed method shows greater previous technique of DWT is related Kingsbury (2000) result as compared to DWT and traditional DCWT based and Boykov and Kolmogorov (2004) with the proposed image fusion algorithms. Image fusion is a discrete DT-CWT Method. The development of the research work multilabel optimization problem Boykov et al. (2001) and into the arena of image fusion can be generally, brought Kolmogorov and Zabin (2004) a recommanded via the into the following stages as Wavelet Transformation and well-known swap or alpha-expansion moves. The DT-CWT Method. The proposed improved version of proposed energy function balances the contributions of image fusion DT-CWT algorithm and associate it with three competing terms: a squared error which boosts the Wavelet Based Image Fusion algorithm (Fig. 1).
n
(t) = k1(m) (2t m)
Ψ
∑
ϕ −jw j0.5 w jw
0 0
H ' (e ) e= − H (e ) for | K |< π
jw jwd ej (w- )
1 0
F (e ) = e− H π
jw j0.5w jw
1 1
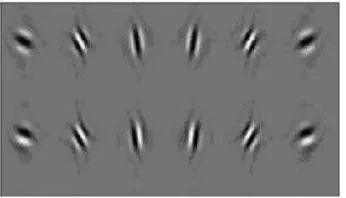
[image:2.612.104.277.101.200.2]H' (e ) =−jsgn (w) e H (e ) for |K|<π Fig. 1: Directionality of DT-CWT are able to separate all parts of the M-dimension
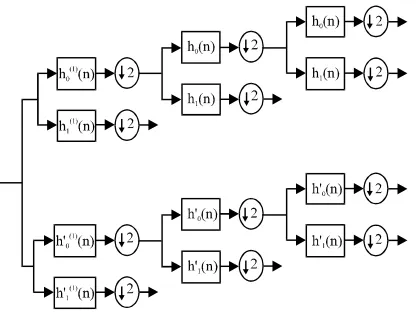
Fig. 2: Four levels of CWT tree for real 1-D input signal x The filter bank structure of the DT-CWT has CWT filters which have complex coefficients and make complex output samples and shown in Fig. 2 in which each block is a complex filter and contains down sampling by 2 at its outputs. Subsequently, the output sampling rates are unaffected from the DWT but each sample has a real and imaginary part, a redundancy of 2:1 is bring together. The complex filters can be designed such that the magnitudes of their step responses low with input.
Extension of CWT to 2-dimension is reached by separate filtering along rows and then columns. On the other hand if row and column filters both quash negative frequencies, then only the first quadrant of the 2-dimension signal spectrum is taken. Two adjacent quadrants of the spectrum are necessary to denote fully a real 2-dimension signal, so filter with complex conjugates of either the column or row filters. Kingsbury (2001) discussed discrete wavelet transform. This introduces limited redundancy. This provided 4:1 redundancy in the transform 2-dimension signal. If the signal occurs in M-Dimension (M>2), then additional conjugate sets of filters required for each dimension leading to redundancy of 2 :1. The greatestm
computational effective way to succeed the pairs of conjugate filters are to keep separate imaginary operators, i and i for the row and column operation, this produce1 2
4-element ‘complex’ vectors: {r, i , i , i i } (where r means1 2 1 2
‘real’). Each 4-vector can be converted into a pair of conventional complex 2-vectors by letting i = i = i1 2
in one case and i = -i = -i in the other case. This1 2
relates to sum and difference processes on the {r, i , i }1 2
and {i , i } pairs in the summation blocks and creates two1 2
complex outputs, consistent to first and second quadrant directional filters, respectively. Complex filters in multiple dimensions are accountable for true directional selectivity, even though being implemented separate, ever since they frequency space. For example a 2-dimension DT-CWT creates six band pass sub-images of complex coefficients at every single level which are extremely oriented at angles of ±15°, ±45°, ±75°. Represent the wavelet related with the first wavelet filters bank as per Q(t) and the wavelet related with the second filters bank as Q’ (t). The wavelet Q’ (t) can be discussed by Kingsbury (1998) and Li et al. (1995).
(1)
where, n(t) = En k0 (m) n (2t-m). The second wavelet,
Q’ (t) can be defined correspondingly in terms of {k’ (n), k’ (n)}. For the ideal DT-CWT, the second0 1
wavelet, Q’(t), can be the Hilbert transform of the first wavelet, Q (t) (Kingsbury, 2001; Boykov and Kolmogorov, 2004; Boykov et al., 2001; Kolmogorov and Zabin, 2004).
Q’(t) = H{Q(t )} (2) If the low-pass filter k’ (n) is equivalent to the half0
sample delayed version of k (n), at that time the wavelets0
made by the DT-CWT content as desired. If the given wavelets, Q (t) and Q’(t) are orthogonal to its integer translates, at that moment the Hilbert relation is satisfied only if:
(3) Recollection of an orthonormal wavelet basis, the low pass and high-pass filters are associated as:
(4) Consistently, k (n) = (-1) nk (d-m) where ‘d’ is an odd1 0
integer. Later, it follows from that for the perfect DT-CWT whose filter bank structure as presented in Fig. 3, the high-pass filters satisfy:
[image:2.612.79.287.149.370.2]( )
: N N S
ϒ ∈ Φ → ϒ ε
( )
(
( )
)
( )
(
)
(
( )
)
i 2
1 1 2 2
KT KTN N N I S N R
W S e n 2 W S e n
ϒ = ∑ ϒ ∈Φ = ∑ ∈ ∑ ∈
− + −
1 1 1 2
2 2 1 2
W = [(| e | K)/(| e | K) + | e | K)];
W = [(| e | K)/(| e | K) + | e | K)]
∆ × ∆ × ∆ ×
∆ × ∆ × ∆ ×
( )
( )
(
( ) ( )
)
V ϒ = ∑ r,q ∈R S ϒ r ,ϒ q
( ) ( )
(
)
(
)
V r ,ϒ ϒ q =min c, |lp−lq|
(
)
1 2
[image:3.612.80.289.94.250.2]eα= α + − αe 1 e Fig. 3: Implementation of DTCWT using two wavelet
filters
Improved DT-CWT has done by performing the subsequent steps here
S1: Images size testing. If the sizes of input images are equal then input images are registered with each other and send them to the next level. Zeng et al. (2006) were suggested evaluated with quantitative techniques. If the sizes of both the input images are not similar then the algorithms shows the discontinue process. Image fusion using wavelet decomposes the input images MR and CT into estimated and detailed coefficients at required level Hu et al. (2005) using improved DT-CWT. The estimate and detailed coefficients of input images are combined using fusion rule. Read two input image as a matrix.
S2: Convert to improved DT-CWT domain. After registering the both input images with each other it send input images to Wavelet domain for more processing. Apply improved DT-CWT, along row and column wise on whole matrix of the image.
S3: Improved DT-CWT domain fusion. In this level, decomposing the images into some mechanisms and applied the DT-CWT function on these mechanisms for getting the desired result.
S4: Discrete optimization of graph-cut fusion algorithm multi label formulation. And calculate standard deviation, entropy image quality index and edge intensity for reconstructed image and also as shown in flow chart in Fig. 4, the task developed to perform the image fusion has four basic blocks: the proposed image fusion is applied in graph method domain as given after.
In this Fig. 4, where 5 is a labelling function by which each and every point in image domain 5 is assigned to a label l, defining the intensity of fused image at that point.
Fig. 4: Flow chart of improved DT-CWT image fusion process
(6)
S denotes a near finite set of integers. The Data term K5' is defined as:
( 7)
where, 5P : 51 ÷5E and 5P : 52 ÷5E represents the input CT, MR images and 5E5Q is the label one region. W and W1 2
weights can be defined as follows:
(8)
K denotes the kernel function. The W and W determine1 2
the solution toward strong edges in e and e ,1 2
respectively. S is the smoothness term which provides smooth solutions by making the neighbouring pixels Miles et al. (2012) to have related fused-image values:
(9)
where, P is a set of paired of pixels r and q in a local neighbourhood of r and V(5 (r), 5 (5)) is defined as:
( 10)
where, c be a positive constant. Alpha blending reformulation. The number of labels required to express the output image can be equal to the quantity of possible pixel values. This aims a high computational load in the case of images with large active ranges (Karlo et al., 2010) so as to reduce the quantity of labels, the data term is reformulated as a transparency labelling:
(11)
( )
( )
(
)
21 1
2
1 2
w e n, l e p I 1n n R1
w (e (n,1) e (p))
α α − + ∑ ∈ ∑ ∈ −
( ) (
1) ( ) (
1 l) ( )
2eα n, l = 1/ N ×e p + −1 1 / N e n ; l S× α
{
1 2}
I = [DT-CWT(I )+DT-CWT(I )]/2
1 1 2
2 1 2
W [DT-CWT(I )+W I =
DT-CWT(I )]/(W +W )
× × 2 10
PSNR = 10Log (255/ e )
(
ij ij)
2 NCC i 1 to m j 1 to m R F
i 1 to m j 1 to m R
= ∑ = ∑ = × ÷
∑ = ∑ =
2 E = i = 0 to l-1pi log pi∑ × a reduced set of non-negative integer labels {0, 1, 2,...,N },l
parameterized by the user specified number of labels N .l
Graph-Cut Optimization:
Where:
(12)
With S5 being a reduced set of non-negative integer labels {0, 1, 2,...,N }, parameter by the user listed numberl
of labels N Graph-Cut Optimization. Just one label isl
specified to every single pixel in the image, Adelson et al. (1984) and Rensink (2002) were discussed about image data compression, enhancement, analysis and graphics that associated data and smoothness costs specified to the links in the graph cut. Let G = {M, 585*} be a weighted graph where M has a set of nodes for every pixel in 5 and for each label in S. It is an edge e {r, q} between each pairs of node p, q. A cut 560585* is a set of edges sorting out the label node from each other. A cut 56 with the lowermost cost is the least cut problem. The cost of this least cut |56| is equal to the addition of the edge weight of 56. For real computation of least cost cuts, it is required to appropriately set the weights of the graph. The least cut is designated at all stage with the final labelling consistent to a lowermost of the energy function. Here lowest graph cut optimization is applied to next level.
S5: Inverse Dual Tree complex wavelet transforms. Later reunion all these decompose element with each other and had the final fused image.
The fused image , I must be acquired by taking the inverse Dual Tree Complex Wavelet Transform (IDT-CWT) as:
(13) The fusion rule used at this time simply means the estimate coefficients and picks the detailed coefficient in each sub band with the primary magnitude. Also, additional weights might be selected along with the DWT of the images. The fused image can be acquired by taking the Inverse Discrete Wavelet Transform (IDWT) as:
(14)
MATERIALS AND METHODS
Image quality metrics: The general requirement of an
[image:4.612.337.518.99.313.2]image fusing procedure is to scope all valid and valuable
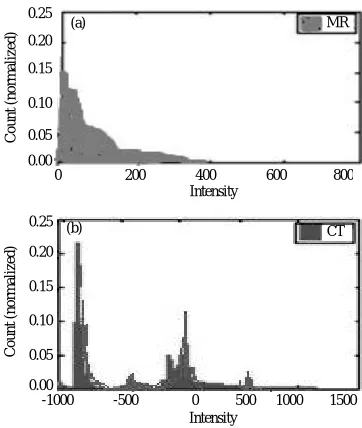
Fig. 5: Histogram of 20 MR and CT images
information data from the CT, MR input images but all at once it must not present any distortion in resultant fused image. Performance measures are used to measure the all possible supports of fusion and also used to compare results with different algorithms (Laporterie and Flouzat, 2003).
Peak signal to noise ratio: The PSNR is used to calculate
the relationship between CT, MR input images. The PSNR between the input image R and the fused image F is defined as:
(15)
For improved fused image PSNR value is high.
Normalized cross correlation: The normalized cross
content between the source image R and the fused image F is defined as:
(16)
Entropy E: Entropy is used to evaluate the
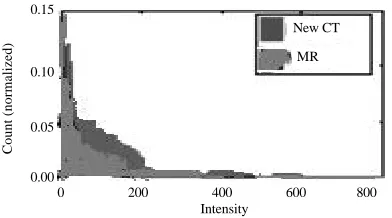
amount of data. Boykov and Kolmogorov (2004), Krishnamoorthy and Soman (2010) and Praveena and Vennila (2009) were suggested that energy minimization in low-level. Greater value of entropy shows that the information data increases and the fusion performances are improved (Fig. 5 and 6):
(17)
Intensity
Count (normalized)
0 200 400 600 800 0.25 0.20 0.15 0.10 0.05 0.00
(a) MR
Fig. 6: Histogram of after pre-processing CT and MRI
RESULTS AND DISCUSSION
In this study, it describes a typical sample of the fusion outcomes and report some statistical valuations. Some medical images of CT, MR images are chosen for fusion. Images are fused with different methods WT, Harr WT, CWT DT-CWT. These images used to compare with the image fused by improved DT-CWT. The performance of the fusion method based on Dual Tree complex wavelet transform using image quality indexes is estimated. Average value, standard difference, entropy, average gradients and edge intensity are selected. Average value is shown in Table 1. The distribution of the image gray scale in the rough. Standard difference and entropy can be measured the data abundance in the image. An average gradient shows exiguous contrast, diverse texture characteristic and explanation of the image. The inference accords with our statement. The statistics of standard difference and entropy appearance that spatial resolution of all the fused images have better-quality, average gradients and edge intensity of Table 1 both are highest, subsequently, the information have improved in fusion process bone and soft tissue and other objects have distinguished more easily. In a word, although there is improved small spectral distortion in the fused image based on Improved dual tree complex wavelet transform, it is spatial resolution and details texture have enhanced remarkably. Mean error shows Table 2 that the fusion method based on dual tree complex wavelet transform is better than the other fusion method. This algorithm have also evaluated based on the visual superiority of the fused images. Total 30 people had been chosen in random manner to visually estimate the fused images prepared in each of the 10 sets and examined to select the finest and worst image they have found in each image pair. The results validated had based on image metric. CWT with Duel Tree was rated 75% which had higher rating given to the other algorithms.
[image:5.612.87.283.100.209.2]Fig. 7: CT image
Fig. 8: MR image
Fig. 9: Fused image
Table 1: Numerical assessment for fusion of CT and MR medical images Quality indices
---Methods Average gradient Edge intensity Entropy SD DWT 3.958 41.9148 3.801 91.890 HARR DWT 4.110 43.7982 3.990 97.001 Improved DT-CWT 4.209 45.0100 4.286 100.982
These results had been obtained with a Matlab implementation of the algorithm as part of an image fusion toolbox (Fig. 7-12).
Intensity
Count (normalized)
0 200 400 600 800 0.15
0.10
0.05
0.00
[image:5.612.355.508.429.575.2]Table 2: Mean fusion error for the patient data sets and statistical test results for the different fusion methods
Methods eMR tissue eCT tissue PPair wise PIndependent Improved DT-CWT graph cuts 45.86±12.123 80.67±51.56 0.0056 0.01892 Piella (Kolmogorov and Zabin, 2004) 152.8±52.6 175.9±54.0 0.002 0.006 Contourlet (Li et al., 1995) 73.4±28.6 64.2±24.9 <0.001 0.083 DWT (Deyo et al., 2009) 64.9±26.1 63.9±25.9 <0.001 0.707
Averaging 64.2±26.0 64.2±26.0 1 1
CT bone MR bone Pair wise Independent
e e P P
Improved DT-CWT Graph Cuts 55.89±10.9 106±35.62 <0.00091 <0.00091 Piella (Kolmogorov and Zabin, 2004) 84.1±40.6 188.7±48.0 <0.001 <0.001 Contourlet (Li et al., 1995) 82.6±19.7 89±18.6 <0.001 0.121 DWT (Deyo et al., 2009) 81.9±19.7 83.7±19.8 <0.001 0.583
[image:6.612.153.467.464.705.2]Averaging 82.5±19.8 82.5±19.8 1 1
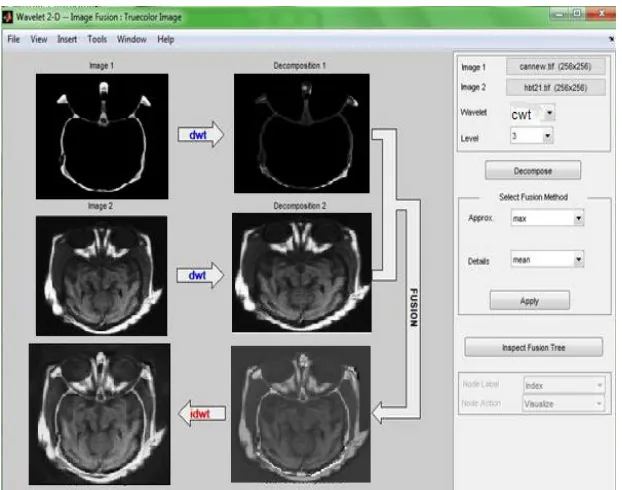
Fig. 10: GUI for DT-CWT fused image
Fig. 12: GUI for image fused DT-CWT
CONCLUSION proposed fusion technique leave behind other methods.
In this study, image fusion process specifically contribution towards the enhancement of image fusion Discrete Wavelet Transform Method, DWT Harr and quality.
Improved DT-CWT Method using entropy, standard deviation quality index and image metrics have analysed. These investigates had conducted by using MATLAB. Depending upon the purpose of a specified application:
C Desire a fusion result that show more aspect in colour, for improved image analysis
C Fusion result that improves the correctness of digital grouping
C Visually good-looking fused colour image, merely for conception purposes
The proposed fusion method compensates all the limitations of DWT by the implementation of Improved DT-CWT. It also eliminates the ringing artefacts presented in the fused image by assigning suitable weighting to high pass wavelet coefficients and low pass coefficients individually. The normalized maximum gradient built sharpness criterion for low frequency coefficients improves the background texture data as well as expands the quality of the blurred areas in the fusion end result. The most vital data contents hidden in the high frequency coefficients are also increased up by the carrying out of bilateral sharpness criterion. From the image quality valuation Table 2, it was clear that the
In future study image registration has significant
REFERENCES
Adelson, E.H., C.H. Anderson, J.R. Bergen, P.J. Burt and J.M. Ogden, 1984. Pyramid methods in image processing. RCA Eng., 29: 33-41.
Boykov, Y. and V. Kolmogorov, 2004. An experimental comparison of min-cut/max-flow algorithms for energy minimization in vision. IEEE Trans. Pattern Anal. Mach. Intell., 26: 1124-1137.
Boykov, Y., O. Veksler and R. Zabih, 2001. Fast approximate energy minimization via graph cuts. IEEE Trans. Pattern Anal. Mach. Intell., 23: 1222-1239. Deyo, R.A., S.K. Mirza, J.A. Turner and B.I. Martin, 2009.
Overtreating chronic back pain: Time to back off? J. Am. Board Fam. Med., 22: 62-68.
Hu, Y., S.K. Mirza, J.G. Jarvik, P.J. Heagerty and D.R. Haynor, 2005. MR and CT Image Fusion of the Cervical Spine: A Noninvasive Alternative to CT-Myelography. SPIE Pulications, Bellingham WA. Karlo, C.A., I. Steurer-Dober, M. Leonardi, C.W.A.
Kingsbury, N., 1998. The dual-tree complex wavelet Li, H., B.S. Manjunath and S.K. Mitra, 1995. Multisensor transform: A new efficient tool for image restoration
and enhancement. Proceedings of the European Signal Processing Conference, July 1-3, 1998, Glasgow, Scotland.
Kingsbury, N., 2000. A dual-tree complex wavelet transform with improved orthogonality and symmetry properties. Proceedings of the IEEE Conference on Image Processing, Volume 2, September 10-13, 2000, Vancouver, BC., Canada, pp: 375-378.
Kingsbury, N.G., 2001. Complex wavelets for shift invariant analysis and filtering of signals. J. Applied Comput. Harmonic Anal., 10: 234-253.
Kolmogorov, V. and R. Zabin, 2004. What energy functions can be minimized via graph cuts? IEEE Trans. Pattern Anal. Mach. Intell., 26: 147-159. Krishnamoorthy, S. and K.P. Soman, 2010. Implementation
and comparative study of image fusion algorithms. Int. J. Comput. Applic., 9: 25-35.
Laporterie, F. and G. Flouzat, 2003. Morphological pyramid concept as a tool for multi resolution data fusion in remote sensing. Integrated Comput. Aided Eng., 10: 63-79.
image fusion using the wavelet transform. Graphic. Models Image Process., 57: 235-245.
Miles, B., I.B. Ayed, M.W.K. Law, G. Garvin, A. Fenster and S. Li, 2013. Spine image fusion via graph cuts. IEEE Trans. Biomed. Eng., 60: 1841-1850.
Miles, B., M.W.K. Law, I. Ben-Ayed, G. Garvin, A. Fenster and S. Li, 2012. Pixel level image fusion for medical imaging: An energy minimizing approach. Proceedings of SPIE Medical Imaging, February 4-9, 2012, San Diego, CA.
Praveena, S.M. and I.L.A. Vennila, 2009. Image fusion by global energy merging. Int. J. Recent Trends Eng., 2: 61-65.
Rensink, R., 2002. Change blindness. Ann. Rev. Psychol., 53: 245-277.