warwick.ac.uk/lib-publications
A Thesis Submitted for the Degree of PhD at the University of Warwick
Permanent WRAP URL:
http://wrap.warwick.ac.uk/88282
Copyright and reuse:
This thesis is made available online and is protected by original copyright.
Please scroll down to view the document itself.
Please refer to the repository record for this item for information to help you to cite it.
Our policy information is available from the repository home page.
Quantitative Crystal
Investigations: Surface
Dissolution and Nucleation
Processes
Alexander Stuart ParkerThesis submitted for the degree of
Doctor of Philosophy
Electrochemistry and Interfaces Group,
Department of Chemistry,
University of Warwick.
i
ii
Quantitative Crystal Investigations:
Surface Dissolution and Nucleation
Processes
Alexander Stuart Parker
I.
Table of Contents
I. TABLE OF CONTENTS ____________________________________________ II
II. LIST OF FIGURES ____________________________________________ VII
III. LIST OF TABLES _____________________________________________ XIII
IV. DECLARATION AND INCLUSION OF PUBLISHED WORK _____________XIV
V. ACKNOWLEDGEMENTS _______________________________________XVI
VI. DEFINITION OF ACRONYMS __________________________________ XVII
VII. GLOSSARY OF SYMBOLS ______________________________________ XIX
VIII. ABSTRACT _________________________________________________ XX
1 INTRODUCTION ________________________________________________ 2
1.1 SURFACE SCIENCE_____________________________________________ 3 1.2 ENAMEL ___________________________________________________ 4
1.2.1 Structure of the Tooth ____________________________________ 4
1.2.2 Prevalence of acid dissolution in the oral cavity ________________ 8
1.2.3 Introduction to Acid Erosion and Remineralisation _____________ 9
1.2.4 Enamel Dissolution ______________________________________ 12
1.2.5 Enamel Dissolution Inhibitors _____________________________ 16
1.2.6 Enamel summary _______________________________________ 17
iii
1.3.1 Applications of Crystal Nucleation, Growth and Dissolution _____ 22
1.3.2 Crystal Nucleation Theory ________________________________ 24
1.3.3 Polymorphism __________________________________________ 27
1.3.4 Applications to CaCO3 ___________________________________ 30
1.3.5 Confinement of crystal growth ____________________________ 32
1.3.6 Calcium Carbonate growth inhibition _______________________ 33
1.4 MASS TRANSPORT AND SURFACE REACTION KINETICS ___________________ 36 1.5 TECHNIQUES FOR SURFACE ANALYSIS _______________________________ 37
1.5.1 Optical Microscopy ______________________________________ 37
1.5.2 SPM Methods __________________________________________ 38
1.5.3 Field Emission Scanning Electron Microscopy (FE-SEM) _________ 54
1.5.4 Micro-Raman Microscopy ________________________________ 55
1.6 FINITE ELEMENT METHOD (FEM) MODELLING _________________________ 57 1.7 CHEMICALS,INSTRUMENTATION AND METHODS _______________________ 59 1.8 THESIS AIMS _______________________________________________ 60
2 COMBINATORIAL LOCALIZED DISSOLUTION ANALYSIS: APPLICATION TO
ACID-INDUCED DISSOLUTION OF DENTAL ENAMEL AND THE EFFECT OF SURFACE
TREATMENTS ____________________________________________________________ 64
2.1 ABSTRACT _________________________________________________ 64 2.2 INTRODUCTION _____________________________________________ 65
2.3 EXPERIMENTAL DETAILS ________________________________________ 69
2.3.1 Solutions ______________________________________________ 69
2.3.2 Enamel Sample Preparation ______________________________ 70
2.3.3 SECCM method _________________________________________ 72
2.3.4 Atomic Force Microscopy _________________________________ 76
iv
2.5 RESULTS AND DISCUSSION ______________________________________ 81
2.5.1 Etch Pit analysis ________________________________________ 81
2.5.2 Simulations ____________________________________________ 86
2.5.3 Determination of dissolution kinetics _______________________ 87
2.6 CONCLUSIONS ______________________________________________ 89
3 MEASUREMENT OF THE EFFICACY OF CALCIUM SILICATE FOR THE
PROTECTION AND REPAIR OF DENTAL ENAMEL ________________________________ 92
3.1 ABSTRACT _________________________________________________ 92
3.1.1 Objectives: ____________________________________________ 92
3.1.2 Methods: _____________________________________________ 92
3.1.3 Results: _______________________________________________ 93
3.1.4 Conclusions: ___________________________________________ 93
3.1.5 Clinical Significance _____________________________________ 93
3.2 INTRODUCTION. _____________________________________________ 94 3.3 MATERIALS AND METHODS _____________________________________ 98
3.3.1 Calcium release from calcium silicate _______________________ 98
3.3.2 HAP formation from calcium silicate ________________________ 98
3.3.3 Scanning electrochemical cell microscopy (SECCM) ____________ 99
3.3.4 Deposition of calcium silicate onto sound and eroded enamel
surfaces _________________________________________________ 102
3.3.5 Deposition of calcium silicate to eroded enamel pits __________ 103
3.3.6 Protection of enamel by calcium silicate and fluoride _________ 104
3.4 RESULTS _________________________________________________ 106
3.4.1 Calcium release from calcium silicate ______________________ 106
v
3.4.3 Deposition of calcium silicate onto sound and eroded enamel
surfaces _________________________________________________ 111
3.4.4 Deposition of calcium silicate to eroded enamel pits __________ 111
3.4.5 Protection of enamel by calcium silicate and fluoride _________ 114
3.5 DISCUSSION ______________________________________________ 117 3.6 CONCLUSIONS _____________________________________________ 120
4 CONTROLLED CRYSTALLIZATION IN A NANOPIPETTE ________________ 122
4.1 ABSTRACT ________________________________________________ 122 4.2 INTRODUCTION ____________________________________________ 123 4.3 MATERIALSANDMETHODS ________________________________ 128
4.3.1 Solutions. ____________________________________________ 128
4.3.2 Nanopipettes. _________________________________________ 128
4.3.3 Pipette Characterization ________________________________ 129
4.3.4 Instrumentation. ______________________________________ 129
4.3.5 Bias Driven Crystallization Experiments. ____________________ 130
4.3.6 Variation of Ca2+ concentration in the bath solution __________ 132
4.3.7 Effect of inverting the tip and bath species whilst varying of CO3
2-concentration in the bath solution ____________________________ 133
4.3.8 FEM Simulations. ______________________________________ 134
4.3.9 Raman Spectroscopy. ___________________________________ 136
4.4 RESULTSANDDISCUSSION _________________________________ 137
4.4.1 Initial Experiments _____________________________________ 137
4.4.2 Growth of Calcium Carbonate in a Nanopipette ______________ 138
4.4.3 Mixing of CaCO3 in a Nanopipette _________________________ 141
4.4.4 Quantifying Growth Rates in a Nanopipette _________________ 145
vi
4.4.6 Inhibitor Studies Using a Nanopipette ______________________ 151
4.5 CONCLUSIONS ___________________________________________ 154
5 CONCLUSIONS _______________________________________________ 158
vii
II.
List of figures
FIGURE 1SHOWING MODEL STRUCTURE OF TOOTH AND ROD STRUCTURE.WHITE SHOWS ENAMEL, YELLOW
SHOWS DENTINE AND RED SHOWS PULP AND NERVE TISSUE ... 5
FIGURE 2 SHOWING AFM IMAGE OF A. ACID ERODED AND B. HIGHLY POLISHED ENAMEL SURFACE WHICH REVEALS THE INTERLOCKING ROD STRUCTURE.DATA COLLECTED BY THE AUTHOR ... 7
FIGURE 3 SHOWING EFFECT OF ACID ON POLISHED ENAMEL USING INTERFEROMETRY TO SHOW THE BOUNDARY BETWEEN ACID ETCHED PART OF AN ENAMEL SAMPLE AND UNTREATED ENAMEL.CLOSE UP IMAGED PRODUCED FROM AFM ... 9
FIGURE 4 SHOWING THE VARIOUS STAGES OF DISSOLUTION AND THE AREAS OF KINETIC AND MASS TRANSPORT LIMITS ... 14
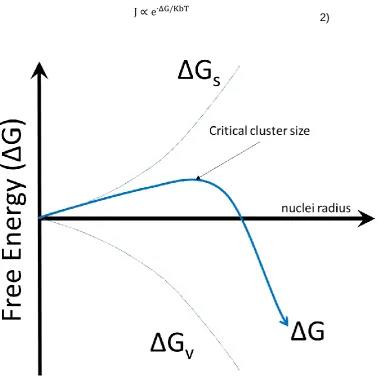
FIGURE 5 FREE ENERGY DIAGRAM FOR NUCLEATION ... 25
FIGURE 6 SHOWING ENERGY CHANGE DIAGRAM OF METASTABLE AND THERMODYNAMIC CRYSTALS ... 29
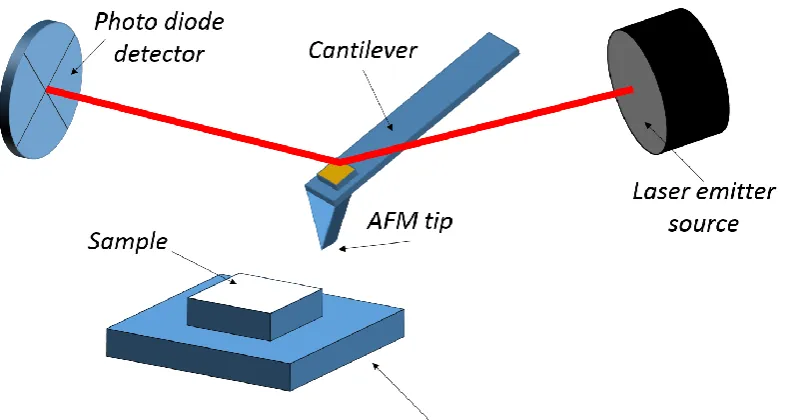
FIGURE 7AFM EXPERIMENT SET UP ... 40
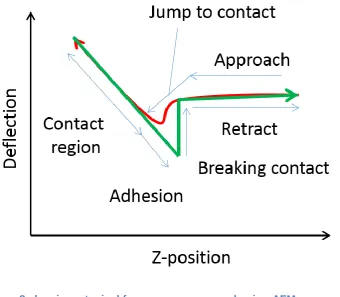
FIGURE 8 SHOWING A TYPICAL FORCE CURVE MEASURED USING AFM ... 42
FIGURE 9 OPERATION OF TAPPING MODE AFM ... 43
FIGURE 10 SHOWING AN AFM TIP INTERATING WITH A SHARP FEATURE WHICH WOULD CREATE A FALSE IMMAGE ... 44
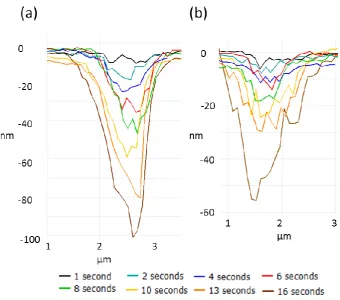
FIGURE 11 SHOWING SERIES OF AFM LINE PROFILES AT VARIOUS TIMES OF AN ARRAY OF ACID ETCHED PITS ON A) POLISHED ENAMEL B)FLUORIDE TREATED POLISHED ENAMEL ... 45
viii
FIGURE 13 SHOWING P-2000 LASER PULLER AND PULLING PROCESS USED ... 48
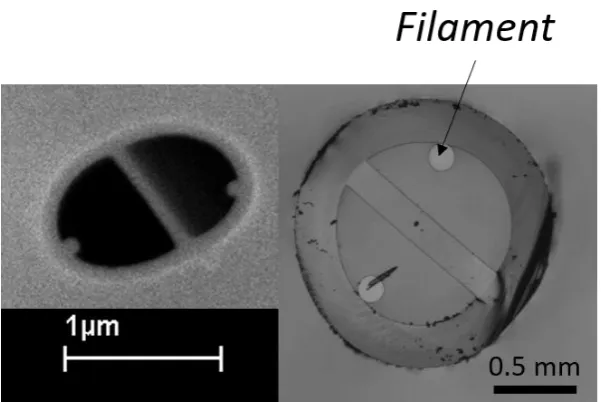
FIGURE 14SEM AND OPTICAL IMAGE OF DUAL FILAMENT CAPILLARY USED ... 49
FIGURE 15 SHOWING GENERIC SECCM SET UP ... 52
FIGURE 16 DIAGRAMMATIC REPRESENTATION OF SECCM APPROACH CURVE.SHOWING BOTH AC(RED) AND
DC(GREEN) OUTPUTS ... 54
FIGURE 17 DIAGRAM OF POLISHING SET UP ... 70
FIGURE 18REPRESENTATION OF THE LOCALIZED TREATMENTS APPLIED TO AN ENAMEL BLOCK: A)ENAMEL
BLOCK POLISHED BEFORE ANY TREATMENT APPLIED; B)HALF THE SAMPLE MASKED OFF WITH POLYESTER TAPE; C)ZN2+ TREATMENT APPLIED TO SAMPLE; D)POLYESTER MASK REMOVED; E)MASK REAPPLIED AT 90° ROTATION; F)F- TREATMENT APPLIED TO SAMPLE; G)MASK REMOVED; H) THE FINAL SURFACE STUDIED BY SECCM ... 71
FIGURE 19(A)SEM IMAGE OF A PIPETTE TIP.(B)REPRESENTATION OF THE EXPERIMENTAL SETUP USED.THE APPROACH-HOLD-WITHDRAW CYCLE AND PROBE PATH USED IN SECCM EXPERIMENTS.(I)PROBE APPROACHES ENAMEL SURFACE.(II)MENISCUS MAKES CONTACT WITH THE SURFACE AND IS HELD FOR A SET TIME.(III)THE PROBE IS WITHDRAWN AND MENISCUS REMOVED FROM THE SURFACE.(C)THE PATH THE PROBE TAKES DURING THE WHOLE ARRAY USED.RED LINE REPRESENTS TIP PATH.MENISCUS CONTACT IN EACH SPOT IS 1 SECOND LONGER THAN THE PREVIOUS SPOT ... 73
FIGURE 20OPTICAL IMAGES OF: A) AN EXPERIMENT IN PROGRESS; B) CLOSE UP IMAGE OF ARRAYS OF
DISSOLUTION PITS FORMED ON A SURFACE ... 75
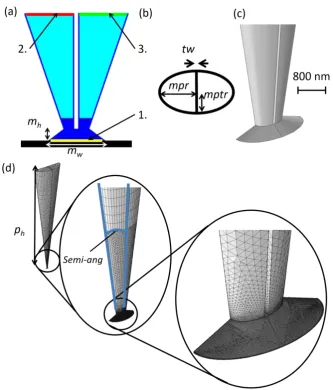
FIGURE 21 THE PIPETTE GEOMETRY USED.(A)2D REPRESENTATION OF THE 3D SIMULATIONS.(B)2D
ix
FIGURE 22TYPICAL ARRAY OF UNTREATED ENAMEL ETCH PITS FORMED USING SECCM, WITH THE TIMES OF MENISCUS CONTACT NOTED.BLACK LINE MARKS POINT OF THE PROFILE AT THE BOTTOM OF THE AFM
IMAGE.THE FIRST POINT ONLY MAKES MOMENTARY CONTACT (MC), USED FOR ORIENTATION OF THE SAMPLE, ACID DISSOLUTION AT EACH POSITION IS FOR AN INCREASED TIME PERIOD ... 83
FIGURE 23PLOTS OF:(A) AVERAGE ETCH PIT VOLUME,(B) AVERAGE PIT DEPTH,(C) AVERAGE PIT DIAMETER, (D) AVERAGE CA2+FLUX AS A FUNCTION OF TIME.ERROR BARS SHOW STANDARD ERROR OF THE MEAN,
N=24.CURVES THROUGH THE POINTS ARE TO GUIDE THE EYE ... 84
FIGURE 24THE CONCENTRATION PROFILES OF SIMULATED SPECIES AND ELECTRIC POTENTIAL AT THE END OF
THE TIP USING AN INTRINSIC RATE CONSTANT, K0, OF 0.08 CM S-1. ... 87
FIGURE 25SIMULATED RESULTS SHOWING CA2+ FLUX (MOL M-2S-1) VS. INTRINSIC RATE CONSTANT OF DISSOLUTION (M S-1) VS. MENISCUS TO TIP RATIO ... 88
FIGURE 26(A)FE-SEM SHOWING 2 BARREL PIPETTE GEOMETRY.(B)EXPERIMENTAL SET UP USED SHOWING AN ACID FILLED PIPETTE IN CONTACT WITH AN ENAMEL SURFACE.(C)REPRESENTATIVE PIT ARRAY CREATED IN SECCM EXPERIMENTS.ARROWS SHOW PROBE PATH.DROPLET IS HELD IN CONTACT WITH EACH SPOT FOR DEFINED TIME PERIODS OF 1 S –16 S (1 S INCREMENTS).FOR THE VERY FIRST SPOT THERE IS ONLY MOMENTARY MENISCUS CONTACT FOR ORIENTATION OF THE ARRAY ...102
FIGURE 27THE PREPARATION STEPS USED TO PREPARE AN ENAMEL SAMPLE FOR THE PROTECTION EXPERIMENTS.(A)A POLISHED ENAMEL SAMPLE WAS USED.(B)HALF THE SAMPLE WAS MASKED OFF. (C)THE SAMPLE WAS TREATED WITH 1000 PPM F- FOR 2 MINUTES.(D)THE MASK WAS REMOVED.(E)
THE WHOLE SAMPLE WAS TREATED WITH CALCIUM SILICATE SLURRY.(F)THE SAMPLE WAS USED IN
SECCM EXPERIMENTS. ...106
x
FIGURE 29RAMAN SPECTRA OF (A) CALCIUM SILICATE UNTREATED (B) CALCIUM SILICATE TREATED IN PHOSPHATE BUFFERS PH4,7 AND 10 AND (C) A COMPARISON OF CALCIUM SILICATE TREATED IN PHOSPHATE BUFFER PH7, ENAMEL AND TCP ...110
FIGURE 30FE-SEM IMAGING OF THE DEPOSIT MORPHOLOGY OF CALCIUM SILICATE ON (A) POLISHED AND (B)
ETCHED ENAMEL.SCALE BARS ARE 20 µM ...111
FIGURE 31AFM OF AN SECCM PRODUCED ARRAY USING 1 µM DIAMETER PIPETTE WITH 1 MMOL HNO3 SOLUTION (A) BEFORE AND (B) AFTER TREATMENT WITH CALCIUM SILICATE.LINES ACROSS THE IMAGES SHOW APPROXIMATE LOCATIONS OF THE PROFILES.PITS PRODUCED FOR CONTACT TIMES OF 1 S -9 S (1
S INTERVALS) PLUS MOMENTARY FIRST CONTACT FOR ALIGNMENT ...112
FIGURE 32PIT VOLUME AT GIVEN CONTACT TIME BEFORE AND AFTER TREATMENT WITH CALCIUM SILICATE. THE ERROR BARS ARE CALCULATED AS STANDARD ERROR OF THE MEAN (N=4) ...113
FIGURE 33FLUX OF ENAMEL AT THE ENAMEL/AQUEOUS INTERFACE AT A GIVEN CONTACT TIME.THE ERROR BARS ARE CALCULATED AS STANDARD ERROR OF THE MEAN (N=16) ...116
FIGURE 34MICROGRAPHS OF TYPICAL NANOPIPETTES USED IN THIS INVESTIGATION OBTAINED USING:(A)
AND (B)TRANSMISSION ELECTRON MICROSCOPY,(C)OPTICAL MICROSCOPY AND (D)FIELD EMISSION
SCANNING ELECTRON MICROSCOPY. ...129
FIGURE 35SCHEMATIC OF THE PRINCIPLES OF PRECIPITATION IN A NANOPIPETTE WITH GROWTH OCCURRING WITH NEGATIVE TIP BIAS,(A), AND DISSOLUTION WHEN THE POLARITY IS REVERSED,(B). C)TYPICAL EXPERIMENTAL BLOCKING AND UNBLOCKING EVENTS WITH BLOCKAGES OCCURRING WITH A TIP BIAS OF
-0.25V AND UNBLOCKING AT 4V. D)TYPICAL BLOCKING TRANSIENT WITH A BLOCKING TIME 0.5 OF 400 MS. E)VARIATION OF THE EXTRACTED BLOCKING TIME, 0.5, OVER AN EXPERIMENTAL RUN OF 25
xi
NEGATIVE AND THE BLOCKING EVENT OCCURS.THE RED SPECTRUM WAS COLLECTED OVER 5 MINUTES FROM WHEN THE BLOCKING OCCURRED AND SUGGESTS AT THE PRESENCE OF AMORPHOUS CALCIUM CARBONATE.THE FINAL SPECTRA (BLUE) SHOWS THE PRESENCE OF CALCITE. ...131
FIGURE 36EFFECT OF INCREASING CA2+ CONCENTRATION ON THE TIME TAKEN FOR CALCIUM CARBONATE TO BLOCK THE NANOPIPETTE. ...133
FIGURE 37EFFECT OF INCREASING CO32- CONCENTRATION ON THE TIME TAKEN FOR CALCIUM CARBONATE TO BLOCK THE NANOPIPETTE ...134
FIGURE 38 SHOWING IN-SITU MICRO-RAMAN EXPERIMENTAL SET UP ...137
FIGURE 39SHOWING THE CURRENT VS. TIME TRANSIENT WHEN STUDYING CALCIUM PHOSPHATE CRYSTALS
...138
FIGURE 40SIMULATED ESTIMATIONS FOR THE SATURATION LEVEL OF CALCIUM CARBONATE IN SOLUTION AT
TIMES RANGING FROM 0 MS TO 1000 MS,(A-D).THE SATURATION LEVEL STARTS TO INCREASE AFTER AROUND 10 MS AND REACHES A VALUE OF AROUND 5 BY 1000 MS.THE MOST SATURATED REGION OF THE NANOPIPETTE CAN BE SEEN TO MOVE UP THE LENGTH OF THE NANOPIPETTE INITIALLY ...143
FIGURE 41 A)THE RATE OF INCREASE IN MAXIMUM SATURATION ACROSS THE WHOLE SIMULATION DOMAIN
CAN BE SEEN TO INCREASE OVER THE WHOLE FIRST SECOND WITH THE RATE OF INCREASE SEEN TO DECREASE WITH TIME. B)THE PREDICTED IONIC CURRENT CAN BE SEEN TO STABILIZE WITHIN 0.25 MS AFTER SWITCHING THE POTENTIAL, INSET SHOWN WITH ZOOM IN. C).THE POSITION OF THE MAXIMUM SATURATION FROM THE NANOPIPETTE CAN BE SEEN TO VARY WITH TIME INITIALLY INCREASING TO 12
M WITHIN 200 MS BEFORE DECREASING TO 6 M.UPON SWITCHING THE TIP BIAS TO BE 2V, AFTER
600 MS OF MIXING AT -0.25V, THE SATURATION CAN BE SEEN TO DECREASE TO UNDER 1 WITHIN 5
xii
FIGURE 42(A)EXPERIMENTAL BLOCKING EVENT SHOWING THE PROPORTION OF CURRENT DECREASING WITH TIME TO 0 IN ABOUT 400 MS.(B)FEM SIMULATION OF A GROWING SPHERE IN A NANOPIPETTE SHOWING THE DROP OFF IN CURRENT AS THE SIZE OF THE SPHERE APPROACHES THE WALLS OF THE NANOPIPETTE.MOST OF THE DROP OFF IS SEEN TO OCCUR WHEN THE SPHERE REACHES A RADIUS OF AROUND 320 NM.THROUGH COMBINING THE SIMULATION IN (B) WITH THE EXPERIMENTAL DATA OF
(A), THE RADIUS OF THE GROWING PARTICLE IN A BLOCKING EVENT, WITH TIME CAN BE ESTIMATED,(C) ...148
FIGURE 43EXPERIMENTAL EFFECT OF VARYING TIP BIAS ON THE BLOCKING TIME SHOWS A DECREASE IN
BLOCKING TIME WITH HIGHER MAGNITUDE BIAS,(A).AS THE BIAS IS DECREASED BELOW -600 MV, THE EFFECT OF FURTHER DECREASES ARE LESS SIGNIFICANT. B)STEADY STATE FEM SIMULATIONS REVEAL A SIMILAR TREND WITH THE MAXIMUM SATURATION LEVEL KS INITIALLY INCREASING RAPIDLY AS THE
MAGNITUDE INCREASES BUT LEVELLING OFF AT HIGHER MAGNITUDE NEGATIVE BIASES.AT POSITIVE TIP BIAS, SATURATION LEVELS LOWER THAN ONE ARE PREDICTED, VALIDATING THE TIP BLOCKING AND UNBLOCKING APPROACH ...150
FIGURE 44MOLECULAR STRUCTURE OF MALEIC ACID ...152
FIGURE 45INCREASING MALEIC ACID CONCENTRATIONS ARE SEEN TO RESULT IN AN INCREASED BLOCKING
xiii
III.
List of Tables
TABLE 1 SHOWING DIFFERENCE IN MEASURED PIT VOLUME USING NORMAL TIPS AND HIGH ASPECT RATIO TIPS
... 46
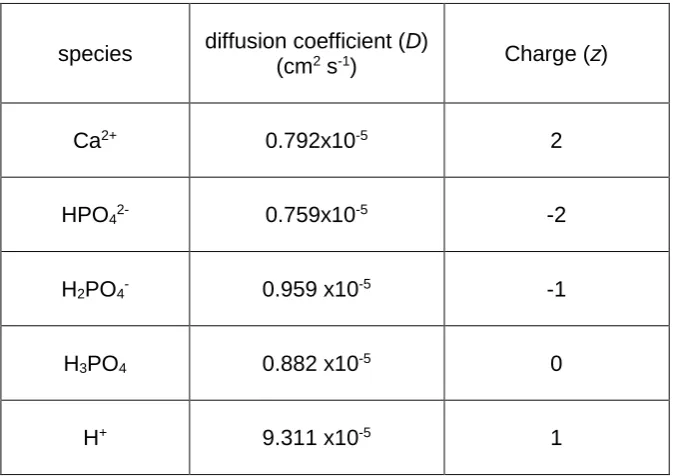
TABLE 2DIFFUSION COEFFICIENTS OF KEY SOLUTION SPECIES.(280) ... 77
TABLE 3CALCULATED INTRINSIC RATE CONSTANTS FOR THE DIFFERENT ENAMEL SUBSTRATES.ERROR IS
STANDARD ERROR OF THE MEAN (N=384). ... 85
TABLE 4COMPARISON OF CA2+ RELEASE CONCENTRATION VIA ICP-OES AND ISE(N =5) ...108
TABLE 5PERCENTAGE CHANGE OF REPAIR AT EACH CONTACT TIME AFTER TREATMENT WITH CALCIUM SILICATE.THE ERROR IS CALCULATED AS STANDARD ERROR OF THE MEAN (N=4). ...114
TABLE 6THE CALCULATED INTRINSIC RATE CONSTANTS OF CALCIUM LOSS FOR EACH TREATMENT.THE ERROR
IS STANDARD ERROR OF THE MEAN (N=10) ...116
TABLE 7EQUILIBRIA PARAMETERS DESCRIBING THE SPECIATION OF CALCIUM CARBONATE IN AQUEOUS
xiv
IV.
Declaration and Inclusion of Published Work
This thesis is submitted to the University of Warwick in support of my
application for the degree of Doctor of Philosophy. It has been composed
by myself and has not been submitted in any previous application for any
degree
Beyond general advice and guidance from my supervisor, the work
presented (including data generated and data analysis) was carried out by
the author except in the cases outlined below:
The FEM model used in chapter 2 and 3 was based on that originally developed by Michael E. Snowden but was modified for the systems used in this work. Advice on FEM modelling was provided by Rehab Al Botros.
Chapter 3 ICP-OES analysis was carried out by Anisha N. Patel Chapter 4 FEM modelling and analysis was carried out by David
Perry and the program to calculate τ0.5 was written by Ashley Page.
Parts of this thesis have been published by the author:
Chapter 2
Alexander S. Parker, Rehab Al Botros, Sophie Kinnear, Michael
Snowden, Kim Mckelvey, Alexander Ashcroft, Mel Carvell, Andrew
Joiner, Massimo Peruffo, Carole Philpotts, Patrick R. Unwin.
“Combinatorial Localized Dissolution Analysis: Application to
Acid-induced Dissolution of Dental Enamel and the Effect of Surface
Treatments” Journal of Colloid and interface Science 2016
doi:
http://dx.doi.org/10.1016/j.jcis.2016.05.018
Chapter 3
Alexander S. Parker, Anisha N. Patel, Rehab Al Botros, Michael E.
Snowden, Kim McKelvey, Patrick R. Unwin, Alexander T. Ashcroft, Mel Carvell, Andrew Joiner, Massimo Peruffo. “Measurement of the efficacy
xv
Dentistry 42(supplement 1) 2014 S21-S29. doi: http://dx.doi.org/10.1016/S0300-5712(14)50004-8
Chapter 4
Alexander S. Parker, David Perry, Ashley Page, Patrick R. Unwin
xvi
V.
Acknowledgements
First and foremost, I would like to thank my supervisor Pat Unwin
who has given me great support throughout my PhD and pushed me when
I needed it. Thank you to the entire chemistry department for making my
time here so pleasurable. Thanks to BrassSoc for giving me my musical
release during my PhD and being such a great group of friends.
To Rachel, Thank you for keeping me on the straight and narrow
with my head down on the ground. Without you, I would never have stayed
the course.
I would also like to thank my grandparents who are my inspiration.
To achieve a fraction of what they have and their love drives me on at my
lowest points. Thank you both to those who have been here to give me the
love and support to get me through, as well as those who I know would
have been so proud so see me reach the end of this great journey and
whose love I carry with me always.
Finally to my parents. Words can’t express how much I want to
thank you for getting me to this point through love and support, the extra
handwriting, spelling and reading support (whilst not entirely successful)
and of course hours and hours spell checking my work have meant my
dyslexia has never been a barrier to me, something I’m incredibly proud of.
But, more than that thanks for being at the end of the phone and being
xvii
VI.
Definition of Acronyms
SECCM - scanning electrochemical cell microscope
AFM - atomic force microscopy
FEM - finite element method
NaF - sodium fluoride
ZnCl2- zinc chloride
SEM - scanning electron microscopy
SECCM - scanning electrochemical cell microscopy
CaCO3 - calcium carbonate
SICM - scanning ion conductance microscope
ACC - amorphous calcium carbonate
TEM - transmission electron microscope
Cryo-TEM - cryo-transmission electron microscopy
SPM - scanning probe microscopy
STM - scanning tunnelling microscope
SECM - scanning electrochemical microscopy
DC - direct current
xviii
FE-SEM - field emission scanning electron microscopy
PDE - partial differential equation
RD - rotating disk
AC - alternating current
QRCE - quasi reference counter electrode
HAP - hydroxy apatite (Ca10(PO4)6(OH)2)
xix
VII.
Glossary of Symbols
𝝀 - wavelength of light
NA - numerical aperture
d - distance limit
F - current force
𝒍 - deflection
𝒌 - spring constant
D - diffusion coefficient
Z - charge
mw - meniscus contact width
mh - meniscus height
𝑬𝒇 -fraction of the potential that falls across the simulation boundaries
ph - pipette height
𝒄 - concentration
𝒖𝒊- ionic mobility
F - Faraday constant
xx
VIII.
Abstract
The aim of this thesis is twofold with both elements related to
industrially relevant crystal systems and processes. The first element
utilized a combined scanning electrochemical cell microscope (SECCM)
and atomic force microscopy (AFM) method to study the dissolution of
enamel surfaces with controlled proton flux to the surface. This was then
extended to investigate the effect of both known surface treatments,
fluoride and zinc ions, but also a novel treatment of calcium silicate and its
methods of action. The second element investigated the use of a
nanopipette to investigate the early nucleation and initial growth of calcium
carbonate crystals.
For the dissolution of enamel, an SECCM probe to selectively etch
a surface for a defined period of time with a high spatial resolution was
used. The extent of the etching in the resultant pits was then monitored
through AFM to measure the volume of material removed along with other
pit dimensions. The method allowed for multiple independent
measurements on a single sample, which could be selectively treated to
eliminate comparability issues associated with measurements on multiple
samples. The system could be modelled via finite element method (FEM) to
calculate an intrinsic rate of reaction for the proton induced dissolution of
enamel. A proton induced rate constant of dissolution of 𝑘0= 0.099 ±0.008
cm s-1 for bare untreated enamel was established, whereas treatment with
1000 ppm sodium fluoride (NaF) and/or zinc chloride (ZnCl2) decreased this
xxi
The work also characterised the use of calcium silicate as a novel
additive in toothpaste and to determine its effect as both a remineralising
agent and as a dissolution inhibitor. The release of Ca2+ ions into solution
was measured which acts to promote the remineralisation of tooth enamel.
The addition of phosphate buffer into this solution combined with
micro-Raman spectroscopy was then used to confirm the formation of
hydroxyapatite (HAP (Ca10(PO4)6(OH)2)) material.
The extent of adhesion of calcium silicate onto rough and polished
samples was also observed, showing the preference of particles to adhere
to rough surfaces, and was quantified by investigating the effect of infilling
of etch pits formed via the SECCM method above, which showed an
average pit volume reduction of 77±12%.
The second element of the thesis involved investigation into the
initial phase of nucleation, nanoprecipitation and growth of calcium
carbonate crystals using voltage driven ion migration within a nanopipette
(~50 nm opening) geometry to control the mixing of constituent ions to
selectively control and induce the nucleation and dissolution of crystals and
monitor their growth. This was achieved using oppositely charged CO3
2-and Ca2+ ions, inside and outside the pipette respectively, which could be
either driven together or apart depending on the applied polarity.
This process was modelled using FEM to give quantitative
information about the growth rate and nanocrystal size during growth as
well as analysis of the saturation levels within the probe geometry. The
xxii
to give information about the polymorph of calcite produced. The effect of
the driving bias was demonstrated and rationalised through simulation
along with the effect of constituent ion concentration.
This method was used to assess the effect of maleic acid as an
inhibitor to the formation of calcium carbonate. Its potent effect was shown
by the significantly larger time taken to block the pipette by crystal growth.
This also provided evidence for the mechanism of crystal growth inhibition
by comparison with ion concentrations expected as a result of a pure
2
1 Introduction
This thesis is presented in the form of published work, so much of
the introduction and methods used are introduced in each chapter. The aim
of this chapter is to give a deeper introduction to the subjects of dental
remineralisation, crystallisation, and experimental techniques which are
investigated within this thesis. The structure of enamel will be discussed,
along with the mechanisms by which dissolution and remineralisation occur
in the dental cavity. Toothpaste additives designed to remineralise the
enamel surface will also be considered. In addition a background to crystal
growth and dissolution will be given, with a focus on nucleation and initial
growth. The industrial application of both these subjects will also be
outlined. The various microscopic methods utilised will be discussed to
provide detail of both the strengths and weaknesses of the different
techniques. Calcium carbonate crystallization within the defined geometry
of a nanopipette will be investigated using an electrochemical driving force
and Raman spectroscopy to probe the growth kinetics.
This chapter will also cover the theoretical background of the
3
1.1 Surface Science
Surface science or interfacial science is a broad term that
encompasses any phenomenon occurring at an interface. This thesis deals
with solid/liquid interfaces although other combinations are possible within
the discipline. The interfacial processes investigated are the dissolution and
nucleation of crystals and crystalline materials.
The origins of modern surface science can be considered to have
begun with Benjamin Franklin in the 17th century with his seminal studies
on the spread of oil on water. However since ancient times, beginning with
the industrial production of salt (1), the study of crystals has remained of
interest consistently. This even leads to the word crystal having an ancient
Greek linguistic origin. Since Franklin’s work many other areas have been
introduced to the sphere of surface science in the intervening time. This
means that interfacial science has hugely impacted on the field of crystal
science areas of pre-nucleation, nucleation and crystal growth. An early
practitioner was Ostwald who contributed to the theory of preferential
growth of large crystals over smaller ones.(2) The developments in the field
of surface science have gone hand in hand with the development of
instrumentation that has allowed visualisation of surface structure.
Control of crystals either growth or dissolution from an electrolyte
solution is one of the fundamental natural processes (3) but also benefits
4
products. In nature, crystals are moulded into service for a variety of
differing functions and shapes such as teeth (5), bones and shells (6, 7)
using a variety of molecules to influence their growth.(8, 9) Understanding
the processes would allow us to subjugate crystals towards our needs by
creating new materials with new properties. However, studying these
systems is intrinsically difficult due to the array of chemical species used in
nature to influence the processes involved.
1.2 Enamel
1.2.1 Structure of the Tooth
Human teeth consist of two major sections; the crown, which is the
part projecting visibly from the gum, and the root, which attaches the tooth
5
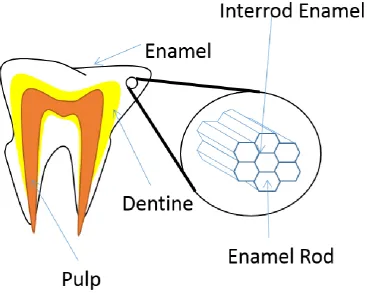
Figure 1 Showing model structure of tooth and rod structure. White shows enamel, yellow shows dentine and red shows pulp and nerve tissue
The crown is covered with enamel, the hardest naturally occurring
mineral in the human body, forming the outer protective layer of teeth.
(10)
Itconsists of calcium hydroxyapatite (HAP, Ca10(PO4)6(OH)2) which makes up
more than 95% by weight
(5)
, with the rest composed of a matrix of organicmolecules, macromolecules and water. Dental enamel is constructed as a
series of units known as enamel rods or prisms, each comprising a tightly
packed mass of hydroxyapatite nanocrystallites in a highly orientated and
organised structure shown in the inset of Figure 1. Once formed, enamel
[image:28.595.114.482.124.419.2]6
remineralisation processes in the oral cavity.
(11)
Conversely, the enamellayer can be affected adversely through dissolution processes associated
with dental caries or erosion from the modern diet.
(12)
The percentage weight amount of HAP varies both between
individuals and even from tooth to tooth from an individual.(13) This is
because teeth develop during the early stages of life and can be affected
by both nature and variations in the local environment.
The enamel covers the dentine to a thickness of ~2.5 mm. This
layer is formed from an array of closely packed enamel rods shaped like a
keyhole which tessellate together.
(14)
Each rod is 6-8 µm across andjoining each rod is a region called the inter rod enamel ~100 nm across. In
this region there are a higher proportion of organic molecules such as
proteins. This microstructure is shown in Figure 2 through 2 atomic force
microscope (AFM) images. The first is of acid eroded enamel to reveal the
microstructure and the second is highly polished to reveal the
7
Figure 2 showing AFM image of a. acid eroded and b. highly polished enamel surface which reveals the interlocking rod structure. Data collected by the author
Even though enamel is the most resistant mineral in the body,
environmental conditions can cause demineralisation. This principally falls
into 2 categories acid induced categories; (i) erosion, which happens in pH
below 3 and (ii) caries, which occurs in pH 4-6.5.(15) In this thesis we only
deal with the acid erosion of enamel. However, with the aid of saliva, it can
be remineralised when conditions permit. This is because saliva contains
both calcium and phosphate which are critical in rebuilding the surface of a
tooth. Whilst being very hard, enamel is brittle so is supported by the
underlying dentine which, whilst still containing ~70% HAP, has a larger
8
1.2.2 Prevalence of acid dissolution in the oral cavity
Dental caries(10) is one of the most widely spread diseases in the
western world. As a problem disease it is relatively modern. Although there
is evidence of caries for thousands of years, the prevalence has risen
dramatically in the modern era. Studies of skulls from the ancient world
show that caries affected ~10% of the population whilst in modern times
this has risen close to 100% in westernised cultures.(16) Occurrences
remain lower in poorer developing nations where a less “advanced” diet
helps to prevent exposure to an environment that encourages caries
formation.
Dental caries is defined as a disease of the mineralised tissues of
teeth.(17, 18) In this thesis we are only concerned with the enamel layer.
The principal cause of this demineralisation effect occurs due to the action
of bacteria which ferment carbohydrates and produce the demineralising
acid.(19) Eventually if the demineralisation process is left to continue and
no counter remineralisation process takes place, the tissues and inner
layers of the teeth can become infected causing pain, aggravation and
eventually tooth loss.
One role of saliva is to repair this damage cause by acid because it
contains the constituents of calcium and phosphate needed to promote
9
1.2.3 Introduction to Acid Erosion and
Remineralisation
The dissolution of HAP is a principal source of tooth decay via acid
attack (20) Figure 3shows the effect acid erosion can have on enamel with
a macro scale treatment: the rough area has been treated with 5 mM citric
acid. Figure 3 shows the transition from polished to eroded enamel imaged
via interferometry with insets produced via AFM. There are 2 principal
methods used to prevent acid attack. First is the use of a protective layer to
prevent dissolution. The second is to encourage remineralisation.(21)
There is significant commercial interest in remineralisation enhancements.
The global market size for toothpaste exceeded US$ 12.6 billion in
2015.(22) Therefore it is commercially important to develop methods of
further encouraging this remineralisation effectively.
10
enamel sample and untreated enamel. Close up imaged produced from AFM
Enamel dissolution occurs for a variety of reasons, but most
importantly because of acid induced dissolution where HAP is dissolved
into the saliva viaEquation1.
Ca10(PO4)6 (OH)2+ 8H+⇄ 10Ca2++ 6HPO42− + 2H2O
( 1)
This process is the primary mechanism of tooth demineralisation so
it is important to minimise its impact by reducing its rate and increasing the
opposite reaction known as remineralisation. It’s worth noting that
remineralisation is the direct reverse reaction not including the inclusion of
any extra ions and is grown as a template on the existing enamel although
it can also form in the saliva however this is then not retained on the tooth.
It has been well documented that the use of fluoride can increase this
remineralisation by catalysing the diffusion of calcium and phosphate into
the tooth surface thus remineralising the crystalline structure in a dental
cavity.
(23)
This is because the fluoride ion can be included in the crystallattice displacing the OH-. The resulting crystal is fluoridated
hydroxyapatite and fluorapatite
(23, 24)
, with the added benefit that the newcrystal resists acid attack better than natural enamel.
It is also known that different solution pH values affect the way acid
attack occurs.(25) At pH 2-4 over short periods of time (hours), significant
11
Under pH 4.5-6.5, subsurface demineralisation called caries is observed
over considerable periods of time (years) and finally in the presence of
strong acid (< pH 2) at time periods less than 2 minutes surface etching is
observable.
1.2.3.1
Remineralisation
Remineralisation is a process that occurs naturally in saliva, which contains
the substituent ions needed for the formation of enamel i.e Ca2+ and PO 4
2-.(26, 27) Remineralization occurs at all times when the salivary conditions
permit i.e. sufficient super saturation of ions and neutral pH. However as
most human saliva is deficient in calcium ions increasing this concentration
is a primary method of enhancing remineralisation.(15, 28)
The calcium and phosphate salts present in the saliva are thought
to be particularly important to prevent dissolution of the HAP crystals. This
ionic presence in the saliva helps to stabilise enamel as their presence in
the oral cavity drives against the dissolution process, by driving the reaction
towards a remineralisation process. Dicalcium phosphate (DCP), tricalcium
phosphate (TCP), octacalcium phosphate (OPC), decacalcium phosphate
and HAP have all been shown to be present in saliva with HAP dominating.
It is believed that these act as intermediary forms within the
remineralisation process. At a neutral pH the equilibrium constants dictate
12
1.2.4 Enamel Dissolution
The majority of research has focused on enamel dissolution through
acid challenge or the effect of varying compositions of bathing solution to
vary the saturation.(29, 30) Very early quantitative studies of enamel
dissolution using undersaturation began to show the importance of diffusion
of species from the surface to the bulk solution. However the importance of
surface kinetics was largely ignored.(20, 31-36)
These early studies showed that the dissolution rate for powdered
enamel was dependant on the rate of stirring which led to the conclusion
that a mechanism of dissolution was limited to the rate of diffusion of ionic
species to the enamel surface.
To understand the kinetics of the surface reactions, studies of
dissolution under highly controlled hydrodynamics were undertaken.(32,
37-39) Nancollas principally carried out research using the rotating disc
method so that the controlled hydrodynamic flow over the enamel surface
was established.(39) This allowed the dissolution rate to be monitored
through observation of the solution pH and thus calculating the uptake of
protons by the enamel surface. This found that varying the undersaturation
of the solution by varying the calcium and phosphate concentration
changed the rate of dissolution, whilst varying the spin speed (and thus the
13
Several mechanisms have been proposed to quantitatively explain
HAP dissolution. However, the model that dominates is the “diffusion” or
“kinetically limited” model.(29, 39) The diffusion model suggests that
dissolution of HAP is due either to the transport rate of the protons from the
bulk solution to the surface or the rate the products, Ca2+ and phosphate
species move away from the surface. This explains that under
diffusion-controlled conditions, the dissolution is essentially limited by the transport
of species to or from the HAP crystal surface, but the kinetically controlled
limit of the dissolution rate is limited by the chemical reactions at the
surface of the HAP. This model is shown in Figure 4 which shows the
14
Figure 4 showing the various stages of dissolution and the areas of kinetic and mass transport limits
These two limits can only be defined as a difference in
supersaturation immediate to the surface. In a kinetically-controlled regime,
the solution is undersaturated with respect to HAP and in a
diffusion-controlled regime the solution is saturated. A plethora of techniques have
been brought to service to understand both this mechanism and rates of
enamel dissolution, because understanding the processes is important to
develop preventative and restorative treatments.
(20, 23, 40-46)
Historically,studies have focused on bulk chemical analysis of solutions during
dissolution such as hydrodynamics, concentration of reagents, solution
undersaturation, temperature and crystal size using methods such as
rotating disk, constant composition and dual constant composition. The
bulk of these required the monitoring of either H+ uptake or Ca2+/phosphate
15
rate constant and rate order, however the experiments largely remained
within the diffusion-controlled limit.(44) To try to overcome this techniques
including AFM(42), profilometry(12), scanning electron microscopy (SEM)
(46) and nanoindentation(40) have all been utilised. These studies have
proven that HAP dissolution is directly linked to the solution pH, with low pH
inversely proportional to the rate of HAP dissolution. It has also been
shown that the presence of calcium and phosphate ions cause slower
dissolution as it makes dissolution less favourable because the
concentration gradient in the solution is lowered and thus favours
remineralisation.(47)
The aim in the first part of this thesis was to investigate the active
component of a new toothpaste, Regenerate, in its effectiveness to
increase the capacity of saliva to remineralise enamel. Research has been
focused on solutions that balance calcium and phosphate to artificially
remineralise the teeth; however most of this work has shown to be not
commercially viable due to variations between individuals. Work in this
thesis has aimed to get round this by boosting the natural ability to
remineralise by increasing the quantity of bioavailable Ca2+ in saliva which
is usually significantly lower in concentration than the phosphate species in
saliva.
It should be observed that, whilst the aim was to provide treatments
for use in humans, the studies were carried out using bovine enamel. The
16
there are structural differences which can lead to bovine enamel dissolving
up to 3 times faster.(48) This is because of increased porosity, differing rod
configuration and a thinner crystalline material at the surface in bovine
enamel.(49) Due to differences in water supply there also tends to be a
lower natural fluoride concentration in bovine enamel. However, given
these differences, the similarities between the two materials makes bovine
enamel a widely accepted alternative for use in laboratory studies.
1.2.5 Enamel Dissolution Inhibitors
Inhibitors can drastically affect the dissolution of enamel.(23, 33, 34)
This may be because an active site is occupied by additive molecules/ions.
Fluoride is the best known inhibitor for enamel dissolution, (24, 28, 31, 33,
34, 50) the ions of which are absorbed onto the HAP surface under neutral
pH which prevents dissolution by creating fluorapatite and calcium
di-fluoride. However, if over used, particularly in developing children, a
condition called fluorosis can develop which discolours the teeth and is
therefore seen as a negative drawback particularly in later life.(51)
There has also been research into other possible inhibitors.(19, 28,
32, 33, 52-54) One example is that of strontium ion inclusions which can
hinder dissolution by the strontium ion replacing Ca2+ within the HAP
lattice.(55, 56) Mn2+ have also been shown to prevent dissolution and
17
exposed to acid attack.(57) Another material studied extensively is Zn2+
which is a common antibacterial agent and can be absorbed into the HAP
lattice.(58) Although Zn2+ shows great promise at hindering dissolution, its
toxic nature and lesser effectiveness has as yet prevented its use in
replacing fluoride widely for human use.
1.2.6 Enamel summary
Acid erosion on enamel is a rapidly expanding field of research due
to our modern diets.(12) The studies reported herein examines the
susceptibility of treated enamel surfaces to acid attack and draws a
comparison to untreated enamel surfaces using scanning electrochemical
cell microscopy (SECCM); the aim of which is to understand dissolution
rate and the effect of surface treatments on this rate. To carry out this
investigation, a range of properties, for example dissolution rate and
18
1.3 Calcium Carbonate Crystals
The second aim of this thesis is to examine the crystallisation of
calcium carbonate. Calcium carbonate includes an array of different phases
principally that of calcite, vaterite and aragonite.(59-61) The method
discussed was briefly trialled using calcium phosphate as the resultant
crystal however the trial was not successful and so calcium carbonate was
used as a simpler system with fewer possible polymorphs.
Nature uses a combination of soft organic matter and hard crystals
in order to produce hybrid materials which perform a variety of roles.(62,
63) These includes biominerals like bones, teeth, and shells and often are
formed in highly controlled shapes to facilitate their mechanical (6) and
optical (7) properties. Replicating this controlled shape is of high interest to
the development of manmade materials. The most common of the
biomaterials is calcium carbonate. Within organisms it is most commonly
produced in series of layers and macromolecular structures from vesicle
deposits and the nucleation is controlled by acidic proteins.(64, 65) There
have been many attempts to recreate these structures or at least control
the crystallisation using structures at interfaces to circumnavigate the need
for protein molecules.(66)
Calcium carbonate forms highly insoluble crystals(67) from almost
all natural water sources.(68) This forms a layer known as limescale (69)
19
salts such as calcium sulphate. Historically these deposits have been
removed through the use of acidic media, which can equally damage the
underlying surface. Therefore the removal of these deposits is of particular
interest industrially(70-72), along with the prevention of initial growth.(73,
74) Calcium carbonate has been extensively studied as a model system
because it has many natural and practical uses but, due to the need for
acid in removal, studies commonly focus on prevention rather than
removal. The two main approaches taken to challenge this are the inhibition
of growth with additives, which prevent nucleation by retarding growth
(75-79) and the prevention(80) or control of nucleation to direct the formation of
specific polymorphs(81) to aid in eventual removal. The most common
method of preventing growth directly is to add chemicals which prevent
growth by binding to calcium ions in solution, often using molecules which
chelate such as maleic acid. (76, 79) The molecules selected for this
purpose invariably contain functional groups which readily bind to the
calcium ions, or attach to sites on the crystals.
The three common polymorphs of calcium carbonate (CaCO3) are
calcite, aragonite, and vaterite. In many natural systems they frequently
exist alongside each other.(60) Each polymorph possesses a unique crystal
structure.(82) Therefore, the polymorphs can be relatively easily
distinguished using vibrational spectroscopy, such as Raman spectroscopy.
Raman has been extensively used to study calcium carbonate and its
20
polymorphs within a sea shells(60, 82-85), and is used here as a validation
of crystals formed.
Solid structure nanopores have become increasingly used as model
channels(86) they have also found uses as: sensors;(87-89) the synthesis
of nanoparticles with narrow size selection;(90) and as a molecular
sieve.(91) When embedded within a defined conical geometry, the
nanopore can be considered distinct and inclusive of a nanochannel. These
show behaviour as nanofluidic diodes due to the voltage gated ion current
they possess.(92, 93) There are an array of reports from groups detailing
the development of electrical sensors which utilize variations in ion current
measurements across membranes containing asymmetric
nanopores(94-100), often created using the track-etching method.(101) This method
however is particularly involved with a low rate of success. The alternative
method utilising capillaries pulled with a laser puller to form glass or quartz
nanopipettes can produce far more consistent and quick
structures.(102) These nanopipettes, shaped with a conical nanopore at the
tip, exhibit many of the properties associated with other asymmetric
nanochannels. However, in addition, they can be manoeuvred with high
spatial resolution. When the capillary is filled with an electrolyte solution it
can and is often used to mimic biological systems (93, 103) as they are
similar in design to nanopores produced by proteins which behave as ion
21
There are significant applications where nanopipettes are used as
imaging probes for the scanning ion conductance microscope (SICM), a
technique that has been used to image cells (106-108), the analysis of
surface processes (109), sense surface charge(110) and functionalized for
use in sensing applications.(111-115) Here, we are interested in the
method where nanopipettes were used to produce strong ion current
densities, where mass transport is well defined (102, 116), and therefore
create locally artificially highly supersaturated solutions, which induce
precipitation. This nanoprecipitation (104, 105, 117) forms a particle at the
end of the nanopipette, thus restricting the ability of ions to flow due to the
blockage, essentially altering the nanopipette’s dimensions. The reverse is
also true as the nanopipette can produce low supersaturations where
dissolution of nanoparticles dominates. Therefore, this method exhibits a
high degree of control over the nucleation, and the very initial stages of
crystal growth. This method is made more effective due to recent advances
in nanopipette fabrication, allowing for very small pipette dimensions to be
achieved.
Conical nanopores have shown new chemical and electrical
phenomena; ion current rectification, which is the asymmetric enhancement
of ion current due to an applied voltage across the nanopore.(102,
103) This phenomena can be utilised to concentrate weakly soluble
salts(104, 105), control the interface of two solvents using organic
molecules with differential solubility(118), and as a method to control
22
monitor the precipitation in real time and at the nanoscale and to repeat the
measurement in order to generate results with high statistical accuracy.
Here, it is shown that a potential bias through a nanopipette can
control ion migration to cause selective precipitation and dissolution of a
common industrially problematic insoluble salt. Through a series of varying
conditions we present a method for investigating the conditions where
nucleation is preferential. We also utilise finite element method (FEM)
modelling to provide kinetic information about the driving factors behind the
process. Finally we confirm the precipitate and polymorph formed within the
nanopipette through the use of micro-Raman spectroscopy.
1.3.1 Applications of Crystal Nucleation, Growth and
Dissolution
The formation and dissolution of crystals is a subject that has been
of interest for centuries, particularly in respect to industrial applications in
order to control the crystallisation process, the size and the polymorph
formed.(119) This is because a greater understanding of nucleation, size
and morphology are important in controlling other aspects such as
solubility.
The formation of crystals can be described in two distinct steps.
Firstly nucleation, the formation of a new stable phase within the solution.
23
the solution. This thesis will focus on the first stage, nucleation, which will
be explored in later chapters.
Nucleation itself can occur via two differing methods -
homogeneous and heterogeneous growth. Homogeneous nucleation is the
formation of nuclei within a solution from the aggregation of ions present in
the solution. Heterogeneous nucleation occurs on a surface or impurity
present in the solution preferentially. After nucleation the growth can occur
via a variety of differing mechanisms which are not the subject of this work.
An area of particular interest is the biological formation of solid
particles to form biominerals which can exhibit unique and desirable
characteristics. Sometimes this may be an amorphous state (9, 120) but,
more often, crystallinity is necessary in order for the material to carry out its
desired function.(6, 7, 121, 122) One example of this are the shells of
marine creatures many of which are made of calcium carbonate in the form
of calcite (8, 81, 123, 124) which is the most stable morphology.(59, 125)
These shells can produce structures that are highly shaped but relatively
little is known about how these are formed. The ability to control the
nucleation of these crystals would bring us one step closer to
understanding these processes.(126-129)
Alongside HAP (130-132), calcium carbonate is one of the most
studied crystal systems due both to its natural abundance in many rock
formations but also for its industrial applications as it is the primary
24
significance in applications ranging from household appliance maintenance
to toilet cleanliness and the prevention of scale in oil wells. This includes
the study of processes that alter surface processes such as additives.
The aim of the crystal growth study in this thesis was to develop a
method to control the nucleation and growth of calcium carbonate and the
conditions under which this can be managed including a method that
controls the diffusion and mass transport of ions in the system, which can
be mathematically modelled to understand the kinetics involved.
1.3.2 Crystal Nucleation Theory
Nucleation is the process where there is a distinct change from one
phase to another where a small number of ions, atoms or molecules begin
to join into a distinct material.(133) In this thesis all crystal nucleation
processes involve changing from solution phase to a solid phase.(134) In
such situations the process is driven by the concentration supersaturation
(135, 136) and temperature.(137) The early nucleation process has a
fundamental impact on the resulting crystal formed; therefore
understanding of the nucleation fundamentals are of imperative importance.
The predominant issue in studying this process is one of size as an initial
nucleus is 100-1000 atoms in size (136) making direct observation of this
stage impossible.
Two models dominate the theory of crystal nucleation. The first,
25
form of Arrhenius equation shown in equation 2.(138, 139) The result of
which is shown in Figure 5where ∆G is the Gibbs free energy for the
system, kbis the Boltzmann constant and T is temperature and r is the
radius of the particle. From the Figure 5 it can be seen that free energy
change increases until the critical cluster size is reached after which the
free energy drops allowing the nucleus to continue to grow.
[image:48.595.130.509.291.669.2]J ∝ e∙ΔG/KbT 2) (
26
In Figure 5, ∆G is equal to the sum of the surface free energy ∆Gs
and the volume free energy ∆Gv the particle is modelled as a sphere, which
is the most energetically favourable shape. It can be seen that initially after
during nucleation the surface energy term dominates increasing the overall
system free energy, after a certain size (the critical cluster size) the volume
term begins to dominate and the activation barrier is passed and the
particle can continue to grow unhindered as the free energy drops.(133)
The limitations of this classical model mean that it assumes the
particles are spherical and free from crystal defects and one monomer is
added sequentially. For this reason the two step model was developed to
address these issues.(140) It can be seen that the two-step model allows
for a small amorphous cluster to form as an intermediary to the final crystal
structure.(141) The major difference is that the intermediate does not have
the same crystal structure as the final crystal.(136) This model is
particularly favoured when describing the existence of different polymorphs.
The amorphous clusters (known as metastable form) provide a lower
energy barrier of formation, because of the lack of crystal structure,
whereby it is possible for differing polymorphs to form from the metastable
cluster.(142)
Nucleation can be seen to have two differing modes; homogeneous
when nucleation occurs in solution, and heterogeneous when it occurs on a
surface.(133) It can usually be assumed that crystal growth on a surface is
27
preferred.(143) This can be observed, as crystals tend to form, and thus
nucleate, on imperfections at much lower supersaturation than via
homogeneous nucleation, although some surfaces may lower the barrier to
nucleation further through variations in surface charge for example.
1.3.3 Polymorphism
Many crystals show polymorphism where a chemical or compound
has more than one possible crystalline structure (124, 144-147), which
have different stability, solubility and dissolution rates. The growth or a
particular polymorph can be affected using a particular solvent,
temperature, supersaturation and use of additive molecules.(148)
Industrially, understanding how different structures form is essential so that
challenges such as cleaning, i.e. the removal of limescale via enhanced
dissolution or preventative measures for adhesion can be addressed. In
this thesis we look at the way nucleation can be controlled within a confined
geometry, within an electric field and the influence of additives which inhibit
nucleation. As described in nucleation theory, metastable clusters can help
lead towards different polymorphs. The Ostwald rule shows the series of
phases that can form before finding a thermodynamically stable state as
shown in Figure 6. This states that in most situations the least stable
polymorph will form first before eventually forming the most stable
29
`
Figure 6 showing energy change diagram of metastable and thermodynamic crystals
One example that is investigated in this thesis is calcium carbonate
and its polymorphs.(142) Each polymorph has differing thermodynamic
[image:52.595.124.509.132.535.2]30
being metastable.(149) For this reason, in high-supersaturated solutions it
is possible to form the more unstable polymorphs (139), as the kinetics
dominate, but as the supersaturation drops, a phase change to the most
stable polymorph usually occurs as the thermodynamic driver takes
over.(144)
1.3.4 Applications to CaCO
3Crystallization research has predominantly focused on a model of
classical nucleation theory (151) with subsequent growth via
terrace-ledge-kink model growth (152), which relies on the basis of species adding
monomer-by-monomer onto step edges and kink sites. Whilst classical
nucleation has had a clear success (153, 154), there are circumstances
where crystal formation is not able to be explained sufficiently i.e.
amorphous phases that nucleate at concentrations far below those allowed
by classical models.(155)
These non-classical (156) crystal growth processes have begun to
develop into distinct models. One clear example found naturally is the
agglomeration of amorphous calcium carbonate (ACC) which eventually
form calcite crystals in organisms such as sea urchins (157, 158) for both
spines (159) and teeth (160), mammalian tooth enamel (161), vertebrate
bones (162), crustacean exoskeletons (163), and mollusc larval
31
Other non-classical mechanisms suggested include oriented
attachment (165), where repeated attachments of crystalline particles occur
on lattice matched specific crystal faces (166-168) or, via mesocrystals,
which are kinetically stabilized nano-crystals in crystallographic
alignment.(169, 170) These mesocrystals are intermediates forms between
pre-nucleation clusters and true single crystals which either fuse and
transform into single crystals (170) or remain in solution stabilized by other
molecules at the particle interfaces.(156, 171-173)
In situ observations of crystal growth in these models are rare,
usually limited to liquid-phase scanning probe (174) and transmission
electron microscope (TEM) (167, 175, 176) studies. Perhaps more
relevantly methods that combine imaging and spectroscopy with data
collected at different time points throughout crystallization can detail the
kinetics of growth at the early stages of crystallization.(155, 158, 171, 177,
178)
Recently and in opposition to classical nucleation theory, calcium
carbonate crystal formation has been found to form as an amorphous
cluster phase before forming the more stable polymorph forms both
biologically (159, 179) and synthetically.(180, 181) It has also been shown
that these mesostable clusters are preceded by the formation of
pre-nucleation nano-clusters.(140, 182) The observation of calcium carbonate
meso crystals is an area of particular interest as it may have lasting
32
shown in several ways such as freeze drying particles(184) and has shown
evidence of spherical crystal formation.(61, 75)
The role of the pre-nucleation clusters has been examined using a
method of Plunge-freeze vitrification to freeze clusters during a process of
nucleation, before being studied via cryo-transmission electron microscopy
(cryo-TEM).(180) This allowed sampling at various time points to see the
different stages of the mineralization, and showed the formation of
pre-nucleation clusters and amorphous phases before transformation into
Vaterite and ultimately calcite.(185-187) This work showed that
pre-nucleation occurred in solution before ultimately forming crystalline
structures on the surfaces studied. It has been speculated (140, 151) that
this is because of an entropy gain from the release of water from the ion’s
hydration shell, which provides the driving force towards pre-nucleation
cluster formation, although it has also been suggested (187) this may occur
simply due Brownian motion of the pre-nucleation particles and subsequent
gain in surface enthalpy. Finally it has also been suggested (188, 189) that
CaCO3 clusters of ≤2 nm may have short range order thus making
formation more closely linked to classical nucleation theory.
1.3.5 Confinement of crystal growth
Recently there has been significant research and interest in the
growth of a variety of crystals within a confined geometry(81, 190-194)
33
as a flow cell(195), has the tendency to stabilise conventionally less stable
polymorphs and mesostable phases without the use of additive molecules.
This ultimately leads to the conclusion that crystal growth can be
controlled using both additive molecules and modification of the growth
geometry therefore the ability to study these in isolation, as presented here,
is of particular importance.
1.3.6 Calcium Carbonate growth inhibition
Inhibitors can drastically affect the formation of calcium carbonate.
An inhibitor is a chemical that reduces the formation of calcium carbonate
crystals and are widely used as a control method in many fields. This may
be because an active site is occupied by additive molecules/ions. This use
of chemical inhibitors has been used in boilers since 1821 when it was
found that potato starch reduces the rate of scale accumulation.(196)
Chemical inhibitors may function via several mechanisms chelation,
dispersion and inhibition.(197) One mechanism of inhibition occurs as ions
in solution, at very low concentrations, adsorb onto the crystal surface,
blocking growth positions on the surface inhibiting further precipitation.(198,
199) Other methods like carboxylic acids weaken the crystal structure(200)
and chelates such as maleic acid bind around calcium in solution