1
Ethics in Datafication: expanding on a new datafication
framework
Anne-Marijn Valk
University of Twente PO Box 217, 7500 AE Enschede
the Netherlands
[email protected]
ABSTRACT
In recent years, more and more fields of business have shifted from a traditional working approach to working with customer experience as their starting point for their business. To be able to do this, a business needs to collect data. PDEng researcher Berend Alberts-de Gier is in the process of creating a datafication framework for the company Asito to help them with the data practices needed to switch to a customer experience based approach. This research explores how this new framework relates to existing design methodologies from both a theoretical and practical viewpoint.
Keywords
datafication, design methodologies, customer experience.
1.
INTRODUCTION
The company Asito is one of the largest cleaning companies in the Netherlands. In recent years, more and more of their clients have asked to look at customer experience as a starting point to organize and deliver their cleaning services, to improve user satisfaction.
PDEng researcher Berend Alberts-de Gier is in the process of creating a datafication framework for Asito to help them in thinking about and designing data practices to answer these questions of their customers, while also keeping in mind ethical issues that may arise. [1]
Figure 1: an overview of the framework [2]
As seen in figure 1, this framework consists of two steps: Design of data, and Use of data.
Permission to make digital or hard copies of all or part of this work for personal or classroom use is granted without fee provided that copies are not made or distributed for profit or commercial advantage and that copies bear this notice and the full citation on the first page. To copy otherwise, or republish, to post on servers or to redistribute to lists, requires prior specific permission and/or a fee.
31stTwente Student Conference on IT, July 5th, 2019, Enschede, The Netherlands. Copyright 2019, University of Twente, Faculty of Electrical Engineering, Mathematics and Computer Science.
The design step focuses on the design of the domain. Alberts-de Gier puts it as follows: “The relevance of this step is to explicate that data do not simply exist on their own, but have to be actively created. The step entails both interpreting the world in a specific way to count and measure thing — to turn into data — as well as the actual technological generation of data through algorithms and sensors.” [1] When the data practices have been designed, they are implemented and appropriated, which leads to the Use of data step.
This step focuses on how the data is used and analysed. Alberts-de Gier says the following about it: “This consists of activities such as Goal definition, Data collection, and study design, Data preparation, Exploratory data analysis, Choice of variables, Choice of potential methods, Evaluation, Validation, and Model Selection, Model use and reporting [8]. But use in the case of data is also the application of insights [...] to change business processes, for example, to make these business processes more efficient.”[1]
Many other design theories exist, which gives rise to the question if the Datafication Framework of Alberts-de Gier is really relevant and if it has something to contribute to the field that other methodologies do not offer.
2.
RELEVANT LITERATURE
In order to compare the Datafication Framework with existing approaches, four other methodologies were selected.
2.1
Design Science
[image:1.595.57.285.504.572.2]Design Science is a generic design theory. The engineering cycle of Design Science consists of five steps which are to be performed iteratively. The steps are Problem investigation, Treatment design, Treatment validation, Treatment implementation, and Implementation evaluation.[10] Figure 2 shows the engineering cycle.
2
2.2
RRI
[image:2.595.315.494.82.263.2]RRI is an approach that aims to engage policymakers, researchers, teachers, civil society organizations, business and industry in all stages of research and innovation processes through inclusive and participatory methods. There are six policies RRI focuses on: ethics, gender equality, governance, open access, public engagement, and science education. [7] There are many different RRI tools available, for this research the AREA 4P Framework was selected, which focuses on research and innovation in the context of IT projects. [3]
Figure 3: An overview of the AREA 4P Framework [3]
2.3
VSD
[image:2.595.58.294.186.365.2]As described by Friedman, Kahn, and Borning: “Value Sensitive Design is a theoretically grounded approach to the design of technology that accounts for human values in a principled and comprehensive manner throughout the design process.” [5] It consists of conceptual, empirical and technical investigations which are performed iteratively.
Figure 4: An overview of the Value Sensitive Design methodology
2.4
CRISP-DM
[image:2.595.59.279.480.632.2]CRISP-DM is a widely used standard for data mining. It consists of six phases: Business Understanding, Data Understanding, Data Preparation, Modeling, Evaluation, and Deployment. [4] These are also shown in figure 5.
Figure 5: The Crisp-DM reference model 1
3.
PROBLEM STATEMENT
The aforementioned methodologies will be compared using two different approaches: top-down and bottom-up.
The top-down approach starts from the theory. In this part of the research, the different design methodologies will be compared as a design theory.
The bottom-up approach is more practical. By applying the different methodologies to a business case provided by Asito, similarities and differences can be identified.
These two different approaches lead to the following research questions:
RQ1 How does the framework of Alberts-de Gier relate to existing design methodologies using a theoretical approach?
RQ2 How does the framework of Alberts-de Gier relate to existing design methodologies using a practical approach?
4.
METHODOLOGY
4.1
Theoretical approach
In order to be able to answer RQ 1, the different methodologies are compared to each other using research of Gregor and Jones. Gregor and Jones defined eight components of an Information Systems Design Theory, these are shown in table 6. [6] These serve as criteria for a design theory, such as the methodologies that were selected for this research. The components are split into two categories: core components and additional components. For this research, the focus will be on the core, so only components 1-6 will be taken into account.
By comparing the five methodologies to the six core components of Gregor and Jones, RQ 1 can be answered.
1 Retrieved from
3
Table 6: eight components of an information systems design theory [6]
Component Description
Core components
1) Purpose and scope “What the system is for,” the set of meta-requirements or goals that specifies the type of artifact to which the theory applies and in conjunction also defines the scope, or boundaries, of the theory.
2) Constructs Representations of the entities of interest in the theory.
3) Principles of form and function
The abstract “blueprint” or architecture that describes an IS artifact, either product or method/intervention.
4) Artifact mutability The changes in state of the artifact anticipated in the theory, that is, what degree of artifact change is
encompassed by the theory.
5) Testable propositions Truth statements about the design theory.
6) Justificatory knowledge
The underlying knowledge or theory from the natural or social or design sciences that gives a basis and explanation for the design (kernel theories).
Additional components
7) Principles of implementation
A description of processes for implementing the theory (either product or method) in specific contexts.
8) Expository instantiation
A physical implementation of the artifact that can assist in representing the theory both as an expository device and for purposes of testing.
4.2
Practical approach
In order to give substance to the practical approach, the selected methodologies need to be applied to a case. The company Asito has provided a case which will be discussed in more detail in part 5.2.2. Initial information about this case was collected from a blog post of Alberts-de Gier. [1] To gather additional information about this case, a domain expert on this case was interviewed on June 6th, 2019 using a semi-structured interview approach. By using this knowledge and applying it to the different methodologies, RQ 2 can be answered.
5.
RESULTS
5.1
Theoretical approach
5.1.1
Purpose and scope
This component defines what the theory is for and what its scope and boundaries are. [6] The first thing that stands out is that CRISP-DM does not ask the user to do a full stakeholder analysis. In fact, it only focuses on key persons inside the business and the end users. Any stakeholders that do not fall into this category will be neglected.
Another thing that stands out is that both RRI and VSD do not include the actual design, creation, and implementation of a solution in the methodology. This means that they will need to be used in combination with a general design methodology such as Design Science.
Moreover, RRI very explicitly asks the user to consider social desirability and sustainability, this is not very visible in other methodologies.
Next, VSD solely focuses on stakeholders. This means that any issues that do not involve the stakeholders could go unnoticed. Furthermore, CRISP-DM does not include the designing of the method by which the needed data is collected. It presumes that the needed data has already been generated.
Last, the Datafication Framework is the only methodology that explicitly asks for a domain model. With Design Science and CRISP-DM the user might also indirectly come to a domain model, but they are not explicitly encouraged to question their beliefs.
5.1.2
Constructs
This component is about the “representations of the entities of interest in the theory”. [6]
Design Science, VSD, CRISP-DM, and the datafication framework are all represented by steps that can be performed in cycles. Although some methodologies have more steps than others. RRI is represented by a table with one or more questions in each cell.
5.1.3
Principles of form & function
This component “refers to the principles that define the structure, organization, and functioning of the design product or design method”. [6] The selected RRI framework only consists of one sheet with questions, the other methodologies consist of several stages to work through.
Design Science, RRI, VSD and CRISP-DM all have specific questions to answer and steps that have to be taken in each category. The datafication framework of Alberts-de Gier currently only has a few general guidelines. This can make the framework hard to use at times, and leaves room for the users interpretation. A person who is not experienced with ethical thinking might not get the desired results from using it.
5.1.4
Artifact mutability
4
Table 7: An overview of the results of 5.1
Gregor & Jones Design Science RRI VSD CRISP-DM Datafication framework
1) Purpose and scope
- Stakeholders - Problem investigation - Design solutions - Validate solutions - Implementation - Evaluation
- Stakeholders - Planned methodology - Planned reflection method
- Consequences of project
- Social desirability - Sustainability - Training
- Stakeholder values - Stakeholder interaction with the product
- Influence of the product on human values of the stakeholders
- Users & key persons in the business - Users’ needs and
expectations - Objectives & requirements - Risks & constraints - Data analysis - Evaluation
- Domain model - Stakeholders - Design artefacts & processes
- Build artefacts & processes
- Implementation & appropriation of the system - Data analysis - Data-driven interventions - Evaluation
2) Constructs A cycle that consists of 5 steps
A table with questions to be answered
A cycle that consists of 3 investigations
A cycle that consists of 6 phases
2 steps
3) Principles of form & function
5 steps:
- Problem investigation - Treatment design - Treatment validation - Treatment implementation - Implementation evaluation
1 table 3 investigations:
- Conceptual - Empirical - Technological
6 phases:
- Business understanding - Data understanding - Data preparation - Modeling - Evaluation - Deployment
2 steps:
- Design of data - Use of data
4) Artifact mutability
Iterative Not iterative Iterative Iterative Iterative
5) Testable propositions
Implementation evaluation
Asks about what reflection method will be used
Technological investigations: how does product influence stakeholders
Final report contains an evaluation
Evaluation after use step
6) Justificatory knowledge
AREA framework is used as a base
5.1.5
Testable propositions
This component focuses on evaluating “testable propositions or hypotheses about the system or tool to be constructed” [6] The first thing that stands out is that RRI does not have an evaluation component. It does include a question about what method will be used to reflect on the design process, this will need to be included in the general design theory that is used alongside this framework. The datafication framework of Alberts-de Gier does have an evaluation step at the use phase, but it is not clearly defined what that entails at this point in time.
5.1.6
Justificatory knowledge
This component is about the “underlying knowledge or theory from the natural or social or design sciences that give a basis and explanation for the design” [6] In other words, what the
theory is based on. The RRI framework that was selected builds on the existing AREA framework, it was adapted to fit the context of IT projects.
5.1.7
Conclusions
5
5.2
Practical approach
5.2.1
Case description
In recent years, more and more businesses have shifted from a traditional working approach to taking customer experience as a starting point for their business. Clients of Asito - one of the largest cleaning companies in the Netherlands - have asked them to improve customer experience in regards to cleaning.
One of these customers is Schiphol airport. Schiphol has started the “Digital Airport Program”, with which they want to grow to be the biggest airport in Europe by focusing on data and digitalization. At the airport, Asito is responsible for cleaning the restrooms on several piers. To collect data on customer satisfaction, Schiphol has installed FeedbackNow boxes in the restrooms with the question “How do you rate the cleanliness of the toilets today?”. The boxes have a green/positive, yellow/neutral and red/negative button. An example of such a box is shown in figure 8. Customers can rate their experience of the cleanliness by clicking one of the buttons. Asito is also judged on the percentage of green votes that their toilets receive.
A few times a year, there are also small user interviews conducted at the airport, where visitors of the restrooms are asked for feedback on their experience. This provides Asito with more substantial feedback on several aspects of the experiences of the customers. According to the domain expert that was interviewed, these interviews sometimes completely contradict the data gathered from the FeedbackNow boxes.
[image:5.595.70.273.512.574.2]Currently, the cleaning employees of Asito do not have a schedule when to clean which toilet group. They can decide themselves when to clean which toilet group during their shift. They individually decide this based on their own experience. In case of a cleaning emergency, they will be contacted by phone by the cleaning supervisor. Asito would like to base the cleaning schedules on the experience of the restroom visitors, potentially by using iPads on the cleaning carts of the staff.
Figure 8: a FeedbackNow box2
5.2.2
Results
To answer RQ 2, the Asito case was applied to all 5 methodologies. Table 10 shows an overview of the most relevant results. The full results can be found in Appendix A. Due to the limitations of this research, the case could only be applied up until the point actual solutions had to be designed and tested.
2 Retrieved from https://go.forrester.com/real-time-experience/]
Design Science
This methodology covers all the general design aspects, but it is clearly lacking when it comes to ethical considerations, especially when compared with RRI. Design Science is the only methodology to question what happens when the project would not be undertaken. One could argue that RRI also covers this, but it does not ask this explicitly.
RRI
RRI covers the most ethical aspects out of all the selected methodologies. One of the main focuses of the framework is the inclusion of stakeholders during the project, it wants to make sure all viewpoints are considered. Aspects that are covered by RRI and barely or not covered by the other methodologies are informed consent, social desirability, sustainability, and training of personnel.
VSD
Since VSD only focuses on the stakeholders, the topics that it covers are limited. Nevertheless, it covers certain aspects that are not covered by the other methodologies. It explicitly asks for human values that are impacted by the design, which uncovered a few values that were not clearly indicated with the other methodologies, such as autonomy. It also covers trade-offs between the values, and asks the user to consider which is more important to the system. This uncovered the trade-off between autonomy of the cleaning staff vs customer satisfaction.
CRISP-DM
The stakeholder analysis yielded similar results for most of the methodologies, except for CRISP-DM. CRISP-DM only asks to define the users of the end product and affected units inside the business. Using this methodology, the users of the restrooms would not considered in the design, even though data is collected about them.
One thing it does well is that is asks for existing knowledge sources about the subject, so the user can for example learn from experts on the subject.
Datafication Framework
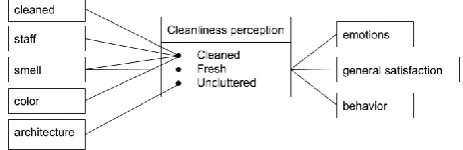
Because the Datafication Framework misses specific questions, it was slightly challenging to apply it on the case and determine what ethical aspects of this case would arise. One aspect that is very clear is that the Datafication Framework is the only methodology that explicitly asks for and questions the domain model, which is shown in figure 9. The three dimensions of cleanliness perception also have twelve corresponding items in order to make them measurable, these are shown in table 11. This allows for interesting discussions about what needs to be measured versus what can actually be measured.
[image:5.595.307.539.658.733.2]6
Table 10: an overview of the results of 5.2
Design Science RRI VSD CRISP-DM Datafication
Framework
Problem investigation
The stakeholders are the restroom visitors, cleaners, IT department, management of both Asito and Schiphol, and the investors of both companies.
The impact on the cleaners will likely be the biggest, their way of working will change. Restroom visitors will be affected by the way cleanliness perception is measured.
The goals of the cleaners are to have an easy to use system that yields significantly better results than their current way of working. Restroom visitors want a comfortable experience
If nothing would be done about the situation, Asito will likely fall behind with technological
advancements compared to its competitors.
Treatment design
Important requirements involve the privacy and anonymity of restroom visitors, usability of the solution for the cleaners, maintainability, accuracy, and expandability.
Some data is already available, such as the results of the interviews that are conducted several times a year. Schiphol has also installed people counters in several of the restrooms, unfortunately these are not available for every restroom. Schiphol also has several APIs available, such as wait times and flight. And of course the FeedbackNow data.
Anticipate
The main risks of the project lie with acceptance by the cleaners and restroom users and security of the designed system.
Another important aspect is informed consent: if sensors will be installed that track restroom users, they need to be informed about this.
The relevant stakeholders are the restroom visitors, cleaners, IT department, management of both Asito and Schiphol, and the investors of both companies.
One reason why the project should be undertaken because it will ultimately lead to a better experience for the restroom visitors.
React
The biggest consequence that the project will have is that it will change the way the cleaners operate.
If the project is successful, it might be implemented in more public restrooms.
The people who will be most affected by this project are the cleaners, their way of working will change.
In this part of the framework, it also asks the user to consider how it could be done differently.
Engage
Engaging a wide range of restroom users and cleaners is important, ask for feedback frequently in the design process.
The project is prioritized by Asito management, since Asito is judged on customer satisfaction.
Act
Frequent feedback will allow the project to be more flexible and will help ensure social desirability.
Cleaners will need to be trained in using the designed system. If the knowledge is not available, IT personnel needs to be trained in how to anonymize and safely store data that the system might gather.
Conceptual investigations
Direct stakeholders are the cleaners and the IT department that will be responsible for the system.
Indirect stakeholders are the restroom visitors, management of Asito & Schiphol, and investors of both companies.
For the cleaners, their autonomy will be impacted. They will work based on the
recommendation of the designed solution, not based on own experience.
The privacy of the restroom users could be impacted, however, this could lead to an increase in their satisfaction.
Other values that could be implicated are anonymity, discrimination, user-friendliness and maintainability.
Trade-offs include: Privacy vs collecting useful data, anonymity vs accuracy, autonomy vs increase in customer satisfaction.
Empirical investigations
With empirical investigations, user interaction with the system could be observed and feedback about the system could be gathered.
Technological investigations
With the technological investigations, one would investigate how the designed solution affects the stakeholders and their values.
For example: does the solution protect the anonymity and privacy of restroom users? Or: how much autonomy does the cleaning staff have?
Business understanding
The business units affected by the project are the cleaning staff and the IT department that is responsible for the designed system.
The problem area is cleanliness perception in the airport restrooms.
The objective of the project is to base the cleaning schedule on the experience of the restroom users.
Available data sources include people counters that have been installed on some of the restrooms, FeedbackNow data, interview data, and APIs of Schiphol.
Knowledge sources include the paper of Vos et al. [9]
The cleaners of Asito are the target group, these people mostly have a low level of education and often have an immigration background. Therefore, the designed system must be easy to understand.
With the undertaking of this project, there is an assumption that the cleaners are willing to adapt to the new system.
Constraints include privacy laws and the attitude of restroom users towards the system.
A big risk of the project is that the system will not be accepted by the cleaners.
Costs include developing and implementing the system, and training of the cleaning staff.
The goal of the project is to predict/indicate restrooms that have the lowest level of cleanliness.
Design of data
The domain model for this case comes from a research by Vos et al, it is shown in figure 9.
The data subjects are the restroom visitors, the users are the cleaners, and other stakeholders are the IT department,
management of Asito & Schiphol, and the investors of both companies.
What needs to be measured are the dimensions cleaned, fresh, and uncluttered. Vos et al also defined twelve items to make this measurable. These are shown in figure 11. However, it is hard to measure this.
Use of data
7
Table 11: three dimensions of cleanliness perception and their subitems [9]
Cleaned Fresh Uncluttered
- it is neat here - it is clean here - it is hygienic here - it is well swept here - it is well maintained here
- it is well looked after here
- it is dust free here
- it smells clean here
- it smells hygienic here - it smells fresh here
- it is organized here
- it is orderly here
6.
DISCUSSION & CONCLUSIONS
So how does the Datafication Framework of Alberts-de Gier compare to other methodologies? The problem was approached from both a theoretical and practical viewpoint. From the theoretical comparison, one can see that the Datafication Framework covers most of the concepts that are covered in the other methodologies. Since the Datafication Framework was not finished at the time of this research, the practical approach proved to be more challenging. However, one main difference with the other methodologies that emerged is that the Datafication Framework specifically asks for a domain model and questions it.
Overall, the other selected methodologies are all lacking in certain areas. The Datafication Framework of Alberts-de Gier can bring relevant contributions to the field, especially if it manages to bridge the gaps that the other methodologies leave. From the research, recommendations for the Datafication Framework are to add questions to the different steps, to potentially incorporate sustainability and social desirability like RRI has, for the stakeholders potentially incorporate human values like VSD has, and to encourage the user to incorporate the stakeholders in the design process and get frequent feedback from them.
7.
REFERENCES
[1] Alberts-de Gier. 2018. Understanding customers through data. Retrieved April 28, 2019 from
https://medium.com/datafication-of- experience/understanding-customers-through-data-pdeng-qualifier-sept-2018-608ff55f6297
[2] Alberts-de Gier. 2019. The datafication framework. Unpublished work.
[3] AREA 4P Framework. Retrieved May 8, 2019 from
https://www.orbit-rri.org/about/area-4p-framework/#1467057166816-da75e065-e481
[4] Chapman, Clinton, Kerber, Khabaza, Reinartz, Shearer, and Wirth. 2000. Step-by-step data mining guide. [5] Friedman, Kahn, and Borning. 2001. Value Sensitive
Design: Theory and Methods. UW CSE Technical Report (December 2001).
[6] Gregor and Jones. 2007. The Anatomy of a Design Theory. Journal of the Association for Information Systems (May 2007), 312–335.
[7] RRI Website. Retrieved May 8, 2019 from https://www.rri-tools.eu/
[8] Shmueli and Koppius. 2011. Predictive Analytics in IS Research. MIS Quarterly, 35(3), 553–572.
[9] Vos, Galetzka, Mobach, van Hagen, and Pruyn. 2019. Measuring perceived cleanliness in service environments: Scale development and validation. International Journal of Hospitality Management (2019) 11-18.
8
APPENDIX
A. The Schiphol case
A.1 Design Science
A.1.1
Problem investigation
Who are the stakeholders?Users or the restrooms, cleaners, IT department of the company, management of Asito and Schiphol, investors of Asito and Schiphol.
How (in)different is this project to them? Why?
For the cleaners, it will mean a big change in the way they are performing their job, the system will guide their actions instead of their experience.
The users will have to deal with sensors in the restrooms, but if the goal of the project is met they will have a better experience in terms of cleanliness perception.
The IT department will need to create and maintain the system, for them, it is of importance that it is easy to maintain.
If the project goes well, customer satisfaction will improve. This can lead to a better reputation for both Asito and Schiphol, which will please the management and investors of both companies.
What are the stakeholder goals? Why?
Users: clean toilets, comfortable restroom experience. Cleaners: easy to use system that is proven to work better than their current way of working
IT: a system that is easy to maintain
Management & investors: a system that boosts user satisfaction
What are the phenomena? Why do they happen? Cleaners don’t have strict planning for their cleaning activities, they can decide for themselves when to clean what restroom. In case of a “cleaning emergency”, they receive a call from their supervisor.
Currently FeedbackNow boxes are installed in the restrooms but there is no way to really know what these votes mean. They do not measure cleanliness alone but they are also influenced by other factors.
What are their effects if nothing would be done about them? Do they contribute or detract from goals?
The current situation leaves room for improvement in terms of customer satisfaction. If nothing is done about this, Asito and will likely fall behind with technological advancements compared to other cleaning companies and could maybe even lose their position at Schiphol. Likewise, Schiphol could fall behind compared to other airports.
A.1.2
Treatment Design
Specify requirements and context assumptions
The methods of data collection should not invade the privacy and anonymity of restroom visitors.
The system should be easy to learn, understand, and use for the cleaning staff. A majority of the cleaning staff has a low level of education and often have an immigration background. The results of using the designed system need to be better than the current situation.
The data that is collected by the system needs to be stored securely.
The data that is collected must be anonymized.
The system needs to be working during the times the cleaning activities are conducted.
The system should be relatively easy to maintain.
The system needs to generate an accurate view of the situation at the restrooms.
The system should contribute to an increase in customer satisfaction
The system should be easily expandable to other toilets inside the airport or other facilities.
Available treatments?
Schiphol has installed people counters in some of the toilets, and has several APIs available, such as a wait times API and flight APIs. Also the results of the interviews that are conducted several times a year. And of course the FeedbackNow data is available.
After this point in the framework, actual solutions need to be designed and tested. This does not fall within the scope of this research.
A.2 RRI
Since RRI is one large table, it will be displayed on the next page.
9
Process Product Purpose People
Anticipate Is the planned research methodology acceptable?
The risks of this project lie with acceptance by cleaners and restroom users, their privacy and anonymity, the storing of the data, and security of the designed system.
Transparency vs privacy. You want to be as transparent as possible, but at the same time protect the privacy of the users. The data needs to be stored and protected well. Informed consent: Restroom users need to be made aware of the designed solution, what info it is storing about them and what the consequences are so they know what they are participating in by using the toilets.
Will the products be socially desirable?
How will people respond to the designed solution? Do they not mind there being sensors in the toilets they visit if it ultimately leads to cleaner toilets and a better experience? The most likely scenario would be that people are indifferent to the designed solution. In many places - including the airport- there are already sensors that track people. Most people are indifferent to them so it is very likely that they will also be indifferent to similar things being used for the toilets. A worse scenario would be that people do not like the designed solution and will protest against it. This will lead to unsatisfied customers and a bad reputation for the airport and cleaning company. User feedback during every stage of the design could help with this problem.
How sustainable are the outcomes?
(foresight, vision assessment, scenarios) How will the designed solution affect future solutions? People could be getting more used to having sensors everywhere. It might open a window to installing even more sensors all over the airport.
Why should this project be undertaken?
It will allow the cleaning company to put the customer experience as the central starting point of their business. If the project succeeds, it will lead to higher customer satisfaction and better experiences for people using the restrooms at the airport.
It will also make sure that Asito does not fall behind compared with its competitors.
Have we included the right stakeholders?
The relevant stakeholders are: people who use the toilets, Asito cleaning staff,
Asito management,
Schiphol management, shareholders of Asito and Schiphol, and
people who will be creating and maintaining the designed system
Reflect Which mechanisms are used to reflect on the process?
This heavily depends on the chosen design methodology. In the case of design science, there is an evaluation step at the end of the cycle.
How do you know what the consequences will be?
It will most likely change the way the cleaners do their jobs. They will clean based on the data that is collected instead of based on their own experience. To know how it will be perceived, frequent user feedback is very important.
What might be the potential use?
If it is proven to work well, the system could be implemented on a wider scale, possibly in all public restrooms.
The data that will be gathered could potentially be misused. It needs to be stored and protected well. If there is any personal information it needs to be anonymized.
How can we ensure social desirability?
It needs to protect the privacy of the users at all times. Also by getting frequent feedback from important stakeholders.
Is the project controversial?
There are privacy laws that need to be followed. People might not be pleased with the thought of sensors tracking their movements in the restroom.
Who is affected?
The people who will be most affected by the system are the customers and the cleaning staff.
For the customers, their experience in the restroom will change, for the cleaning staff, their way of working will change. If the goal of the project is made, customer satisfaction will increase which will benefit not only the customers but also Asito, Schiphol and their investors.
Engage How to engage a wide group of stakeholders?
Rewarding customers for giving feedback. Make sure that a wide range of customers is consulted. From foreign tourist who has never travelled before to businessman who flies often.
And for the cleaners: people who are open to new technologies to people who are skeptical or not good with modern technologies.
What are the viewpoints of a wide group of stakeholders?
Make sure people have a way to leave feedback about the project. And get their feedback often throughout the design process.
Who prioritizes the project?
The project is prioritized by Asito management because Asito is judged on customer satisfaction rates. They want customer satisfaction to be as high as possible.
For whom is the project done?
The goal of increasing customer satisfaction will benefit both Schiphol and Asito.
Act How can the project structure become
flexible?
If there is frequent user feedback, the results of this need to be adequately incorporated into the plan for the project. An agile approach could help with this.
What training is required?
Creators of the system will need how to handle and safely store sensitive personal data that could be generated by the designed solution. Cleaners will need to be trained on using the system.
What needs to be done to ensure social desirability?
Encouraging stakeholders to participate in the design process to get frequent feedback.
What training is required?
Designers of the system will need to have knowledge about laws concerning technology in public restrooms to determine what is allowed and what not.
How do we ensure the implied future is desirable?
Making room for frequent user feedback and protecting and anonymizing the data. Who matters?
10
A.3 VSD
A.3.1
Conceptual investigations
Who are the direct and indirect stakeholders affected by the design?
Direct stakeholders: cleaners, IT department of the company Indirect stakeholders: Users or the restrooms, management of Asito and Schiphol, investors of Asito and Schiphol.
How are both classes of stakeholders affected? Direct:
For the cleaners of the restrooms, their way of working will change. They will no longer decide for themselves when to clean which toilets but the designed system will do that for them. They will lose a bit of their autonomy.
The IT department will need to create and maintain the designed solution, which means more work for them. Indirect:
For the users of the restroom, their experience in the restroom changes. There will be more sensors and monitoring than in the current situation. If the goal of the project is met, the satisfaction of the users will increase.
If the project succeeds and customer satisfaction increases, it leads to a better reputation for both Asito and Schiphol which will please both the shareholders and management of the companies.
If the project fails, it can lead to a worse reputation for both Asito and Schiphol. Certain people of the management will take the fall for it and the shareholders will be displeased. What values are implicated?
The values are:
- anonymity and the right to privacy for the users of the restrooms
- discrimination
- autonomy of the cleaning staff
- user-friendliness of the designed solution - maintainability of the system
Trade Offs:
The privacy of the users vs. collecting data that will contribute to increasing customer satisfaction
The anonymity of the users vs. collecting data that will lead to more accurate predictions and analyses
The autonomy of the cleaning staff vs. increasing customer satisfaction
A.3.2
Empirical investigations
Any human activity that can be observed, measured, or documented.
This could include stakeholder feedback about the project. For instance, having cleaning staff interact with one or more prototypes for the end product, observing their behaviour and asking them for feedback so the design can be improved. Or conducting a survey amongst the users of the restroom to find out their opinions about the added sensors.
A.3.3
Technological investigations
How does the designed solution support or hinder human values?
Does the designed solution protect the anonymity and privacy of restroom users?
How aware are the restroom users of the sensors? How much autonomy does the cleaning staff have?
Is the design easy to use for the cleaning staff? Is the system difficult to maintain?
A.4 CRISP-DM
A.4.1
Business understanding
1.1 determine business objectivesUnits affected by the project: the IT department and cleaning department at Schiphol.
Problem area: cleanliness perception in airport toilets Current solution: FeedbackNow boxes, does not measure what needs to be measured.
Objectives:
The company wants to work with customer experience as the starting point for their business. It is judged by customer satisfaction so they want this to be as high as possible. The goal is to collect data about the situation at the different toilets and change the cleaning schedule based on that.
1.2 assess situation Tools: unknown
Data sources:
Schiphol has already installed people counters on most toilets, they also have public APIs available such as the wait time API and flight APIs. The toilets also have FeedbackNow boxes where customers can click a red, yellow or green smiley button to rate the cleanliness of the toilets.
Once per quartile, Asito does more thorough user surveys where people can voice their opinions about the cleanliness of the toilets.
Knowledge sources:
The paper by Vos et al. [9] And some internal research documents of Asito. A domain expert on the case has been interviewed.
Requirements:
Target group: the data collection must lead to a solution that adapts the cleaning schedule to customer experience on the toilets. Therefore, the cleaners are the target group. The cleaners mostly have low levels of education and often have an immigration background. This is why the designed solution must be simple and easy to use and understand.
The data that is generated must be an accurate representation of the current situation at the toilets. It must be deployable at every toilet inside the airport and the outcomes must be comprehensible. It needs to abide by the GDPR and other privacy laws.
Assumptions:
The cleaners need to be willing to adapt to the new system. The system needs to be working during scheduled cleaning times.
The data needs to be available during scheduled cleaning times.
The data needs to be an accurate representation of the current situation.
11 The attitude of the restroom users towards the sensors, privacy laws, some parts of the Schiphol APIs might be restricted.
Risks:
Designed solution is not accepted by the restroom users or cleaning employees.
System malfunctions. Data breaches. Costs:
Developing and implementing the new system Training cleaning staff to use the new system
Benefits:
Increased customer satisfaction Cleaner toilets
1.3 determine data mining goals
Increasing customer satisfaction by adapting the cleaning schedule to the cleanliness perception of the customer.
Data mining goals
Predict or indicate toilets that (will) have a low level of cleanliness based on the variables mentioned by Vos et al. [Vos et al]
Next steps
The next steps all assume that the needed data is already out there and only needs to be collected and analysed. In the Schiphol case, this is not true. Some existing data could potentially be used, but some other data will need to be collected first.
A.5 Datafication Framework
Domain model: see figure 9.
Stakeholders:
Data subject: Users or the restrooms User: cleaners
Others: IT department of the company, management of Asito and Schiphol, investors of Asito and Schiphol.
What is going to be measured?
Vos et al. [9] defined three main influences on cleanliness perception, namely clean, fresh, and uncluttered.
These three dimensions were defined in twelve items, these are shown in table 11.
Ideally, the 12 aspects mentioned in table 11 would be measured to determine the perceived cleanliness in a certain restroom. One way of doing this could be by incorporating the aspects in the questions of the mini interviews and conducting these full time. Unfortunately, this is not feasible on an operational level since it is too expensive and subjective. Another way of measuring these is to install cameras and sensors in the restrooms. For example, a so-called electronic nose could be trained to detect when the restroom has a bad smell. Unfortunately, installing sensors and cameras in every restroom is very expensive and not viable. This would also give rise to privacy concerns, as people would be tracked and observed when using the restroom. This gives rise to the question, what could be measured then?
The restroom architecture could undergo a one-time evaluation so the state of the light, colours, and other aspects can be determined. Small and simple sensors could be installed, for example in the soap dispensers and toilet paper dispensers, which can indicate when they are almost running out of supplies.
Instead of sensors measuring when a toilet is dirty or there is a bad smell, have so-called call to action buttons that the restroom visitors can click. It would roughly be the same as the FeedbackNow buttons, but instead of the smiley buttons, there are buttons for dirty floor, dirty toilet, bad smell, etc.
Use
Goals:
- restroom users have a comfortable experience
- an easy to learn, understand and use system for cleaning staff
- The data must form an accurate representation of the real-life situation
![Figure 2: The engineering cycle [10]](https://thumb-us.123doks.com/thumbv2/123dok_us/9654520.467433/1.595.57.285.504.572/figure-the-engineering-cycle.webp)
![Figure 3: An overview of the AREA 4P Framework [3]](https://thumb-us.123doks.com/thumbv2/123dok_us/9654520.467433/2.595.315.494.82.263/figure-overview-area-p-framework.webp)
![Table 6: eight components of an information systems design theory [6]](https://thumb-us.123doks.com/thumbv2/123dok_us/9654520.467433/3.595.48.293.91.537/table-components-information-systems-design-theory.webp)
![Table 11: three dimensions of cleanliness perception and their subitems [9]](https://thumb-us.123doks.com/thumbv2/123dok_us/9654520.467433/7.595.49.295.80.221/table-dimensions-cleanliness-perception-subitems.webp)
