MASTER THESIS
MEASURING DIFFERENTIATED
INSTRUCTION FROM
DIFFERENT PERSPECTIVES
Nienke Bach Kolling BSc
FACULTY OF BEHAVIOURAL, MANAGEMENT AND SOCIAL SCIENCES ELAN TEACHER DEPARTMENT OF TEACHER DEVELOPMENT
EXAMINATION COMMITTEE Dr. M. van Geel
Prof. Dr. A.J. Visscher
1
Table of contents
Abstract ... 3
1. Introduction ... 4
2. Theoretical framework... 5
2.1 Differentiation ... 5
2.1.1 Monitoring ... 5
2.1.2 Adapting instruction ... 6
2.2 Measuring differentiation ... 7
2.2.1 Classroom observations ... 7
2.2.2 Teacher self-assessments ... 7
2.2.3 Student surveys ... 8
2.3 Research questions ... 8
3. Study 1: Comparing differentiation instruments ... 9
3.1 Method ... 9
3.1.1 Aim ... 9
3.1.2 Procedure ... 9
3.1.3 Data analysis ... 9
3.2 Results ... 10
3.2.1 Comparison of instruments per measurement method ... 10
3.2.2 Comparison of items on instructional adaptations ... 12
3.2.3 Comparison of items on monitoring ... 14
3.3 Conclusion ... 15
3.3.1 Differences and similarities ... 15
3.3.2 Implications ... 16
3.3.3 Limitations ... 16
4. Study 2 ... 17
4.1 Method ... 17
4.1.1 Aim ... 17
4.1.2 Instrumentation ... 17
4.1.3 Procedure ... 21
4.1.4 Participants ... 21
4.1.5 Data analysis ... 22
4.2 Results ... 23
4.2.1 Descriptive statistics ... 23
2
4.3 Conclusion and discussion ... 38
4.3.1 Agreement on the application of items ... 38
4.3.2 Agreement on the given scores ... 39
4.3.3 Implications ... 40
4.3.4 Representativeness of respondents ... 40
4.3.5 Limitations ... 40
4.3.6 Future research ... 41
References ... 42
Appendix A. Overview of instruments for measuring differentiation ... 45
Appendix B. Dutch items from instrument ... 48
Appendix C. Instrument observer version ... 50
Appendix D. Instrument teacher version ... 56
3
Abstract
4
1. Introduction
Schools have been grouping students by age for years, attempting to create homogeneous groups of students that are appropriate for teacher-centred one-size-fits-all teaching. Although part of
children’s development is indeed related to their age, there are other influencing factors as well. This means that even within classes all sorts of cognitive, socio-economic, socio-emotional and cultural differences between students will exist. These differences influence students’ educational needs and teachers wanting to adapt their education to these differences face growing challenges as student differences increase.
In the Netherlands this increase in students’ differences is caused by the introduction of laws requiring every child to be taught in regular classrooms. As a result, a large group of children with special needs (e.g. mild intellectual disabilities, learning disabilities and behavioural problems) is now following education in regular classrooms, instead of being referred to special education schools. There has also been an increase of socio-cultural diversity in the Netherlands over the last years, creating more differences in culture, language development and socio-economic status among students. Also, the increased attention for talent development and gifted students urges teachers to not only adapt their education to students in need of intensive support, but to the high-achieving, gifted students as well. The process of adapting education to student differences is called differentiation. The Dutch Inspectorate of Education highly values differentiated teaching and yearly measures the quality of
teachers’ differentiation skills. For years they have been reporting on teachers struggling to differentiate their education: “it looks like adapting to student differences is too big of a task for part
of the teachers, especially in the instruction phase of a lesson” (Inspectie van het Onderwijs, 2016). This is striking, as research shows that students are more involved, more motivated and better performing when teachers master differentiation skills (Inspectie van het Onderwijs, 2012, 2015; Rock, Gregg, Ellis, & Gable, 2008; Tomlinson, 2004). The Dutch Ministry of Education and the primary education counsel (PO-raad) have agreed that differentiation skills are essential for quality education and made possessing these skills a basic requirement for all teachers in 2020 (Bestuursakkoord voor de sector primair onderwijs, 2014).
This agreement and the Inspectorate reports recommend the availability of valid instruments for measuring teachers’ differentiation skills and emphasizes their importance. This study explored existing differentiation instruments and answered the research question What are differences and similarities between existing instruments measuring differentiation in terms of the aspects of differentiation they measure? Based on existing instruments a new instrument has been developed in the second part of this study. This instrument combines the three most used methods to measure differentiation: classroom observation, teacher self-assessment and student surveys. It has been used to answer the research question What is the degree of agreement between teachers, students and an
5
2. Theoretical framework
2.1 Differentiation
A considerable amount of literature has been published on the topic of differentiation. Nevertheless, it seems that there is still no agreement on the definition of differentiation. Most studies agree on the broad definition of differentiation being the process of adapting education to differences between students. While this definition focusses on making educational adaptations, Roy, Guay and Valois (2013, p. 1187) add to this: “using systematic procedures for academic progress monitoring and
data-based decision making”. This suggests that differentiation includes two components: analysing data to inform adaptations (monitoring) and the implementation of these adaptations. Van Geel et al. (2018) made a differentiation skill hierarchy and found four chronological differentiation stages: (1) preparing a lesson period, (2) preparing a lesson, (3) teaching a lesson and (4) evaluating a lesson. They found that teachers use monitoring as well as adaptation skills in each of these stages: when preparing a lesson, teachers use their evaluation of the previous lesson as well as their preparation of the lesson period. Also, during the lesson they continuously monitor the progress and achievement of their students. The adaptations that teachers make for their students during a lesson are planned in their lesson period and lesson preparation and evaluated during and after each lesson. Although monitoring and adapting seem inseparably linked, they are hardly described together in differentiation research, where most research focusses on the adaptation strategies. Research on monitoring can be found in the field of data-based decision making in education. Both components will be further elaborated.
2.1.1 Monitoring
Monitoring includes systematically collecting, analysing and interpreting student data. When teachers use this information to decide which instructional adaptations to apply, these adaptations are more likely to be effective (Inspectie van het Onderwijs, 2016; Roy et al., 2013). The process of data use has three steps (Coburn & Turner, 2011). Data use begins as people notice the data or patterns in the data. After noticing the data, it should be interpreted: what does these data mean? The third step is the
construction of implications for action, which will inform what people do in response to the data. Monitoring includes these three steps. Coburn and Turner argue that interpretation is a central part
of the data use process, “playing a role in how individuals notice data in the first place, how they make meaning of it, and how they come to understandings about the implications of the data for action”
(Coburn & Turner, 2011, p. 177). Interpretations are always influenced by peoples’ pre-existing beliefs, experiences and knowledge, making proper data use a complex skill.
Which data teachers collect or use depends on the goals they want to achieve with their education, the target group they see for differentiation and the student differences they see as relevant. Teachers can differentiate either to reach a minimum performance level with all students, or to help every student reach his maximum potential (Deunk, Doolaard, Smale-Jacobse, & Bosker, 2015). Striving for the first is called convergent differentiation and will decrease differences between students (Bosker, 2005). Divergent differentiation on the other hand is likely to maintain differences or increase them. Among the advocates for divergent differentiation is Tomlinson, who argues that every student should have the opportunity to perform at his best (Tomlinson, 2003).
6 importance of adapting to the learning needs of all students, implying divergent differentiation (Prast, Van de Weijer-Bergsma, Kroesbergen, & Van Luit, 2015; Roy et al., 2013; Tomlinson, 1999, 2000). Data on various student differences can be collected, but the relevance of these differences depends partly on the frequency they occur in. In a survey among 773 Dutch primary school teachers, most teachers reported a large degree of cognitive differences (96.4%), differences in learning style (90%) and socio-emotional development (88.9%) between their students (Jettinghoff & Grootscholte, 2014). The same teachers reported a limited degree of socio-economic and cultural differences. Student readiness (the current level of knowledge and skills in a subject area) is a cognitive difference and is frequently used in literature together with students’ learning profile and interests (e.g. Prast et al., 2015; Tomlinson et al., 2003). According to Vygotksy (1978), students learn when they undertake activities that are slightly more difficult than what they are capable of independently. Whether activities fall within this so-called zone of proximal development, depends on students’ readiness.
According to Reezigt (1993), teachers adapt their education mainly to performance differences. In this study the following definition of differentiation will be used: differentiation is the process of adapting education to cognitive differences between all students, using systematic procedures for academic progress monitoring and data-based decision making. This definition emphasizes the importance of adapting for all students, not only special needs or low ability students. It also emphasizes student performance as student difference to which education should be adapted.
2.1.2 Adapting instruction
Teachers can make a wide range of adaptations in their teaching, which makes it infeasible to present an exhaustive list. The Dutch Inspectorate of Education distinguishes four aspects of education that can be adapted: content, instruction, learning tasks and time (Inspectie van het Onderwijs, 2016). Often cited is Tomlinson’s division in content (what students learn), process (how they learn it), product (how students demonstrate their learning) and learning environment (e.g. Rock et al., 2008; Roy et al., 2013; Tomlinson, 2001; Tomlinson et al., 2003).
Although there is a lot of research regarding the various ways in which teachers can adapt their instruction, it is still not clear which strategies are actually effective (i.e. lead to better performance of students). The reason for this is that most research on adapting instruction can be grouped into one of three types. The first type of studies develop and evaluate a differentiation instrument. The results of these studies are primarily focused on the quality of the instrument, not on the effectivity of the listed strategies (see for example Gentry & Owen, 2004; Nelson, Demers, & Christ, 2014; Rock et al., 2008).
The second type of research has an experimental design: teachers in the experimental group differentiate their education, generally after having received a training, while teachers in the control group do not. The effects of the intervention – often on student performance or motivation – are measured by means of a pre- and post-test (see for example Chamberlin & Powers, 2010; Kamminga, 2014; Van der Scheer, Glas, & Visscher, 2016). Any measured positive effects can be attributed to the intervention, however, the intervention typically consists of the implementation of multiple adaptation strategies simultaneously. This makes it very difficult to conclude which strategy contributed most to the measured positive effect or which strategy had no effect at all.
7 of differentiation for high-achieving students in primary school math lessons (e.g. additional instruction and curriculum compacting), although offering enrichment tasks for high-achieving students ranked among the most used strategies, together with giving additional instruction to low-achieving students. Whipple (2012) concluded that most teachers in her study differentiate in the content they teach and by adapting to students’ interest. Graham et al. (2008) compared the use of spelling strategies between weak and strong spellers and found that teachers conference more with weak spellers and their parents, as well as they re-teached them skills and strategies more often. They concluded that 42% of the teachers indicated they made few or no adaptations for weaker spellers. The limitation of studies of this type is that the results only concern the strategies listed in the survey. That this is not very likely to be exhaustive, is shown by Graham et al. (2008) when they asked teachers in a open-ended question to identify additional adaptations not previously mentioned in the survey and received 190 unique adaptations.
Concluding, most studies into differentiation strategies do not investigate effective strategies at all or give a limited view because they investigate a combination of strategies or their own selection of strategies. There is little research that shows which differentiation strategies are effective and so it remains uncertain what high-quality adaptations are. This implicates that differentiation instruments are not yet able to measure the quality of teachers’ differentiation skills. An instrument can indicate how often a teacher makes an instructional adaptation, but without research showing that more adaptations lead to better educational quality, teachers’ differentiation quality cannot be properly measured.
2.2 Measuring differentiation
There are three common methods for measuring differentiation: classroom observations, teacher self-assessments and student surveys. Each method has its own strengths and weaknesses. These are briefly mentioned here.
2.2.1 Classroom observations
Classroom observations are commonly used to evaluate teachers and for teachers to receive feedback on their performance from principals or peers. Usually an observation form is used for classroom observations. These forms consist of a list of predefined statements that an observer uses to assess teachers during an observation. The advantages of such a form are that it is clear for both teacher and observer where the focus of the observation lies and it avoids teacher self-report (Hill, Charalambous, & Kraft, 2012). Also, when observers are trained in the interpretation of the items, it increases consistent assessment among observers, making the results of an observation more objective (Dobbelaer, 2019). A disadvantage of using classroom observations is that an observation usually offers information on only one or few lessons and an observer may not be able to observe the entirety of the instructional process, e.g. how cognitive differences between students affect instructional decisions of the teacher (Williams et al., 2014). Classroom observations could also be a time-consuming and costly method when using multiple (trained) observers who each observe the same teacher over several lessons, which is needed to obtain a valid score (Dobbelaer, 2019).
2.2.2 Teacher self-assessments
8 teachers’ underlying thought and intentions that inform their decisions (Dobbelaer, 2019; Goe, Bell, & Little, 2008). A disadvantage of using self-assessments is the risk that teachers overestimate their skills and behaviour, for example because they give socially desirable answers or they are unable to recognize their underperformance (Goe et al., 2008). Also, teachers could interpret items differently, leading to less valid results (Dobbelaer, 2019).
2.2.3 Student surveys
Differentiation can also be assessed by students filling in a survey with questions or statements about
their teachers’ differentiation behaviour. There are several advantages to using student surveys: student perceptions are relatively easy to collect with multiple respondents providing their opinion at the same time, they are formed over longer periods of time, they offer multiple perspectives on differentiation as it is experienced by different students and allow for insight into the way students experience differentiation as they are the target group of teachers’ adaptations (Nelson et al., 2014; Van der Scheer et al., 2016). Despite these advantages, Van der Scheer, Glas and Visscher (2016) quote that “student perceptions are rarely used in primary education for collecting information about how (well) teachers teach". The main reason might be that student perceptions can easily be influenced by external factors: teachers can behave differently to different students, students may have different expectations from teachers and students may interpret teacher behaviour differently (Van der Scheer et al., 2016). Also, not all students can fill in a questionnaire (e.g. young children) and students might have different interpretations of items, making the results less valid (Dobbelaer, 2019).
2.3 Research questions
With at least three methods to measure differentiation, the question arises how these methods relate to each other. Therefore, study 1 is an explorative study into the differences and similarities between existing differentiation instruments (e.g. which constructs are measured by the items, how are the items formulated, how can the items be scored and which method is chosen). It answers the first research question: What are differences and similarities between existing instruments measuring differentiation in terms of the aspects of differentiation they measure?
9
3. Study 1: Comparing differentiation instruments
3.1 Method
3.1.1 Aim
This is an explorative study, aiming to compare existing differentiation instruments to see whether these instruments measure the same aspects of differentiation. The central research question is: What are differences and similarities between existing instruments measuring differentiation in terms of the aspects of differentiation they measure?
3.1.2 Procedure
A literature search was conducted in the scientific databases ERIC and Google Scholar to find existing differentiation instruments. The databases were first searched with different combinations of the general keywords differentiation or differentiated instruction and instrument or measurement. A second, more specific search also included the keywords observation, survey, self-assessment and
student perception. The citation lists of relevant studies also have been used to search for other articles.
Relevant studies include an instrument used to measure differentiation. In order to compare instruments, the full instrument or a list of items should be available. Studies focus preferably on primary education, but secondary education is also admissible. Instruments may measure differentiation during a specific subject as well as during teaching in general. Following the definition of differentiation used in this study that differentiation is adapting education to the learning needs of all students, studies that investigated differentiation as a way of only serving a specific group of students (e.g. high or low achieving students) have been excluded. Instruments include preferably only differentiation items, but instruments with only one or more sub scales on differentiation are also admissible.
3.1.3 Data analysis
ATLAS.ti is a program for qualitative data analysis and was used to compare the differentiation instruments. Two types of analyses were carried out using ATLAS.ti. For the first analysis all instruments were grouped based on specific characteristics, such as measuring method (observation form, teacher self-assessment, student survey), level (primary/secondary education), subject and item format. This grouping allowed for a comparison per measurement method.
For the second analysis all items per instrument were coded. In the first coding round, all items were determined as a way of monitoring and collecting data or as a differentiation strategy. Some items did not fit in either category because they are conditional to differentiation, such as 'I know the opportunities for differentiation offered by the curriculum'. Or they included a strategy that does not specifically apply to differentiation, such as 'The teacher gives positive feedback about commitment' or 'Students and the teacher work together to solve problems'. Items specifically aimed at differentiation for weaker or stronger students and subject specific items (math or spelling) were also identified in this coding round.
10 adaptations for stronger and weaker students. The items identified as monitoring were in this coding round coded monitoring before, during or after the lesson.
3.2 Results
Appendix A presents an overview of the 17 instruments used for his study. There are seven observation instruments, six self-assessment reports for teachers and five student surveys. Nine of these instruments are developed for use in math lessons. Five instruments include only one or a few subscales on differentiation. Two studies did not include a full outline of their instrument and as a result only part of these items is known, or the exact wording of these items is unknown. First, the examined instruments will be discussed per measurement method (classroom observation, teacher self-assessment, student survey), followed by a comparison of adaptation items and monitoring items from all instruments.
3.2.1 Comparison of instruments per measurement method
Classroom observation instrumentsSeven observation instruments have been examined with an average of 16 differentiation items per instrument (SD = 19). All instruments were developed for observations in primary classrooms and are no older than ten years. Two instruments measure teaching quality instead of differentiation, but consider differentiation as a part of teaching quality, and therefore include a subscale on differentiation. Five instruments have been used to observe math lessons, although only three of them actually include math specific items, like ‘The teacher makes the connection between the different levels of action’. Five instruments use Likert scales as a way of scoring items. These Likert scales vary from 1-3 (1=ineffective, 3=effective) to 1-5 (1=unsatisfactory, 5=excellent). Another instrument requires that items are scored on either observed or not observed and again another instrument provides the observer per item with a written explanation of the meaning of each score. Three instruments present items supported by good practice examples: the item ‘The teacher adapts the practice of the learning content to relevant differences between students’ is accompanied by the good
practice example ‘The teacher differs the complexity of assignments between students’. These examples can be scored on their occurrence during a lesson.
When looking at the subscales of the observation instruments, there is one instrument entirely focused on differentiated instruction, with the subscales Whole group instruction, Extra instruction for struggling students and Instruction for high-achieving students. Another instrument also distinguishes items for high- and low-achieving students. Three instruments have subscales on classroom management. Other frequently used subscales concern differentiation of instruction, practice, content, task and process.
The instrument developed by VanTassel-Baska et al. (2008) is notable because it includes items to observe teachers which are also translated into items to observe students. For example, the teacher
item ‘The teacher provided opportunities for independent or group learning’ matches the student
item ‘Students worked on projects individually or in pairs/groups’.
Self-assessment instruments
11 instruments are not older than ten years. Five instruments have been used in research into primary school teachers, one instrument has been tested with the help of mathematics teachers in secondary education. This instrument also includes math-specific items, such as ‘I’ll allow students to solve a sum
very differently.’ Two other instruments have also been used by teachers to assess their differentiation skills in the math domain, but only one of these instruments also includes math specific items. Of all instruments studied, there is one instrument that was specifically designed for differentiation in spelling education, with items such as ‘How do you encourage students to use invented spellings?’
The instrument of Roy, Guay and Valois (2013) has two scales: ‘instructional adaptations’, with items
concerning the adjustments that teachers can do in their classroom and ‘academic progress
monitoring’, with items on the systematic approach to data collection to base the adjustments on. Most instruments make such a distinction. Similar scales to ‘academic progress monitoring’ are ‘identification of educational needs’, ‘analyse learner’ and ‘assessment’. Similar to the instructional
adaptations scale are ‘differentiated practice’, ‘craft instruction’ and ‘content/process/product’. Van
’t Riet (1995) uses a different approach. In addition to two scales on differentiation behaviour, his instrument also includes a scale with non-differentiation behavioural items that are scored in the opposite direction, such as the item ‘I let all pupils work through the same material’. This instrument
also has items in both a teacher and pupil variant. For example, a teacher item is ‘I discuss the
differences between students’ solutions with the whole class’ and the accompanying student item is ‘This teacher discusses the differences between students’ solutions with the whole class’.
A different instrument is that of Graham et al. (2008). The items include, in contrast to the other instruments, no examples of differentiation behaviour, but all kinds of (spelling specific) lesson activities, such as repeating material, using games to practice and collaboration. Differentiation behaviour of the teacher must be apparent from the way in which the items are scored: how often does the teacher do this with good and how often with weak spellers. A teacher who differentiates well will make many adjustments for both groups of pupils and not only for the weak spellers. It is noteworthy that there is no third response category for average spellers. This makes it somewhat unclear whether teachers have to omit the average spellers in answering the questions or divide the class into two groups, with the average spellers falling under the ‘good spellers’. Because of its different form it is not possible to divide the items of this instrument into the used categories, but because of the interesting way of scoring the instrument is mentioned here.
Three other instruments include items specifically focused on weak or strong student, e.g. ‘I set extra
challenging goals for high-achieving students’. All studied self-assessment instruments are about the daily practice of teachers, not about a specific lesson. The instrument to be developed in the second study will thus deviate on this point because the results will be compared to a single observation.
Student surveys
Five student surveys have been examined with an average of 12 differentiation items per instrument (SD = 5). What is striking is that only two instruments were actually designed to measure differentiation. A third instrument has a scale on differentiation as part of a questionnaire about the perceptions of students of their learning environment. Two instruments do not have a scale that explicitly deals with differentiation, but there are certainly items that point to differentiation behaviour. The questionnaire of Van der Scheer et al. (2016) for example, includes the scales ‘clear instruction’ and ‘challenge students’. When a teacher differentiates well, it is plausible that both strong, average and weak students find the instruction clear and feel challenged. The student questionnaire of Gentry and Owen (2004) also includes a scale ‘challenge’. Theirscale ‘choice’ has also
12 more choice. This topic is also reflected in many other instruments and this scale determines whether students also experience these options.
What is also striking is that most instruments have been designed for or used in secondary education. Only the instrument of Van der Scheer et al. (2016) has asked fourth grade students (group 6 of the Dutch primary school) to assess their teacher. An explanation could be that researchers expect older students to be more able to assess their teacher. The instrument to be developed will therefore focus on the oldest students of primary schools (Dutch group 6-8).
3.2.2 Comparison of items on instructional adaptations
The instructional adaptations that teachers can make during their lessons are grouped into 15 categories. These categories are listed below per phase of the lesson in which they occur: during the entire lesson, the instruction phase, or the practice phase.
Adaptations during the entire lesson
Adapting the learning goals and corresponding expectations to differences between students is mentioned in four instruments. Most of these items are formulated rather vague, like ‘The teacher
adapts the learning goals/expectations to relevant differences between students’. From this item it
does not become clear which differences are considered to be relevant. Other items on adapting learning goals take student performance as a relevant difference to adapt goals to. One instrument distinguishes between ‘extra challenging goals for high-achieving students’ and ‘well-considered minimum goals for very low-achieving students’.
Providing students with options is a way to better connect education with students. Students can be given a choice in instruction, practice and grouping. It is assumed that students make choices based on their educational needs and occasionally on the basis of interests. An example item is ‘The teacher
offers the students options that enable them to better align aspects of instruction and practice with
their educational needs’.
Teachers may use a variety of materials to support their lessons. Half of the reviewed instruments include items on adapting these materials. Three types of items can be distinguished. Items on the use of extra materials: ‘The teacher allows some children to make use of auxiliary materials’. Items on the use of different materials: ‘I use a variety of materials other than the standard text’. And items that specify the student differences to adapt materials to: ‘My teacher helps me pick books or materials
that are on my level’. In addition to adapting materials to students’ level, adapting to their learning needs and interests is mentioned.
Only three instruments include items on differentiating through ICT. The instruments of Graham et al. (2008) and Prast et al. (2015) include some items on ICT as a way to learn new things, practicing weaker skills and offering challenge to stronger students. The research by Nieboer (2015) focuses on differentiation by means of the app Snappet, where the assignments that students receive are adapted to their previous answers. Her observation tool includes items on the use of Snappet by teachers. It seems somewhat striking that most recent differentiation instruments have no items on ICT, whereas nowadays ICT is often used in schools to adapt assignments to the level of students. In a review of several studies into ICT-based differentiation, Deunk et al. (2015) suggest that ICT can certainly contribute to the performance of students.
Adapting assessmentto students’ needs is mentioned infour instruments. Items such as ‘I provide a
variety of assessments tasks’ and ‘Grades are assigned based on individual student growth’ show the
13
Adaptations during the instruction phase
The most frequently mentioned instructional adaptation is more instruction, usually for weaker students by means of pre-teaching prior to whole-class instruction or extended instruction at the end of the whole-class instruction (‘The teacher offers struggling learners pre-instruction before formal instruction starts’). Additional instruction for stronger students focuses on instructing on another level or different subject matter (‘The teacher gives stronger students additional instruction on the enrichment matter’).
Varying the content of the instruction for different groups of students is frequently mentioned within the context of instruments that specifically focus on differentiation during math lessons. This concerns in particular the use of strategies and step-by-step plans, for example, ‘The teacher determines the preferred strategy with weaker students’ and ‘The teacher discusses the advantages and disadvantages of strategies with stronger students’. Other math-specific items concern instruction at various levels of acting (informal – formal) and giving time to think after introducing a math problem. The third most frequently mentioned strategy is adapting the questions asked to students during the instruction phase. Teachers could ask open-ended questions that can be answered by all students (‘I
deliberately ask open-ended questions during whole-class instruction’) or ask questions on different levels to reach all students. One instrument distinguishes the type of questions that should be asked to weaker and stronger students: questions to weaker students about remembering, understanding and applying (lower order thinking skills) and questions to stronger students about analysing, evaluating and creating (higher order thinking skills).
Four instruments have items on adapting the pace of the instruction to students. Other frequently mentioned items on adaptation during the instruction phase include explaining the learning content in different ways, like visually or verbally, at different abstraction levels or with more or less support. Most of the items about adapting instruction are specifically aimed at weaker or stronger students. For weaker students extended instruction, pre-teaching, a slower pace of instruction, more repetition and visual support are mentioned. Three instruments also have items on adapting the communication for weaker students: teachers should give them positive feedback, compliments and express positive expectations towards weaker students. Items for stronger students focus on providing enrichment materials with enrichment instruction, challenging questions, a faster pace of instruction and more process-focussed feedback.
Adaptations during the practice phase
The practice phase comes right after the instruction and is the phase in which students process the learning content, usually by making assignments. Most differentiation instruments include items about adapting practice to students. In addition to general items, such as ‘Adapts practicing the
learning content to relevant differences between students’, there are many items that mention
concrete adaptations. Most often mentioned is adapting the difficulty of the assignments (‘Vary the complexity of assignments to match students’ abilities’), the amountof assignments (‘The teacher
gives different groups of students a different number of assignments’), the type of assignments (‘I
14 enrichment material. To accommodate weaker students, teachers can provide more help, offer repetition assignments and select only the most important assignments.
Half of the instruments include items about grouping students during the practice phase. Most often these items suggest to vary different working and grouping forms, such as working individually,
working together in pairs or in a larger group (‘Let students work both individually and as a group’).
Some items emphasize that grouping should be flexible: ‘Flexible grouping is used’. Research has shown that flexibility is an important characteristic of groups (Deunk et al., 2015; Prast et al., 2015). There are also items in which the emphasis is on the student characteristics that groups should be formed on, such as level, working pace, previously achieved results, interests and learning preferences
(‘I group students for learning activities based on readiness, interests, and/or learning preferences’).
3.2.3 Comparison of items on monitoring
In order to make instructional adaptations based on the needs and interests of students, these student characteristics must be mapped. Therefore, teachers must gather enough information about their students, analyse this and use the results in their lesson preparation and during their lesson. At the end of each lesson, they must also examine whether the adjustments made have produced the desired effect and if students are making sufficient progress. Monitoring students is therefore ideally a continuous process. The items coded as monitoring items can be divided into three categories, following the differentiation stages of Van Geel et al. (2018): before the lesson (preparing lesson period/lesson), during the lesson and after the lesson (evaluating lesson). These three moments of monitoring all have a different goal. Weak items only mention monitoring activity, but not to which end the monitoring takes place.
Before the lesson
Before any lesson or when preparing a period of lessons, it is important to collect data on relevant student characteristics. This makes it easier to plan lessons, cluster students into groups with the same
educational needs and set goals. The item ‘Readiness, interests, preferences, strengths, learning needs, stages of learning are evaluated’ shows multiple student characteristics for teachers to collect data on. Most differentiation instruments focus on collecting data on the level or performance of students as these items show: ‘My teacher knows what subjects or skills are easier for me’ and ‘I
analyse the answers on curriculum-based tests to assess students’ educational needs’.
During the lesson
Monitoring students should be a continuous process and should therefore also take place during the
lesson: ‘The teacher checks the progress of students during the practice phase of the lesson’ and ‘I
assess specific students’ educational needs based on (informal) observations during the math lesson’.
Monitoring during the lesson gives teachers the opportunity to adjust their education right away and gives them feedback for further lessons.
After the lesson
At the end of the lesson and afterwards, teachers evaluate whether the set goals have been achieved and whether the chosen approach matched students’ needs. This includes items such as ‘I assess at the end of the lesson to determine knowledge acquisition’, ‘I mainly check the homework of weak
15
3.3 Conclusion
3.3.1 Differences and similarities
This study aimed to answer the question What are differences and similarities between existing instruments measuring differentiation in terms of the aspects of differentiation they measure? There are some similarities between the examined instruments:
- Most instruments use Likert scales as a way of scoring items;
- Most instruments are specifically designed to be used by either an observer, teachers or students. A single instrument has been designed for usage by multiple parties, such as a teacher and his students;
- Most instruments include similar differentiation scales with respect to adaptations during the entire lesson, during the instruction phase, during the practice phase or monitoring;
- Most classroom observation instruments and teacher self-assessments are designed to measure differentiation, unlike most student surveys that measure differentiation as a part of teaching quality or classroom environment;
- Many items are formulated rather vague, like ‘The teacher adapts the learning
goals/expectations to relevant differences between students’. From this item it does not become clear which differences are considered to be relevant.
The examined instruments differ in a number of ways:
- Some instruments are designed for classroom observations in general, others specifically for use in math lessons;
- There is a big difference in the number of items per instrument, varying from less than 10 items to more than 50 items;
- There is a large difference in the number of items per measurement method: student surveys include on average 12 items (SD = 5), observation instruments on average 16 items (SD = 19) and self-assessment instruments on average 32 items (SD = 16);
- Some instruments are intended to assess a specific lesson and other instruments are intended to assess teaching across multiple lessons during a period or school year;
- Some instruments have items specifically focused on differentiation for stronger or weaker students, while other instruments do not specify this;
- Observation and self-assessment instruments generally aim to assess differentiation directly, while student surveys assess differentiation as part of measuring the teaching quality; - The examined observation instruments are designed for use in elementary classrooms, while
the student surveys have been used in secondary classrooms. The self-assessment instruments have been used in both types of schools.
16 assignments and tasks, pace and provided learning time, questions, classroom activities, and instruction.
All items in these subcategories are about adaptations that teachers can make, but those adaptations are only effective if they meet the needs of the students. Van Geel et al. (2018) rightly point out that there are hardly any items that assess this match: “Although items such as ‘Attended appropriately to students who struggle with learning’ in Tomlinson et al.’s (2008) observation scheme or “I adapt the level of abstraction of instruction to the needs of the students” from the self-assessment instrument by Prast et al. (2015) appear to relate to this match, it is unclear how the observer or teacher would be able to indicate the appropriateness of the adaptation(s)”.
3.3.2 Implications
This study has provided an overview of existing differentiation instruments and their characteristics. Implications of the results of this study for the development of a new differentiation instrument are discussed below.
As mentioned before, most instruments include many examples of differentiation strategies. However, crucial to successful differentiation is not making adaptations, but making adaptations that match the needs of the students. For the instrument to be developed, it is therefore important that items not only list possible strategies, but focus on adapting those strategies to the needs of the students (e.g., ‘The teacher gave extra instruction to students who needed this’ instead of ‘The teacher gave extra instruction’). Items should be formulated in such a way that external observers and students can also assess them, so their perspectives can be compared.
In the theoretical framework it was already concluded that there is little research on which differentiation strategies are effective. As long as a widespread definition of high-quality differentiation is missing, instruments measuring differentiation can assess which strategies the teacher uses, but not whether this is high-quality differentiation. The instrument to be developed will therefore have to include relevant aspects of differentiation, but cannot claim to measure its quality. For the instrument to be developed, it is important that the same items can be assessed by observers, teachers and students, so that their perspectives can be compared. The instrument to be developed will therefore focus on differentiation during the instruction phase, as this phase is clearly visible to all involved, in contrast to, for example, the preparation of the teacher or monitoring student results after the lesson. In order to view the instruction phase more specifically, the items in the instrument to be developed will focus on math instruction. A large part of the examined instruments focus on math education and also include math-specific items. This is useful input for the items to be developed and can help to formulate the items as explicitly as possible.
For the student variant of the instrument to be developed, it is important that items focus on the individual perception of students and therefore be formulated personally, for example ‘The teacher explains well to me’ instead of ‘The teacher explains well’. Students may have different needs and expectations of their teacher, teacher behaviour may be interpreted differently by students, and teachers may approach different students differently, but by asking students about their personal experiences this could be overcome (Van der Scheer et al., 2016).
3.3.3 Limitations
17
4. Study 2
4.1 Method
4.1.1 Aim
This study aimed at answering the following research question: What is the degree of agreement between teachers, students and an external observer on how they assess teachers’ differentiation
behaviour? To compare the different perspectives, an instrument has been developed that included similar items for all three rater-groups. This instrument has been tested in multiple classrooms.
4.1.2 Instrumentation
The first study provided useful insights into existing instruments to measure differentiation. Based on these insights, a list of criteria has been formulated for the instrument to be developed. This instrument should:
- Measure relevant aspects of differentiation, both monitoring and adapting. Relevant aspects are in line with the definition of differentiation as used in this study and are frequently mentioned in the instruments that were studied;
- Measure to what extent teachers differentiate their instruction, instead of judging how well they differentiate, as scientific literature does not fully agree on what high-quality differentiation is;
- Focus on teacher behaviour rather than on student behaviour, as the teacher does the monitoring and adapting;
- Include similar items for teachers, students and observers, so their perspectives can be compared;
- Include items which can be scored by an observer during a single classroom observation; - Include math specific items, as around half of the studied instruments show that subject
specific items can be more concrete and the majority of these items focus on math, giving useful examples;
- Allow raters to score a teacher’s differentiation behaviour for different instruction groups, as teachers may adapt their instruction differently for different groups of students;
- Allow raters to score to what extent they agree with the items, using a Likert scale;
- Be used and understood by students and therefore, target students in the highest grades of primary school as older students are more likely to be able to express themselves.
To determine relevant aspects of differentiation, Fout! Verwijzingsbron niet gevonden. has been drawn based on the results of the first study. It shows the number of items for each category for each of the three methods. It is apparent from this table that student surveys have a relatively small number of items and – because of this – cover less categories, compared to the other two methods. Most items concern ‘adapting through giving choices’ and ‘monitoring during the lesson’. ‘Adapting the whole-class instruction’ and ‘subgroup instruction’ are the most popular categories in observation instruments. Teacher self-assessment instruments include a relatively large number of monitoring items, as this might not be as visible to students and observers as making adaptations is and because students and observers will only be able to score monitoring that takes place during the lesson. Items classified as ‘non-specific’ are broadly formulated items on differentiation, like ‘The teacher
adapts the instruction to the relevant differences between students’. It clearly is a differentiation item,
18 instruction accordingly. Other items in these categories have only been mentioned once and therefore have no separate category.
Table 1. Items from the instruments studied per category and measurement type
Category Observation
form
Teacher
self-assessment Student survey Total Adaptations during entire lesson
Choice 3 9 8 20
Materials* 8 5 1 14
Goals* 6 5 1 12
Assessment - 3 2 5
ICT* - 4 - 4
Non-specific/other 4 10 - 14
Adaptations during instruction
Low-achieving* 23 3 - 26
High-achieving* 13 - - 13
Whole-class* 14 3 1 18
Time* 18 5 1 24
Grouping 2 3 - 5
Pace 2 3 - 5
Non-specific/other 1 5 8 14
Adaptations during practice
Difficulty* 8 6 2 16
Grouping 8 6 1 15
Time 6 - 2 8
Amount* 3 4 - 7
Non-specific/other 7 12 2 21
Monitoring
Before the lesson 1 19 - 20
During the lesson* 8 9 4 21
After the lesson - 11 - 11
Non-specific/other - 2 2 4
Total 135 127 35 297
*Relevant categories
Relevant categories
19 adaptations made during the practice phase, changing the difficulty and the number of assignments will often be related, for example when a teacher compacts a student’s assignments (number) in order to replace them with assignments on another level (difficulty). From the monitoring items, only the ones during the lesson can be scored by all three rater-groups.
Non-relevant categories
Non-relevant categories are not in line with the definition of differentiation used, not frequently used in all three types of instruments and/or do not take into account the before stated criteria. Choice seems a relevant category to include, but was not included because from the items on choice in the instruments studied, it is not clear which teacher behaviour can be observed when a teacher offers choice. The items are too vague to expect agreement between raters. Grouping during the practice phase is not included, because from the items on grouping used in the studied instruments, it is not clear whether students with different or similar levels should be grouped. Also, following the used definition of differentiation, grouping is not so much an adaptation that teachers make in order to meet the needs of different students, but more because people in general can learn from each other and students should learn how to work together.
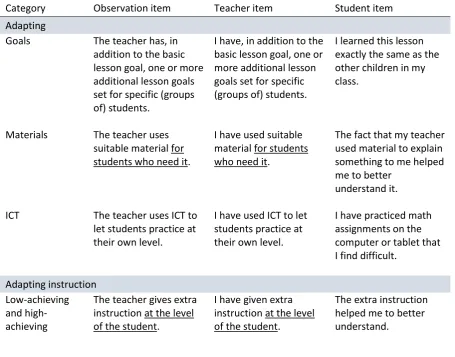
[image:20.595.72.528.404.761.2]Items have been constructed for each marked category and can be found in Table 2. The criteria stated in the previous have been taken into account in formulating the items. The original items were constructed in Dutch and can be found in Appendix B.
Table 2. Constructed items
Category Observation item Teacher item Student item
Adapting
Goals The teacher has, in addition to the basic lesson goal, one or more additional lesson goals set for specific (groups of) students.
I have, in addition to the basic lesson goal, one or more additional lesson goals set for specific (groups of) students.
I learned this lesson exactly the same as the other children in my class.
Materials The teacher uses suitable material for students who need it.
I have used suitable material for students who need it.
The fact that my teacher used material to explain something to me helped me to better
understand it.
ICT The teacher uses ICT to
let students practice at their own level.
I have used ICT to let students practice at their own level.
I have practiced math assignments on the computer or tablet that I find difficult.
Adapting instruction Low-achieving and high-achieving
The teacher gives extra instruction at the level of the student.
I have given extra instruction at the level of the student.
20 Whole-class The teacher makes the
connection between the levels at which the students act and the level at which they must act during the lesson.
I have made the
connection between the levels at which the students act and the level at which they must act during the lesson.
My teacher has explained in different ways (for example by telling, showing a model, letting us do something, etc.)
Time The teacher adjusts the instruction time to what each student needs to achieve the lesson goal.
I have adjusted the instruction time to what each student needs to achieve the lesson goal.
I have received enough instruction to
understand the lesson (i.e. not too much and not too little
instruction). Adapting practice
Difficulty and amount
The teacher adjusts the assignments (amount and difficulty) to what each student needs to achieve the lesson goal.
I have adjusted the assignments (amount and difficulty) to what each student needs to achieve the lesson goal.
The assignments I had to do were at my level (i.e. not too difficult and not too easy).
AND
I have received enough assignments to practice (i.e. not too many and not too few
assignments). Monitoring
Monitoring during the lesson
The teacher checks the students' understanding during the basic
instruction.
The teacher checks the students' understanding during the extended instruction.
The teacher checks the students' understanding during the enrichment instruction.
The teacher checks the students' progress during the practice phase.
I have checked the students' understanding during the basic
instruction.
I have checked the students' understanding during the extended instruction.
I have checked the students' understanding during the enrichment instruction.
I have checked the students' progress during the practice phase.
During the instruction to the whole class, my teacher knew whether I understood the
instruction. During the extra instruction, my teacher knew if I understood the instruction.
During the extra instruction, my teacher knew if I understood the instruction.
21 At the end of the lesson,
the teacher evaluates whether all students have achieved the lesson goal.
At the end of the lesson, I have evaluated
whether all students have achieved the lesson goal.
My teacher now knows how well I understood the lesson.
The items in Table 2 form an instrument with three versions: an observation form for an external observer, a assessment for teachers and a survey for students. The observation form and self-assessment consist of the same 12 items, only differently formulated, e.g. “The teacher has…” or “I have…”. Ten items have to be scored for each instruction group (basic, intensive and enrichment), two items are only applicable for one instruction group (‘The teacher checks students’ understanding
during the intensive instruction’). The items in the student survey are more personally formulated and include more explanation, e.g. ‘I have received the right amount of instruction to understand this lesson (so not too much and not too little)’. To be able to compare students’ ratings with those of the
teacher and observer, it is necessary to know for each student which instruction group they are assigned to.
Each item can be scored on a 4-point Likert scale (1=strongly disagree, 4=strongly agree). The advantage of a 4-point Likert scale compared to a 5-point Likert scale is that it prevents respondents from scoring a 3 every time when they are in doubt. Some items can also be scored ‘not applicable’,
e.g., when there was no extra instruction for students in the intensive group, it cannot be assessed whether the extra instruction matched the level of the students.
Two teachers and five students have given feedback on the draft versions of the instruments. Based on their comments small changes have been made in the layout of the instrument and in the formulation of the items. Appendix C, D and E show the final versions of the instrument.
4.1.3 Procedure
Participating teachers were visited during a single math lesson with an instructional phase. The teachers were asked to share the instruction groups they would use for that lesson prior to the visit, so that the observer could score a teacher’s differentiation behaviour separately for each instruction group. Most teachers did this by providing the names of the students per instruction group and indicating where these children were in the class during the visit. During the lesson, the researcher would fill in the observation form. At the end of the lesson, the teacher was asked to leave the classroom and fill in the self-assessment, while the researcher would administer the student survey with the students. The researcher has read the items from the student survey aloud to the students and explained them when necessary. The students were told to answer the questions based on the lesson they had just received.
4.1.4 Participants
22 two instruction groups; these classes did not have an enrichment group. Teachers’ differentiation
behaviour was scored for each instruction group separately, forming a total of 24 cases. Cases varied from 3 raters per case (1 observer, 1 teacher, 1 student) to 23 raters (1 observer, 1 teacher, 21 students).
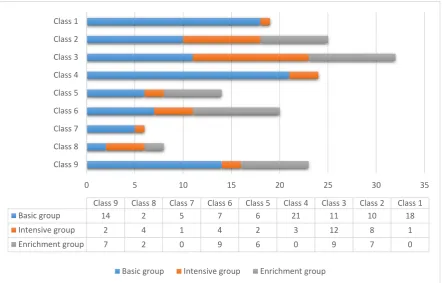
[image:23.595.75.518.188.471.2]A total of 171 students participated by filling in the student survey after their lesson. Students were between 9 and 12 years old. The most students belonged to the basic group (94). There were similar numbers of students in the intensive group (37) and enrichment group (40).
Figure 1. Number of students per class per instruction group
4.1.5 Data analysis
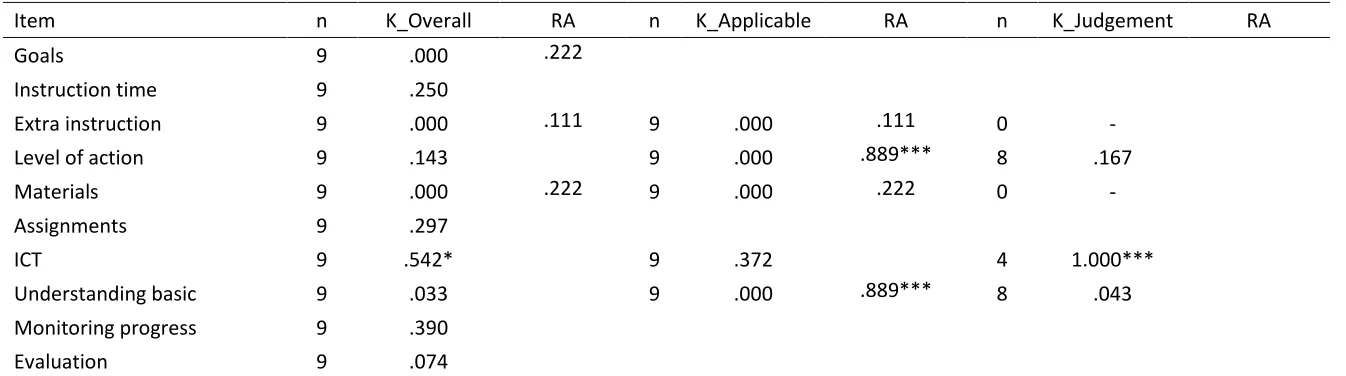
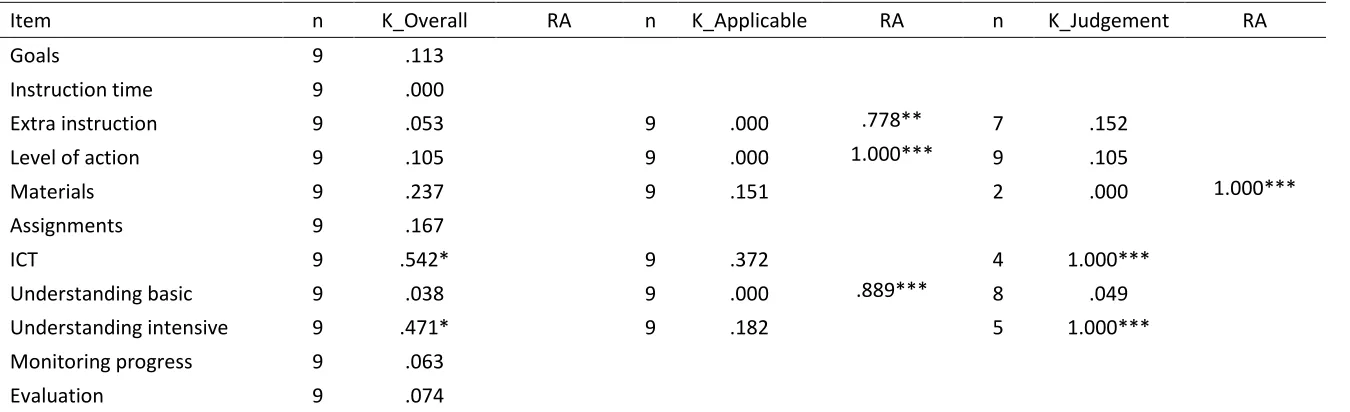
The statistical programme SPSS has been used to analyse the data. Frequency tables have been used to inspect the data, as well as mean scores. Next, Cohen’s kappa was run to determine if there was
agreement between two groups of raters on each of the items on differentiation per instruction group, taking into account the possibility of agreement occurring by chance. As kappa measures agreement between two raters, the mode of all student scores per instruction group was used. The mode is the value that occurs most often and therefore gives a good idea of what most students have scored. Kappa coefficients have a value between 0 (no agreement) and 1 (perfect agreement).
First, the kappa for all scores was calculated (K_Overall). K_Overall shows to what extent the raters agreed to give a score of 1, 2, 3, 4 or ‘not applicable’ on each item. Second, for items that could be
scored ‘not applicable’, kappa was calculated for all times raters agreed about whether the item is applicable or not (K_Applicable). Items that could not be scored ‘not applicable’ have no kappa
coefficients. Third, kappa was calculated for all applicable scores (K_Judgement). Items with only ‘not applicable’ scores are presented as ‘n = 0’ in this column.
0 5 10 15 20 25 30 35
Class 9 Class 8 Class 7 Class 6 Class 5 Class 4 Class 3 Class 2 Class 1
Class 9 Class 8 Class 7 Class 6 Class 5 Class 4 Class 3 Class 2 Class 1
Basic group 14 2 5 7 6 21 11 10 18
Intensive group 2 4 1 4 2 3 12 8 1
Enrichment group 7 2 0 9 6 0 9 7 0
23 In some cases all raters within a rater-group gave the same score to an item (e.g. the observer scored the item on extra instruction for all cases in the basic group with ‘not applicable’). SPSS considers these
variables as constant and calculates kappa as zero. However, this does not necessarily mean that there is no agreement between raters. Therefore the ‘Raw Agreement’ was calculated by dividing the
number of agreements in scores by the total (n). As with the kappa coefficients, Raw Agreement has a value between 0 (no agreement) and 1 (perfect agreement), only Raw Agreement is not adjusted for chance.
4.2 Results
4.2.1 Descriptive statistics
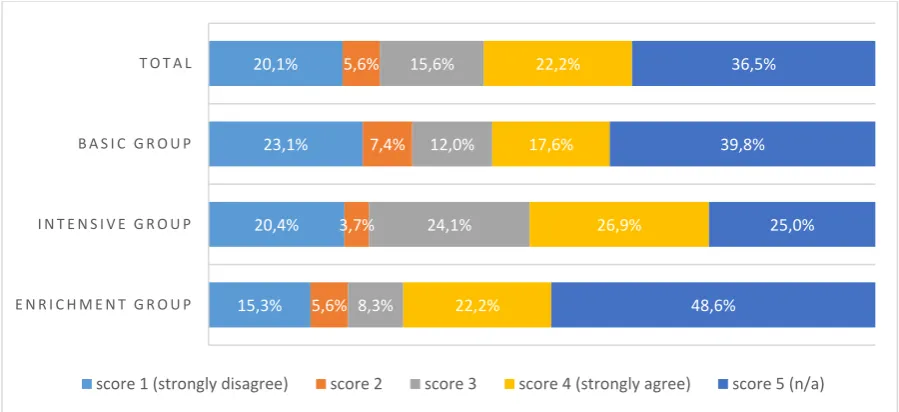
Observer [image:24.595.71.521.422.628.2]All cases were scored by the same observer. From the data in Figure 2, it is apparent that the observer scored few items with a 2 (5.6%). Scores 1 (20.1%) and 4 (22.2%) occur almost as often, followed by score 3 (15.6%). Score 5 (not applicable) is given by the observer to one third of all items (36.5%). For the enrichment group this even applies to almost half of the items (48.6%). This is lower for the intensive group, with 25.0% of the items. It seems that the observer sees more differentiation for students in the intensive group than for students in the enrichment group. Items related to the intensive and enrichment group are most often scored with a 4. Items related to the basic group most often with a 1. This could suggest that more differentiation took place for students in the intensive and enrichment group.
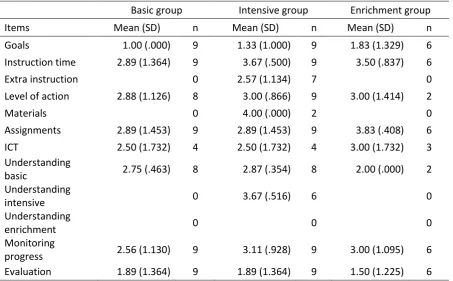
Figure 2. Frequency of scores given by observer
Table 3 shows the mean scores per question given by the observer for each instruction group. Some items could also be scored as 'not applicable'. These scores are not included in the calculation of the mean score. The table shows how many scores the mean score is based on (n). The observer judged that no extra instruction took place in the basic group and the enrichment group and no material was used (n = 0). For six cases the observer gave a score for checking understanding during the extended
15,3% 20,4%
23,1% 20,1%
5,6% 3,7%
7,4% 5,6%
8,3%
24,1% 12,0% 15,6%
22,2%
26,9% 17,6%
22,2%
48,6%
25,0% 39,8%
36,5%
E N R I C H M E N T G R O U P I N T E N S I V E G R O U P B A S I C G R O U P T O T A L
24 instruction. In all other cases for the other instruction groups, the observer has indicated that an extended or enriching instruction did not take place (n = 0).
[image:25.595.73.527.241.522.2]The mean scores on an item in the different instruction groups differ by a maximum of 0.94 from each other. This could mean that teachers differentiate for the different instruction groups to a reasonably similar extent. However, for most items the standard deviation is quite high. This suggests that there is a lot of variation between the given scores per item. The items could be scored on a 4-point Likert scale and most items have a minimum score of 1 and a maximum score of 4. This indicates that the observer has observed a great deal of variation between teacher behaviour within the same instruction group.
Table 3. Mean scores given by observer
Basic group Intensive group Enrichment group
Items Mean (SD) n Mean (SD) n Mean (SD) n
Goals 1.00 (.000) 9 1.33 (1.000) 9 1.83 (1.329) 6
Instruction time 2.89 (1.364) 9 3.67 (.500) 9 3.50 (.837) 6
Extra instruction 0 2.57 (1.134) 7 0
Level of action 2.88 (1.126) 8 3.00 (.866) 9 3.00 (1.414) 2
Materials 0 4.00 (.000) 2 0
Assignments 2.89 (1.453) 9 2.89 (1.453) 9 3.83 (.408) 6
ICT 2.50 (1.732) 4 2.50 (1.732) 4 3.00 (1.732) 3
Understanding
basic 2.75 (.463) 8 2.87 (.354) 8 2.00 (.000) 2
Understanding
intensive 0 3.67 (.516) 6 0
Understanding
enrichment 0 0 0
Monitoring
progress 2.56 (1.130) 9 3.11 (.928) 9 3.00 (1.095) 6
Evaluation 1.89 (1.364) 9 1.89 (1.364) 9 1.50 (1.225) 6
Teachers
The data in Figure 3 shows that teachers score their own differentiation least often with a 1 (12.2%) and most often with a 3 (25.7%) or 4 (23.6%). A striking exception are the scores for the enrichment group, were teachers score a third of the items with a 2 (31.9%). On average teachers score 19.4% of the items as "not applicable". This is lower for students in the intensive group (13.9%) and higher for students in the enrichment group (25.0%). This could mean that teachers differentiate more for students in the intensive group. Compared to the scores of the observer and the students, teachers score relatively little "not applicable".
Table 4 shows the mean scores per question given by the teachers for each instruction group. Some items could also be scored as 'not applicable'. These scores are not included in the calculation of the mean score. The table shows how many scores the mean score is based on (n). Most teachers have
25 instruction has been scored by the teachers only for students in the intensive group, because they were probably the only students who received this instruction).
[image:26.595.72.530.196.403.2]For most items, the standard deviation is quite high. This suggests that there is a lot of variation between the given scores per item. The items could be scored on a 4-point Likert scale and most items have a minimum score of 1 and a maximum score of 4. This indicates a great deal of variation between teacher behaviour within the same instruction group.
Figure 3. Frequency of scores given by teachers
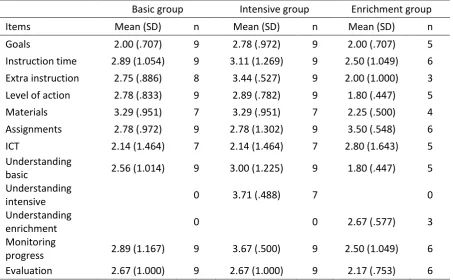
Table 4. Mean scores given by teachers
Basic group Intensive group Enrichment group
Items Mean (SD) n Mean (SD) n Mean (SD) n
Goals 2.00 (.707) 9 2.78 (.972) 9 2.00 (.707) 5
Instruction time 2.89 (1.054) 9 3.11 (1.269) 9 2.50 (1.049) 6 Extra instruction 2.75 (.886) 8 3.44 (.527) 9 2.00 (1.000) 3
Level of action 2.78 (.833) 9 2.89 (.782) 9 1.80 (.447) 5
Materials 3.29 (.951) 7 3.29 (.951) 7 2.25 (.500) 4
Assignments 2.78 (.972) 9 2.78 (1.302) 9 3.50 (.548) 6
ICT 2.14 (1.464) 7 2.14 (1.464) 7 2.80 (1.643) 5
Understanding
basic 2.56 (1.014) 9 3.00 (1.225) 9 1.80 (.447) 5
Understanding
intensive 0 3.71 (.488) 7 0
Understanding
enrichment 0 0 2.67 (.577) 3
Monitoring
progress 2.89 (1.167) 9 3.67 (.500) 9 2.50 (1.049) 6
Evaluation 2.67 (1.000) 9 2.67 (1.000) 9 2.17 (.753) 6
12,5% 11,1%
13,0% 12,2%
31,9% 11,1%
18,5% 19,1%
19,4% 26,9%
28,7% 25,7%
11,1% 37,0%
18,5% 23,6%
25,0% 13,9% 21,3%
19,4%
E N R I C H M E N T G R O U P I N T E N S I V E G R O U P B A S I C G R O U P T O T A L
[image:26.595.72.526.474.754.2]26 For some items there is a big difference between the mean scores in the different instruction groups. Teachers scored the item on ‘extra instruction’ for the intensive group on average with 3.44, while
they gave an average score of 2.00 for the enrichment group. This could suggest that teachers do give extra instruction to help below average students, but do not challenge above average students with
instruction on their level. The items ‘understanding basic’ and ‘monitoring progress’ also have a high
average score for the intensive group and a much lower average score for the enrichment group. It seems that teachers judge that they differentiate more for below average students.
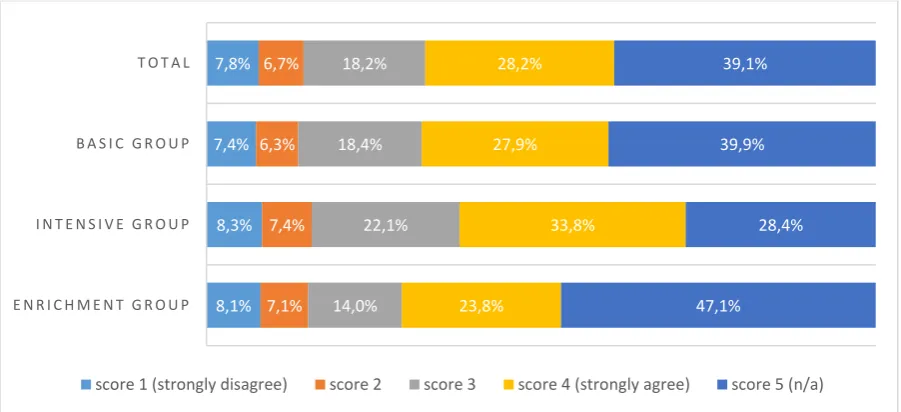
Students
[image:27.595.72.523.313.519.2]Students score few items with a 1 (7.8%) and 2 (6.7%), as can be seen in Figure 4. Most often they score items with a 4 (28.2%). This applies to students in all instruction groups. In about 40% of the items, students indicate that this does not apply to them. For students in the enrichment group this is the case for almost half of the items (47.1%). This is considerably less for students in the intensive group (28.4%). This could mean that students in the intensive group experience more differentiation than students in the enrichment group.
Figure 4. Frequency of scores given by students
Table 5 shows the mean scores per question given by the students for each instruction group. Some items could also be scored as 'not applicable'. These scores are not included in the calculation of the mean score. The table shows how many scores the mean score is based on (n). Most students have
scored all items as ‘applicable’ by giving them a score. Most students in all three instruction groups judged that there was no extra instruction and no materials were used.
Just as with the observer and teachers scores, the standard deviation for most of the mean student scores is quite high. This suggests that there is a lot of variation between the given scores per item. The items could be scored on a 4-point Likert scale and most items have a minimum score of 1 and a maximum score of 4. This indicates that students within the same instruction group experienced their teacher behaviour quite differently.
8,1% 8,3% 7,4% 7,8%
7,1% 7,4% 6,3%
6,7%
14,0% 22,1% 18,4%
18,2%
23,8%
33,8% 27,9%
28,2%
47,1% 28,4% 39,9%
39,1%
E N R I C H M E N T G R O U P I N T E N S I V E G R O U P B A S I C G R O U P T O T A L