Review Article
Development in Remote Sensing Techniques for Hydrological Studies
R P SINGH* and P K GUPTA
Land Hydrology Division, Geosciences, Hydrology, Cryosphere Sciences and Applications Group (EPSA), Space Applications Centre, ISRO, Ahmedabad 380 015, India
(Received on 19 May 2016; Accepted on 28 June 2016)
Observations and modeling of terrestrial water cycle is important for sustainable management of water resources as well as understanding the impact of climate change. Satellites provide an important role in measurements of various dimensions of water cycle components in spatio-temporal domain. Paper reviews the scientific basis and techniques of retrieval of various hydro-meteorological parameters (Rainfall, Soil Moisture, Evapo-transpiration, Groundwater, Water level, Surface Runoff, conjunctive water utilization and Water quality etc.) which are estimated using advanced satellite based instruments (Altimeter, Radar, Optical and Microwave Radiometers). Variability of various hydro-meteorological parameters and recent satellite based observation on flood and hydrological drought condition in selected regions over India isdiscussed.
Keywords: Remote Sensing; Hydrology; Water Resources; Water Balance; Soil Moisture; Evapotranspiration; Synthetic Aperture Radar; Altimeter
*Author for Correspondence: E-mail: [email protected]
Proc Indian Natn Sci Acad 82 No. 3 July Spl Issue 2016 pp. 773-786
Printed in India. DOI: 10.16943/ptinsa/2016/48484
Introduction
Water is important for the habitability on the Earth and existence of life. The average annual rainfall including snowfall in India is 4000 Billion Cubic Meters (Kumar et al., 2005) but availability of per capita fresh water is major concern as the population continue to increase in future (Mall et al., 2006). Water security and management requires information ranging from regular inventory of surface water bodies (Panigrahy
et al., 2012) to assessment of rainfall, soil moisture,
evapotranspiration, ground water and snow melt runoff (Rao et al., 2013). Hydrological drought and flood forecast during extreme weather events become important for planning and water resource management.
Modeling different components of water cycle requires measurement of water which can exist in all the three phases of matter i.e. solid, liquid and gas (Green et al., 2006). Satellite provides an important platform from where measurements can be done in any part of electromagnetic spectrum suitable to detect different phases of water over a large region not feasible through sparse network of surface-based
instruments. Instruments on Earth Observation systems have been extensively used to measure hydrologic and hydraulic variables such as water spread area, elevation of water surface and temporal changes (Douglas et al., 2007). Seasonal monitoring of reservoir spread, conjunctive water uses and water management practices associated with transplanting operations helps in irrigation scheduling (Douglas et
al., 2007; Gupta et al., 2009). Satellite observations
are regularly used to generate snow cover map which help in snow melt runoff estimation (Jain et al., 2010). Satellite data has been used to study the changes in the extent of Himalayan glaciers inventory and their monitoring in terms of whether they are retreating or being stable over the time is another important contribution of space technology towards understanding the climate change signals (Bahuguna
et al., 2014). To provide safe drinking water to
generated under the project titled “Rajiv Gandhi National Drinking Water Mission”. Remote sensing
data along with Geospatial technology have helped planning of water resources by the respective water management boards.
Hydrological remote sensing is carried out using measurements from various Indian satellite platforms such as SARAL-Altika Mission (Gairola et al., 2015) (Inland Water level), RISAT-1 SAR Mission (Misra
et al., 2013) (Surface water spread, Soil Moisture),
Resourcesat-1/2 Missions (Pandya et al., 2007) (Snow cover, Wetlands, Land use Land cover, Water quality), Cartosat Missions (DEM), Kalpana, Megha Tropiques and INSAT-3D Missions (Rainfall, Solar Radiation etc.) (Navalgund and Singh et al., 2010). Global Missions such as Landsat Program, Sentinel Program, Jason program, SRTM/ASTER topography missions, MODIS instruments on Earth Observation Terra and Aqua Missions, GRACE Mission (Swenson
et al., 2008), Soil Moisture and Ocean Salinity (SMOS)
(Kerr et al., 2001) Mission, Soil Moisture Active Passive (SMAP) (Entekhabi et al., 2010) Mission and Tropical Rainfall Measuring Mission (TRMM) etc also provide valuable datasets to model the water fluxes over India. Scientific rationale of estimation of various hydrological parameters using satellite data is discussed in following sections.
Physical Basis for Remote Sensing of Water Resources
Remote sensing generally refers to the technology of observations of earth using sensors placed on aircraft or satellites platforms. These sensors employ active as well passive sensing system. Active systems have their own source of illumination (Radar, Scatterometer, Altimeter) whereas passive systems sense natural radiations, either reflected or emitted from the earth. In active remote sensing, generally instruments (Radar, Scatterometer) measure back scattered signals from target however Altimeters use the time delay in propagation of the incident signal to infer the topography (elevation, water level) of the surface. Short pulse of electromagnetic wave is transmitted and received by Radar from space platform and range between the satellite and earth surface is measured by precise orbit computation and correcting atmospheric and geophysical signals.
In the active microwave remote sensing,
information about the object’s physical structure and
electrical property is retrieved by analyzing the backscattering signal. The electromagnetic radiation is used as an information carrier in remote sensing. Instruments operate in optical (Cameras, Spectro-radiometer), infrared (Thermal radiometers) and microwave (Radar, Altimeter, Scatterometer etc.) wavelength ranges. Microwave remote sensing
provides the observations of earth‘s hydrological cycle
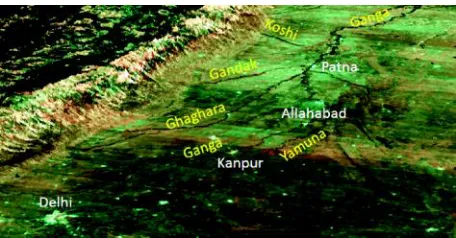
regardless of day/night and atmospheric conditions. Water being a polar molecule has very high sensitivity in microwave wavelengths due to orientation polarization property. The microwave signature of the object is governed by sensor parameters (frequency, polarization, incidence angle) and physical (surface roughness, feature orientation) and electrical (dielectric constant) property of the target (Srivastava et al., 2009). The surface water extent is detectable on radar backscatter image due to high contrast between smooth water and rough land surface (Figs. 1 and 2). Radar operated in interferometry mode helps in mapping the surface topography. Radar interferometry works on the principle that the position
of a point on the Earth’s surface can be reconstructed
from the phase difference (interferogram) between two complex-valued SAR images achieved by coherently processing the backscattered signals (phase) recorded by the two antennas. Shuttle Radar Terrain Mapper (SRTM) used interferometric technique to derive global digital elevation model (DEM). DEM information when coupled with other
[image:2.612.318.546.522.641.2]Developments in Remote Sensing Techniques for Hydrological Studies 775
remote sensing data and terrain models provide valuable inputs in hydrology.
A Passive sensor consists of only a receiver. Emitted radiation from manmade or natural targets is received and processed by the radiometer to infer the target properties.Any object above absolute zero temperature emits electromagnetic radiation. Thus the objects we see around, including ourselves are thermal radiators. An ideal substance is called blackbody which absorbs the entire radiant energy incident on it and emits radiant energy at the maximum possible rate per unit area at each wavelength for any given temperature. The spectral radiance (M) being emitted by a blackbody at given and
Temperature T is given by Planck’s Radiation Law.
2
5
2 hc M
[exp(hc/ kT) 1]
where k is Boltzmann’s constant, h is Planck’s
constant, c is velocity of light, and T is the absolute temperature in Kelvin. At microwave frequencies,
Planck’s equation gets approximated to Raleigh-Jeans
law as
4
2 ck T
M
where k is Boltzmann’s constant, is emissivity of the body at absolute temperature T and wavelength
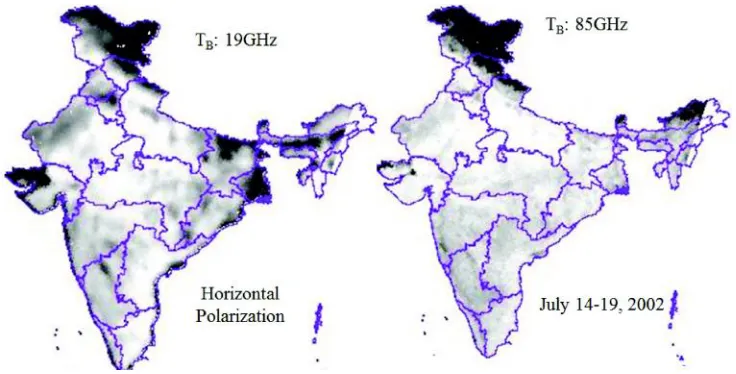
[image:3.612.66.547.78.373.2]preferred due to high penetration depth and higher sensitivity to soil moisture conditions. Low frequencies are limited by coarse spatial resolution of microwave radiometers. Synthetic aperture Radiometry concept (SMOS) or merging of Active Radar and Passive Radiometer (SMAP) technique are used to improve the spatial resolution (smaller foot-print). Passive microwave techniques have been extensively used to study the variability of soil moisture (Oza et al., 2006). Indian satellite missions such as Bhaskara-1/2, IRS-P4 Oceansat-1 and Megha Tropique have carried passive microwave radiometers, SAMIR, MSMR and MADRAS respectively. Hirpa et al. (2013) used concept of satellite derived flow signal (SDF) using passive microwave technique for river discharge estimation and forecasting. It uses the concept of ratio of brightness temperature of nearby land pixels (outside of the reach of the river) to brightness temperature of center of the river pixel in assessment of SDF.
Remote sensing in thermal infrared region of electromagnetic spectrum helps in retrieval of land
surface temperature (LST) which governs Earth’s
surface water budget and is commonly required in many hydrological applications (Norman and Becker, 1995; Li and Becker, 1993; Pandya et al., 2014). Various Indian National SATellite (INSAT-1A, 1B, 1C, 1D, 2A, 2B, 2E, 3A, Kalpana-1, 3D) systems on geostationary platforms have carried Very High Resolution Radiometer (VHRR) payload with a
thermal infrared (TIR: 10.5-12.5 um) channel for more than two decades. Currently Kalpana-1, INSAT-2E and INSAT-3D are operationally providing data every 30 minutes (Fig. 4).
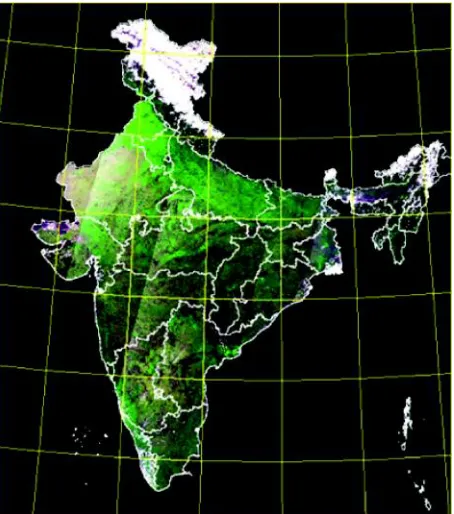
Information collected by satellite based multi spectral sensors in visible part of electromagnetic spectrum allows discrimination of different land cover types and their biophysical properties (NDVI, Leaf area index etc.). Distinct spectral signatures in Blue, Green, Red, Near Infrared and Mid Infrared spectral channels, help in estimating the changes in snow cover and information on Glacier status. Information on water quality in terms of turbidity, chlorophyll and total suspended sediments (TSS) can be derived by analysis of spectral signature of water in different bands (Dekker and Peters, 1993). Clear water generally absorbs higher wavelength (Red, NIR) in comparison to low wavelength (Blue and Green) region. Increase in turbidity increases reflectance characteristics more in higher wavelength region (Moore, 1980). Figure 5 shows the colour composite of India through mosaic of observation from Resoucesat-2 AWIFS sensor. It distinctly shows how different land cover types can be assessed using optical data.
Retrieval and Modeling of Hydro-Meteorological Parameters
[image:4.612.121.489.82.269.2]Developments in Remote Sensing Techniques for Hydrological Studies 777
for retrieval of different hydro-meteorological variables and assimilate these input in different process based hydrological models for specific applications. The land water balance accounts for over all change of water storage (S) which is difference between incoming amount of precipitation (P) and amount of water loss in the form of ET and Runoff (R) with respect to time (Khan, 2016).
S = P –ET –R
The process can also be described in energy balance term as
Rn –G = H + LE
Where Rn is the net radiation, G is the soil heat flux, H is the sensible heat flux and LE is the latent heat flux. The quantity Rn-G is known as available energy. ET and LE represent the same water vapour exchange rate in surface atmosphere interface. Brief
account of approaches for retrieval of different hydro-meteorological parameters and their variability over India is discussed in following sections.
Precipitation
Information on precipitation is most important in any hydrological applications. There are broadly three techniques by which rainfall can be estimated using satellite data (Upadhyaya and Ramsankaran, 2013). First the Cloud top temperature based technique using Visible and Infrared Observations. Second Microwave technique using active radar or Passive Brightness Temperature measurement and third is blended technique. The blended technique uses both optical observations from Geostationary platform as well as Microwave technique along with available network rainfall data from field measurements. Prakash et al. (2010) have estimated rainfall using Kalpana-1 VHRR and TRMM- data over India. In Fig. 4: Land surface temperature (LST) derived from the Kalpana-1 VHRR data for 23 January 2010. (Source: M.R. Pandya
[image:5.612.67.549.78.428.2]the first approach cloud top temperature brightness temperature in thermal Infrared spectrum observed from Geostationary satellite are correlated with surface
rain rate observations (Arkin and Meisner, 1987). This technique is based on the fact that heavier rainfall is associated with cold cloud top and generally seen as thick cloud in visible imagery.
Microwave technique of rainfall estimation depend on concept that rain droplets lead to increase in microwave emission over the low background emission water surface (ocean) in low frequencies (20 GHz) (Varma and Pal, 2012). Such principle does not apply over the land surface which has higher background emission. High frequencies (> 35 GHz) of Microwave is used to estimate rainfall over land as scattering caused by precipitating ice particles leads to a decrease in MW radiation in comparison to high background signal. Hence depending on the situation passive microwave technique is divided into emission type algorithm and scattering type algorithms. Precipitation Radar (PR) onboard TRMM satellite uses active microwave technique to estimate the rainfall rate using backscattering of radar signal from rain droplets. Global Precipitation Measurements (GPM) is an international initiative as a follow up of TRMM for monitoring of rainfall. Figure 6 (A) shows the rainfall variability over India using dual frequency precipitation radar and GPM microwave imager data. INSAT-3D satellite provides regular rainfall estimate over Asian region using Hydro estimator and Multi spectral techniques (Pal et al., 2013).
Soil Moisture
Soil moisture influences meteorological and climatic
Fig. 6: (A) Rainfall, (B) Evapotranspiration and (C) Soil Moisture variability over India during 2014. Rainfall product is estimated from dual frequency precipitation radar and GPM microwave Imager data, AET is estimated using MODIS data and Soil Moisture is estimated using AMSR-2 observations
[image:6.612.68.295.83.340.2] [image:6.612.68.545.526.701.2]Developments in Remote Sensing Techniques for Hydrological Studies 779
processes as it is an important component in land water balance. Soil moisture can be detected from visible, thermal infrared as well microwave techniques. Visible technique depends on lowering of surface albedo when the soil is moist in comparison to dry soil. Soil moisture assessment using thermal infrared technique depends on lowering of land surface temperature in moist situation. Apparent thermal inertia assessment using albedo and change in land surface temperature during diurnal cycle helps in delineating region with varying soil moisture conditions. Property of High thermal inertia of water helps in assessment of varying soil moisture condition. Although Optical techniques have been used in estimation of soil moisture but suffer from low sensitivity of detection as compared to microwave technique. Both active and passive microwave techniques are used to estimate soil moisture (Das and Paul, 2015). The scientific rationale of the microwave applications in estimation of soil moisture lies in the strong dependence of radar backscatter on dielectric constant of soil. The dielectric constant of water at microwave frequencies is about 80 while dry soil is about 3. The moisture content in soil is linearly related with backscattering coefficient obtained by SAR Imaging. Observations in passive remote sensing shows lower brightness temperature in high soil moist condition as compared to dry soil condition Singh et al., 2005; Schmugge et al., 2002; Jackson et al., 1982; Njoku and Kong, 1977; Wang and Schmugge, 1979). Currently the Advanced Microwave Scanning Radiometer-Earth observing system (AMSR-E since 2002) Soil moisture and ocean salinity satellite (SMOS since 2009), and Soil Moisture Active Passive (SMAP since 2015) are operational satellite system which are providing satellite global data. The Fig. 6(C) shows the variability of soil moisture using AMSR-2 observations over India during 2014.
Evapotranspiration
Observations on Evapotranspiration (ET) is important for water management for planning and adjusting distribution of water. ET provides a measure of water loss from land to the atmosphere over space and time and varies significantly due to local controlling factors. ET can be estimated using weather data driven approaches, soil moisture measurements, and surface energy (Bastiaanssen et al., 1995) balance methods but they require a substantial amount of input data
relating to soil, vegetation and climate conditions. Satellites based methods (Meijerink, 2002) help in regional modeling ET fluxes. The Fig. 6(B) shows the variability of ET over India during 2014 using MODIS data. Satellite based ET estimation method depends on remote sensing based information of landcover, land surface temperature, albedo, vegetation indices/Leaf Area Index and emissivity. The approaches of ET estimation can be categorized as (1) Emperical approach, (2) Classical Penman-Monteith approach integrated with remote sensing and (3) Surface energy balance method. MODIS data provides the ET products as well all other biophysical variable related with ET such as Albedo, land surface temperature, vegetation Index and Leaf area Index. These data are available from Land Processes Distributed Active Archive Centre at USGS Earth Resources Observation and Science Centre.
Ground Water
Providing safe drinking water to hundred thousands of villages which lie in drought prone areas is an important requirement related with water security. The remote sensing data along with ground survey information provides information on the geology, geomorphology, structural pattern and recharge conditions which ultimately define the groundwater regime Groundwater distribution is subject to wide spatio-temporal variations depending on the underlying rock formations, their structural fabric and geometry, surface expression. Ground water rechargeable areas are those which have porous lithologies, maximum fractures, highly weathered region and associated flood plains. Satellite data along with field survey knowledge have been used to generate Ground water prospect maps showing probable regions under Rajeev Gandhi National Drinking Water Mission. These maps show yield range at different depths besides indicating sites for recharging aquifers and water harvesting structures.
Tracking the Low Earth Observation satellites
and their orbital dynamics helps to define the earth’s
Mission provide combined indirect and direct effect of all mass redistributions and mass variability within the Earth and its fluid envelops. GRACE observations provides changes in vertically integrated stored water, which includes variations from snow pack, glaciated areas, surface water, soil moisture, and ground water at different depths (Longuvergne et al., 2010).
Analysis of multiyear observations from GRACE mission have provided important information related with depleting ground water in various pockets of earth including parts of northern India (Tiwari et al., 2009). Agrawal et al. (2014) has observed decreasing trend in water equivalent height (WEH) in Ganga and Brahmaputra basins.
Surface Water Level
Water level is an important hydrological quantity required to budget the fresh water availability. Satellite altimetry is active remote sensing technique for systematic monitoring of water levels of reservoirs, lakes and rivers. Satellite altimetry technique was originally started for assessment of ocean topography but recent instruments on JASON, SARAL Altika, Jason-3, Sentinel-3 and future missions such as Surface Water and Ocean Topography (SWOT) mission are designed to study the inland water bodies also.
Radars onboard satellite emit pulses towards nadir and receive the echo by water surface. The half time span for pulse reflected back to mission corresponds to distance () between satellite and earth surface. The height H of the reflecting water body with reference to geodetic reference is given as
H = as – + Ciono + Cdry + Cwst + Cst + Cpt
Where as is the satellite altitude with reference to reference ellipsoid. Other terms reference to corrections related with delayed propagation through the atmosphere (Cdry and Cwet), the interaction with ionosphere (Ciono) and solid earth tides (Cstand Cpt ).
Radar altimeter onboard ISRO/CNES SARAL -AltiKa mission provides important information of water level for rivers and large reservoirs at 35-day repeat interval (Gupta et al., 2105; Dubey et al., 2015; Papa et al., 2012). Observations of water level in Ukai Reservoir from 2013 to 2016 show lowest water level condition in 2016 indicating hydrological drought
situation (Fig. 7). Analysis showed that amount of water volume availability was found to be less by19.8% in the current year (April 2016) as compared to last year (April2015) whereas it is 88.5% less in comparison to 2014 for the same time frame over the Ukai Reservoir. A flood wave of 5.93 m, was estimated during two passes (4th May to 9th June 2015) of
SARAL-Altika over Brahmaputra river. This is the highest water level measured in this location since inception of SARAL-Altika (Feb 2013).
Satellite altimetry (Dubey et al., 2014) has been used to study the river stage and its discharge using rating curve relationship. Papa et al. (2010) estimated monthly discharges from Ganga and Brahmaputra rivers using TOPEX-Poseidon (T/P), ERS-2 and ENVISAT satellite altimetry data. Biancamaria et al. [50] also studied water levels at upstream locations in India using T/P altimetry data to forecast the water levels of Ganges and Brahmaputra rivers. Frappart
et al. (2005) have determined spatio temporal
variations of water volume in Negro River basin using area variations from SAR data and changes in water level from T/P altimetry data. Satellite altimetry also allows to model flood water propagation when combined with other satellite data and hydrological model. Fig. 8 shows the modeling of flooded area in North Gujarat, India in July 2015.
Surface Runoff
Runoff is an integrated effect of rainfall, topography, soil and land cover conditions. Runoff is modelled by combined use of satellite derived parameters such as Fig. 7: Water Level Retrieval using Satellite Altimetry over
[image:8.612.318.543.82.249.2]Developments in Remote Sensing Techniques for Hydrological Studies 781
precipitation, topography, LULC and land surface characteristics using simple rainfall-runoff simulation approach; Natural Resources Conservation Service (NRCS) runoff curve number (CN) method. Using antecedent moisture conditions, time-varying NRCS-CN values are determined. River water levels estimated using altimeter data (SARAL-ALTIKA, Jason-2) are used for the validation of the model results. Information on spatial and temporal variations of runoff is important in understanding the surface water on regional scale. Study has been carried out to model (Gupta et al., 2016) the surface runoff with integration of remote sensing derived parameters during monsoon period (May to October) of 1971-2005. Conceptual modified curve number model was used for the determination of rainfall and runoff trends (Fig. 9). It was found that runoff amount ranged from 527.3 mm to 256.4 mm, highest being in the year 2005, which accounted for the 40.3 % of the mean rainfall
in that year and the lowest being in the year 1972, which accounted for 32.3% of the mean rainfall in the respective year.A significant increasing trend was observed in 12 medium river basins (13.6 mm/yr observed in Kameng basin) and a decreasing trend in 9 other basins (-21.4 mm/yr observed in upper Tista basin).
Conjunctive Water Uses
Improving the water use efficiency in irrigated systems integrating satellite inputs is the thrust area of research. Hence, conjunctive use of water from different sources i.e., precipitation, canal water, ground water, surface water etc., is gaining attention. Thankabail et al. (2005) used near continuous time series remote sensing moderate resolution imaging spectrometer (MODIS) data to map the irrigated areas of the Indo-Gangetic region. Global irrigation mapping effort was undertaken by Siebert et al. Fig. 8: Flood inundation in North Gujarat, India during 25-29 July 2015 using satellite derived rainfall, DEM, LULC, soil
[image:9.612.76.545.93.431.2](2005). Multi-date high temporal IRS-1D data have been used to identify the various sources of irrigation such as surface water, groundwater, wetland etc. by analyzing the space time spectral curves over the Damodar command area in West Bengal (Gupta et
al., 2009) (Fig. 10).
Inland Water Quality
Information contained in remote sensing imagery is used to accurately quantify water quality constituents. Water quality refers to water property in terms of physical, chemical and biological characteristics. Pollutants in water surface changes the spectral
signature of surface water. Remote sensing of water quality basically aims to measure these changes in spectral characteristics and relate these measurements with water quality parameters empirically or analytically (Fig. 11).
Major factor affecting water quality in land water bodies are suspended sediments (turbidity), algae (i.e., chlorophyll), chemicals (nutrients, pesticides, metals), dissolved organic matter (DOM).
According to Richie et al. (2003), the general form of empirical equations (Schmugge et al., 2002) is
Y = A + BX or Y = ABX
Where Y is remote sensing measurements
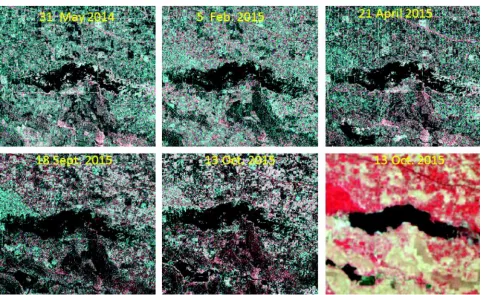
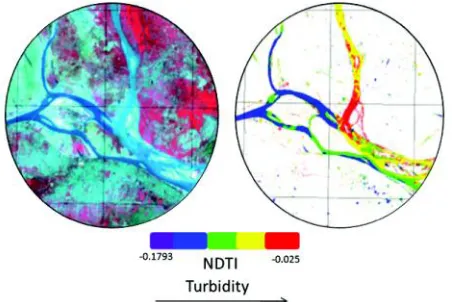
Fig. 11: Different turbidity levels observed from Landsat-8 OLI data in Ganga River near Patna, Bihar, India during 23 Oct. 2015
Fig. 9: Curve number method based (A) Average runoff and (B) runoff coefficient over India estimated for the period of 1971-2005
Fig. 10: Conjunctive water use pattern (GW: groundwater, CW: canal water) in Damodar command area
[image:10.612.73.546.81.265.2] [image:10.612.67.291.512.707.2] [image:10.612.320.546.545.696.2]Developments in Remote Sensing Techniques for Hydrological Studies 783
(Radiance, Reflectance or ratio) and X is water quality parameters (suspended sediments, chlorophyll etc.) A and B are empirically derived factors. Suspended sediments increases the radiance emergent from water surface invisible and Near Infrared spectrum. Hyperspectral spectrometer with Narrow spectral channels are preferred for estimating the water quality parameters. Water quality measurements are important for addressing the issues of Ganga like rivers which are polluting with increasing population. There is need to further develop hyperspectral missions with high spectral and spatial resolution to quantify various water quality parameters.
Drought and Flood
Remote sensing techniques have been very useful in dealing with the natural disasters like droughts and floods which affect crop productivity, water availability and economy. Rain is a major causative factor in both the cases. Accurate and timely information on conditions of drought or floods helps in better planning in terms of preparedness, prevention and relief work. Early warning signals from satellite during drought in terms of depleting water levels in reservoir (using altimeter data) and prevailing low soil moisture conditions (using passive microwave radiometer data) over a large region help in mitigation activities. Monitoring of crop growth (using NDVI data) and surface temperature (using thermal infrared sensing data) provides information on water stress and evapotranspiration fluxes. National Agricultural Drought Assessment and Monitoring System (NADAMS) provides valuable satellite based information in operational management of droughts in India.
Flood is a devastating hazard which affects mankind. Heavy rain, snowmelt, dam failures cause floods. Non availability of optical data due to cloud cover over flood affected region is a major challenge in flood management. Observations from SAR help in monitoring the flood affected region (Fig. 12). Hydrological models are used to forecast the flood inundation. Satellite data helps in monitoring the intensity and movement of a precipitating system. Rainfall, DEM, prevailing surface wetness condition, water level heights and land use-land cover derived from satellite data provide important inputs in modeling and forecasting the flood.
Conclusions and Future Directions
[image:11.612.317.546.82.403.2]in improvements in observational capability in future.
Present trend in remote sensing of hydrology is to develop improved methodologies for retrieval of various hydro-meteorological parameters from satellite data and assimilate the information in physically based distributed hydrological models. Integrating remote sensing derived inputs such as DEM, rainfall, crop growth parameters (Leaf area index), land use land cover, wetlands, soil moisture, snow cover area, vegetation indices, river network, cross sections, river water level fluctuations, insolation, Albedo etc. into semi-distributed and distributed hydrological models is a challenge. As volume of input data and computational requirements are enormous, use of these models has not yet reached the operational status in many developing countries. Future need in water management is to develop and assess the use of remote sensing methodologies, in combination with in situ data and hydrological models.
In future, there are requirements to improve the assessment of water level, soil moisture, Rainfall and evapotranspiration. Present capability of repetivity (10-35 days) for water level retrieval needs to be improved to daily. Availability of soil moisture need to be improved to 1 km with capability of soil moisture profiling. It is required to have LIDAR measurements for river bathymetry and submeter level DEM with high vertical accuracy for flood inundation studies. Present capability to measure rainfall need to be improved to 1km spatial resolution. Hydrological modeling need simultaneous measurement of LST, NDVI, Albedo and soil moisture to know ET at high spatial resolution. An integrated satellite system dedicated for Hydrological application is needed with simultaneous measurements from wide SAR, Nadir
Altimeter, Passive Radiometer with active Rain Radar.
Archival and dissemination of remotely sensed data and scientific products are important dimensions of earth observation system. To ensure the utilization of Indian earth observation data and hydrological products, web based data archival and visualization systems are available on following major Geo Platforms of Indian Space Research Organization:
(1) Visualization of Earth Observation Data and Archival System (http://vedas.sac.gov.in)
(2) Meteorological and Oceanographic Satellite Data Archival Centre (http://mosdac.gov.in)
(3) Bhuvan (http://bhuvan.nrsc.gov.in)
(4) India Water Resources Information System (http://www.india-wris.nrsc.gov.in)
These web portals provide information related to various hydrological products including rainfall, surface soil moisture, surface runoff, evapotranspiration, wetlands, River basin, snow and glaciers, inland water height of selected rivers / reservoirs and weather forecast.
Acknowledgments
The authors are grateful to Shri Tapan Misra, Director, Space Applications Centre for his support and guidance to carry out hydrological studies. The encouragements from Dr. Rajkumar, Group Director GHCAG and Dr. B.S. Gohil, Deputy Director, EPSA are thankfully acknowledged. Authors are grateful to Dr. Mehul R Pandya, Shri V M Ramanujam, Shri C Patnaik and scientists of Land Hydrology Division for their inputs and constructive discussions.
References
Agrawal R, Singh S K, Rajawat A S and Ajai (2014) Estimation of regional mass anomalies from gravity recovery and climate experiment (GRACE) over Himalayan region ISPRS Symposium Dec. 2014, Hyderabad
Arkin P A and Meisner B N (1987) The relationship between large scale convective rainfall and cold cloud cover over the western hemisphere during 1982-84 Monthly Weather
Reviews 115 51-74
Bahuguna I M, Rathore B P, Brahmbhatt R, Sharma M, Dhar S,
Randhawa S S, Kumar K, Romshoo S, Shah R D, Ganjoo R K and Ajai (2014) Are the Himalayan glaciers retreating?
Current Science 106 1008-1013
Bastiaanssen W G M, Menenti M, Feddes R A and Holtslag A A A M (1995) A remote sensing surface energy balance algorithm for land (SEBAL): Formulation Journal of
Hydrology 212-213 198-212
Biancamaria S, Hossain F and Lettenmajor D (2011) Forecasting transboundary flood with satellite Geophysical Research
Developments in Remote Sensing Techniques for Hydrological Studies 785
Das K and Paul P K (2015) Present status of soil moisture estimation by microwave remote sensing Cogent
Geoscience 1-21
Dekker A G and Peters S W M (1993) The use of the Thematic Mapper for the analysis of eutophic lake: A Case study in the Netherlands International Journal of Remote Sensin
14 799-821
Douglas E A, Rodriguez E and Lettenmaier D P (2007) Measuring surface water from Space Reviews of Geophysics 45 1-24
Dubey A K, Gupta P K, Dutta S and Kumar B (2014) Evaluation of Satellite altimetry derived river stage variation for the braided Brahmaputra river International Journal of Remote
Sensing 23 7815-7827
Dubey A K, Gupta P K, Dutta S and Singh R P (2015) Water level retrieval using SARAL/Altika observations in braided Brahmaputra river Marine Geodesy 38 549-567
Entekhabi D, Njoku E G, ONeill P E, Kellogg K H, Crow W T, Edelstein W N, Entin J K, Goodman S D, Jakson T J, Johson J, Kimball J, Piepmeier J R, Koster R D, Martin N, McDonald K C, Moghaddam M, Moran S, Reichle R, Shi J C and Team (2010) The Soil Moisture Active Passive (SMAP) Mission Proc of IEEE 98 704-716
Frappart F, Seyler F, Martinez J M, Leon J G and Cazenave A (2005) Flood Plain water storage in the Negro river basin estimated from Microwave Remote Sensing of inundation area and water levels Remote Sensing of Environment 99 387-399
Gairola R M (2015) SARTAL/ALTIKA Science and Applications: Summary of Achievements NNRMS (B) Bulletin 39 1-11
Green R O, Painter T H, Roberts D A and Dozier J (2006) Measuring the expressed abundance of the three phases of water with an imaging spectrometer over melting snow
Water Resources 42
Gupta P K, Chauhan S and Oza M P (2016) Modelling Surface Runoff and Trends Analysis over India Journal of Earth
System Science (Accepted)
Gupta P K, Dubey A K, Goswami N, Singh R P and Chauhan P (2105) Use of Saral/Altika observations for modeling river flow Marine Geodesy 38 614-625
Gupta P K, Dutta S and Panigrahy S (2009) Mapping of Conjunctive Water use Productivity Pattern in an Irrigation Command using Temporal IRS WiFS Data Journal of Water
Resources Management 24 157-171
Gupta P K, Oza S R and Panigrahy S (2010) Monitoring Transplanting Operation of Rice crop using Passive Microwave Radiometer Data International Journal of
Bio-Systems Engineering 108 28-35
Hirpa F A, Hopson T M, Grorve T D, Brakenridge G R, Gebremichael M and Restrepo P J (2013) Upstream satellite remote sensing for river discharge forecasting: Applications to major rivers in South Asia Remote Sensing
of Environment 131 140-151
Jackson T J, Schmugge T J and Wang J R (1982) Passive remote sensing of soil moisture under vegetation canopies Water
Resources Res 18 1137-1142
Jain S K, Goswami A and Saraf A K (2010) Snow melt runoff modelling in Himalyan basin with aid of satellite data
International Journal of Remote Sensing 31 6603-6618
Jaiswal R K, Mukherjee S, Krishnamurthy J and Saxena R (2003) Role of Remote sensing and GIS techniques for generation of ground water prospect zones towards rural development-An Approach International Journal of Remote Sensing 24 993-1008
Kerr J H, Waldteufel P, Wigneron J P, Partinuzzi J H, Font J and Berger M (2001) Soil Moisture Retrieval from Space: The Soil Moisture and Ocean Salinity (SMOS) Mission IEEE
Transactions on Geosciences and Remote Sensing, 39 2001)
1729-1735
Khan S I, Chang N B, Hong Y, Xue X and Zhang Y (2016) Remote Sensing Technology for Multi scale Hydrological Studies: Advances and Perspective Remote Sensing
Handbook CRC Press 3-21
Kumar R, Singh R D and Singh K D (2005) Water Resources of India Current Science 89 794-811
Li Z I and Becker F (1993) Feasibility of land surface temperature and emissivity Remote Sensing of Environment 43 67-85
Longuvergne L, Scanlon B R and Wilson C R (2010) GRACE: Hydrological estimates for small basins: Evaluating processing approaches on the high plains acquifer, USA
Water Resource Research 46 W11517
Mall R K, Gupta A, Singh R, Singh R S and Rathor L S (2006) Water resources and climate change: An Indian perspective
Current Science 90 1610-1626
Meijerink A (2002) Satellite Ecohydrology- A Review Tropical
Ecology 43 91-106
Misra T, Rana S S, Desai N M, Dave D B, Rajeev Jyoti, Arora R K , Rao C V N, Bakori B V, Neelakantan R and Vachchani J G (2013) Synthetic Aperure Radar payload on board RISAT-1: Configuration, Technology and Performance
Current Science 104 446-461
Moore G (1980) Satellite Remote Sensing of Water quality
Hydrological Sciences- Bulletin-es Sciences Hydrolifiques 25 407-421
observation system in India J Ind. Institute of Science 90
Njoku E G and Kong J (1977) Theory of passive microwave remote sensing of near surface soil moisture J Geophys
Res 82 3108-3118
Norman J M and Becker F (1995) Terminology in thermal infrared remote sensing of Natural Surfaces Remote Sensing Reviews
12 159-173
Oza S R, Singh R P, Dadhwal V K and Desai P S (2006) Large area soil moisture estimation using spaceborne multi frequency passive microwave data, Journal of Indian Society of Remote
Sensing 34 343-350
Pal P K, Varma A K and Gairola R M (2013) Rainfall estimation using satellite data NNRMS Bulletin 38 11-12
Pandya M R, Shah D B, Trivedi H J, Darji N P, Ramakrishnan R, Panigrahy S, Parihar J S, Kirankumar A S (2014) Retrieval of land surface temperature from the Kalpana-1 VHRR data using a single-channel algorithm and its validation over western India, ISPRS Journal of Photogrammetry
and Remote Sensing 94 160-168
Pandya M R, Singh R P, Chaudhari K N, Murali K R, Kirankumar A S, Dadhwal V K and Parihar J S (2007) Spectral characteristics of sensors onboard IRS-1D and P6 satellites: Estimation and their influence on surface reflectance and NDVI Journal of Indian Society of Remote Sensing 35 341-358
Panigrahy S, Murthy T V R, Patel J G and Singh T S (2012) Wetlands of India: Inventory and assessment at 1:50000 scale using geospatial techniques Current Science 102 852-856
Papa F, Bala S K, Pandey R K, Durand F, Gopalkrishna V V, Rahman A and Rossow W B (2012) Ganga- Brahmaputra river discharge from Jason-2 radar altimetry: An update to the long term satellite derived estimation of continental fresh water forcing flux into Bay of Bengal Journal of
Geophys Res C11021
Papa F, Durand F, Rossow W B, Rahman A and Bala S K (2010) Satellite altimeterderived monthly discharge of Ganga-Brahmaputra river and its seasonal to interannual variations from 1993 to 2008 Journal of Geophysical Research 115 C12013
Prakash S, Mahesh C, Gairola R M and Pal P K (2010) Estimation of Indian Summer Rainfall using Kalpana-1 VHRR data and its validation using rain guage and CPCP data Meteorol
Atmos Phys 110 45-57
Rao V V, Sharma J R and Dadhwal V K (2013) Water Resources of India- Critical Issues and Satellite technology Options
NNRMS Bulletin 38 1-9
Richie J C, Zimba P V and Everitt J H (2003) Remote Sensing Techniques to assess water qualities Photogrammetric
Engineering and Remote Sensing 69 695-704
Schmugge T J, Kustas W P, Ritchie J C, Jackson T J and Rango A (2002) Remote Sensing in Hydrology Advances in Water
Resources 25 1367-1385
Siebert S, Döll P, Hoogeveen J, Faures J M, Frenken K and Feick S (2005) evelopment and validation of the global map of irrigation areas Hydrol Earth Syst Sci 9 535-547
Singh R P, Mishra D R, Sahoo A K and Dey S (2005) patial and Temporal variability of soil moisture over India using IRS P4 MSMR data International Journal of Remote Sensing
26 2241-2247
Singh R P, Oza S R, Chaudhari K N and Dadhwal V K (2005) Spatial and Temporal Patterns of surface soil Moisture over India estimated using surface wetnes index from SSM/ I microwave radiometer International Journal of Remote
Sensing 26 1269-1276
Srivastava H S, Patel P, Sharma Y and Navalgund R R (2009) Large area soil moisture estimation using multi incidence angle RADARSAT-1 SAR data IEEE transaction on
Geosciences and Remote Sensing 47 2528-2535
Swenson S, Famiglietti J, Rodell M, Chen J and Wilson C R (2008) Estimating profile soil moisture and ground water variations using GRACE and Oklahoma Mesonet soil moisture data Water Resources Research 44
Thenkabail P S, Mitchell S and Turral H (2005) Ganges and Indus river basin landuse/land cover (LULC) and irrigated area mapping using continuous streams of MODIS data
Remote Sens Environ 95 317-341
Tiwari V M, Wahr J and Swensen S (2009) Dwindling ground water resources in Northern India from satellite gravity observations Geophys Res Lett 36 L18401
Upadhyaya S and Ramsankaran R (2013) Review of Satellite remote sensing data based rainfall estimation methods Proc.
of HYDRO International 4-6 Dec. 2013, IIT Madras
Varma A K and Pal P K (2012) Use of TRMM precipitation radar to address the problem of rain detection in Passive Microwave measurements Indian Journal of Radio and
Space Physics 41 411-420
Wang J R and Schmugge T J (1979) An enmperical model for the complex dielectric permittivity of soils as a function of water content IEEE transactions of Geosciences and