MASTER THESIS
PENETRATION DEPTH
CONTROL USING AN
OPTICAL SPECTROSCOPIC
SENSOR
IN ND:YAG LASER
WELDING
J.K. POCORNI
FACULTY OF ENGINEERING TECHNOLOGY DEPARTMENT OF MECHANICAL ENGINEERING CHAIR OF APPLIED LASER TECHNOLOGY
EXAMINATION COMMITTEE
Chairman : Prof.dr.ir. A.J. Huis in ’t Veld Internal member : Dr. ir. R.G.K.M. Aarts Mentor : Ir. A. R. Konuk
External member : Dr. ir. ing. J.M. Jauregui-Becker
DOCUMENT NUMBER
WA - 1379
Light exposes the true character of everything
Paul the Apostle (~62 AD)
Abstract
In the welding industry weld defects such as lack of penetration are considered as problematic because they decrease the strength of the weld joint. Analysis of the process light coming out of the laser material interaction is used in industry to monitor quality parameters such as the penetration depth. This monitoring signal can then be used in a feedback system to steer the weld process to a desired condition or prevent a weld defect. Part of the process light is emitted by a plasma plume which is formed above the weld pool during high power Nd:YAG laser welding. When this plume is blown away with air, cross sections have shown that the penetration depth increases.
The goal of this thesis is to implement a suitable controller which maintains constant penetration, and at the same time increases the weld efficiency by blowing the laser induced plume away. For the control system the availability of a reliable sensor is essential. For this purpose the radiation from the interaction zone was measured with a spectrometer, and from this radiation a signal was calculated which monitored the penetration depth. The monitoring signal was calculated by the ratio between light intensities at two distinct wavelengths. This signal was then fed to an integral controller which adjusted the laser power such that the penetration depth could be kept constant.
First, characterization experiments were carried out to identify the weld process, and based on this identified process, the controller parameter was determined. The characterization experiments were conducted to relate the monitoring signal to the laser power and penetration depth. After this relation was known, the setpoint of the feedback system was set accordingly and the performance of the designed controller was evaluated in simulations. Finally, the controller was tested experimentally with two setpoints.
The obtained results have shown that the measured spectral signal successfully monitored the penetration depth but the implemented controller did not steer the process to a constant penetration.
iii
Samenvatting
In de lasindustrie worden lasfouten zoals geringe penetratiediepte als problematisch beschouwd omdat de sterkte van de lasverbinding verminderd. Analyse van het vrijkomend licht afkomstig van de laser materiaal interactie wordt in de industrie gebruikt om kwaliteitsparameters zoals de penetratiediepte te bewaken. Dit bewakingssignaal kan gebruikt worden in een feedback systeem om het lasproces te sturen naar een gewenste conditie of om een lasfout te voorkomen.
Een deel van het vrijkomend licht wordt uitgezonden door een plasma pluim dat gevormd wordt boven het smeltbad tijdens hoog vermogen lassen met een Nd:YAG laser. Wanneer deze pluim met lucht wordt weggeblazen blijkt dat de penetratiediepte toeneemt. Het doel van deze thesis is om een geschikte regelaar te implementeren die een constante penetratiediepte onderhoudt, en tegelijkertijd de las efficiëntie verhoogt door het wegblazen van de plasma pluim. Voor het besturingsysteem is de beschikbaarheid van een betrouwbare sensor essentieel. Om dit te bereiken werd de straling afkomstig uit de laser materiaal interactie opgemeten met een spectrometer, vervolgens werd uit deze vrijkomende straling een bewakingssignaal berekend dat toezicht hield op de penetratiediepte. Het bewakingssignaal werd berekend uit de verhouding tussen de lichtintensiteiten bij twee verschillende golflengten. Dit signaal werd vervolgens doorgestuurd naar een integrerende regelaar die het laservermogen bepaalde welke nodig was om een constant penetratiediepte te behouden.
Als eerste werden karakterisering experimenten uitgevoerd om het lasproces enerzijds te identificeren en om anderzijds het verband tussen het bewakingssignaal, laser vermogen en penetratiediepte vast te leggen. Op basis van de karakterisering experimenten werden de regelaar parameters ingesteld. Nadat deze relatie bekend was, werd de setpoint van het feedback systeem dienovereenkomstig ingesteld. Vervolgens werd de prestatie van de regelaar geëvalueerd in simulaties om uiteindelijk de regelaar experimenteel te testen bij twee verschillende setpoints. Uit de verkregen resultaten blijkt dat het bewakingssignaal de penetratiediepte succesvol opmeet maar de ontworpen regelaar heeft het lasproces niet kunnen sturen naar een constante penetratiediepte.
iv
Acknowledgment
I would like to thank dr. ir. R.G.K.M. Aarts and ir. A.R. Konuk for their daily coaching and supervision, and Prof.dr.ir. A.J. Huis in ‘t Veld for his recommendations. My special thanks also goes out to ing. Wilco Tax and ir. Frank Ploegman from the Laser Applicatie Centrum (LAC) for their practical assistance with the Laser and Wei Ya, MSc for his help in microscopy analysis.
Table of Contents
Abstract ... ii
Samenvatting ... iii
Acknowledgment... iv
1 Introduction ...1
1.1 Research Objectives ...1
1.2 Research Approach ...1
1.3 Thesis Outline ...2
2 Literature Review on Process Monitoring and Control in Laser Welding ...3
2.1 Introduction ...3
2.2 Radiation Sources ...3
2.2.1 Meltpool and Keyhole Radiation ...4
2.2.2 Plasma physics ...5
2.3 Process Monitoring...6
2.3.1 Electron Temperature and Covariance Matrix Technique ...6
2.3.2 Gas Shielding Detection System ...8
2.3.3 Time and Frequency Domain Detection System ... 10
2.3.4 2D and 3D Spectral Clouds ... 12
2.4 Process control ... 15
2.4.1 Penetration Control with Laser Power Actuation ... 15
2.4.2 Penetraton Control with Laser Power and Weld Speed Actuation ... 17
2.4.3 Closed Loop Control of Laser Welding using a Spectroscopic Sensor... 19
2.4.4 Optical Focus Control System ... 22
2.5 Improvement of Welding Efficiency ... 24
2.6 Concluding Remarks ... 29
2.6.1 Process monitoring ... 29
2.6.2 Process control ... 29
2.6.3 Welding efficiency ... 29
3 Experimental Setup and Procedure ... 31
3.1 Experimental Setup ... 31
vi
3.1.2 Spectroscopic Optical Sensor ... 32
3.1.3 Data Acquisition and LabVIEW Software ... 32
3.1.4 Material Type, Sample Preparation and Welding Configuration ... 33
3.2 Experimental Procedure ... 34
3.2.1 Aligning the Focus Position ... 35
3.2.2 Aligning the Plume-blowing Nozzle ... 36
3.2.3 Power Profile for Characterization Experiments ... 37
4 Sensor Signal Selection... 39
4.1 Extracted Spectral Signal ... 39
4.2 Filtering Spectrometric Data ... 42
4.2.1 Introduction ... 42
4.2.2 Equations for the General Savitzski-Golay Filter ... 42
4.2.3 Implementing the Savitzky-Golay Filter ... 44
4.3 Background Ratio Signal ... 45
4.3.1 Explanation of Signal Behavior ... 45
4.3.2 Change in Emissivity ... 48
4.3.3 Improving the Background Ratio Signal ... 49
4.4 Peak Ratio Signal ... 50
4.4.1 Explanation of Signal Behavior ... 51
4.5 Peak and Background Ratio Signal ... 53
4.5.1 Explanation of Signal Behavior ... 53
4.6 Signal Validation with Cross Sections ... 55
4.6.1 Explanation of Penetration Depth Behavior ... 55
4.7 Concluding Remarks on the Effect of Plume-blowing on Sensor Signals... 56
5 System Identification and Controller Design ... 58
5.1 Introduction to System Identification... 58
5.2 Identification of the Weld Process ... 59
5.3 Controller Design ... 64
5.3.1 Control Objectives ... 64
5.3.2 Discrete I Controller Derivation ... 65
5.3.3 Performance and Robustness Parameters ... 65
5.3.4 Controller Implementation in Simulink ... 67
vii
6 Controller Implementation ... 71
6.1 Introduction ... 71
6.2 Evaluation of Characterization Experiment ... 71
6.3 Evaluation of Controlled Experiments ... 72
6.4 Concluding Remarks on Controlled Experiments ... 73
7 Conclusions and Recommendations ... 76
7.1 Conclusions ... 76
7.1.1 Conclusions on the Literature Review ... 76
7.1.2 Conclusions on Sensor Signal Selection ... 77
7.1.3 Conclusions on System Identification and Controller Implementation ... 78
7.2 Recommendations ... 79
References ... 80
Appendix 1 Penetration Depth Cross Sections ... 83
1 Introduction
In the Introduction the goal of the conducted research is given. The motivation for this goal and the tasks needed to achieve it are also presented.
1.1 Research Objectives
By choosing the right combination of process parameters, Laser welding produces high quality welds with narrow heat affected zones (HAZ). The narrow HAZ limits thermal distortion and improves metallurgical properties. [Dulley (1999)] Also, high processing speed are attainable because in Laser welding the rate of energy input to the work piece is much greater than the conduction rate of the material.
In the research conducted for this thesis, radiation from the Laser material interaction zone is measured in order to produce a spectral signal which monitors a predefined weld defect i.e. lack of penetration. Such sensor data can be used in several ways. Firstly, by acquiring a stable spectral signal from the plume radiation, the weld process is controlled in real-time to prevent the weld defect. In this thesis a spectrometer is used as a measuring device and the Laser power is used as a control actuator. Konuk et al. (2009) have used the spectrometer within the CLET project (Closed Loop control of laser welding through Electron Temperature) to find a reliable method for detection and avoidance of weld defects in Laser welding. In this thesis a new signal has been defined to detect and avoid lack of penetration. A second application of the sensor is based on the research by Oiwa et al. (2011). They used a 1070 nm fiber Laser for welding experiments and have shown that blowing the plume away with air has proven to increase the penetration depth, thus increasing the welding efficiency. The purpose of this work is to combine and go beyond earlier work done by Oiwa and Konuk in such a manner that the weld process is first monitored and then controlled in real-time while the weld efficiency is increased.
The ultimate aim of this thesis is to implement a suitable controller which maintains constant penetration while the weld efficiency is increased with plume-blowing.
1.2 Research Approach
In order to achieve the thesis aim, the following tasks were carried out:
- Design and realization of an experimental set-up for plume-blown and non-blown experiments.
- Conduct welding experiments to find out whether and to which extent plume-blowing increases the penetration depth with a Nd:YAG Laser source.
- Acquire the spectra of both plume–blown and non-blown experiments and derive a spectral signal for detection of lack of penetration.
- Select a sensor signal which successfully measures the increased penetration depth during plume-blowing.
- Derive a mathematical model of the weld process by identifying the process.
- Design a suitable controller based on the mathematical model.
- Modify the CLET LabVIEW software to implement the designed controller and test it with plume-blown experiments.
2
1.3 Thesis Outline
3
2 Literature Review on Process Monitoring and Control in Laser Welding
2.1 Introduction
Duley (1999) defines Laser welding as a delicate balance between heating and cooling inside a volume which overlaps two or more solids such that a liquid pool is formed and remains stable until solidification. The heating and consequent joining of the material is achieved by directing a highly concentrated beam of coherent light onto a small spot. [Shao et al. (2005)]
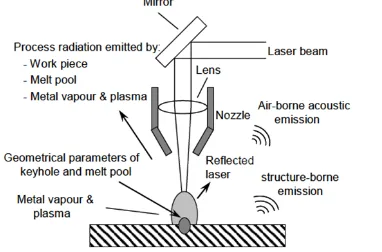
During Laser welding, optical and acoustic emissions are produced (Figure 1). Detection of these emissions is an important step towards monitoring the Laser welding process. By recognizing certain components in the signals that are diagnostic of specific fault conditions, the welding process can be controlled in real time so that the process is optimized and weld defects are eliminated. [Duley (1999)]
Figure 1 displays the emissions which can be detected with suitable sensors. The geometrical parameters of the keyhole and meltpool are measured with e.g. a CCD camera with optical filter. [Duley (1999)] Acoustic emissions are also measurable and are divided into air-borne and structure-borne. These signals are a consequence of stress waves induced by changes in the internal structure of a work piece. The air-borne emission is measured with a microphone while the structure born emissions are measured with piezoelectric transducers positioned on e.g. the work piece surface. The metal vapour, metal plasma and the meltpool emit light that can be measured with an optical device. [Shao et al. (2005)]
The intensity and direction of reflected Laser light is dependent on the shape of the Laser weld interaction zone. Thus this reflected radiation contains implicit information concerning the shape and form of the weld zone. [Wiesemann (2004)] This radiation can also be measured with an optical device.
Figure 1 Signals produced during Laser welding. [Shao et al. (2005)]
The aim of this thesis is to characterize the optical spectrum with a predefined weld defect. If this is achieved with a stable signal, the Laser weld operation will be controlled in real-time to prevent further deterioration of the weld. As a control actuator, primarily the Laser power is applied. In Section 2.4 an overview of possible actuators is given.
Most of the monitoring and control research described in this Chapter is carried out with photodiodes. The spectral signals obtained with photodiodes will be reconstructed with the spectrometer output.
2.2 Radiation Sources
[image:11.612.216.407.392.518.2]4
2.2.1 Meltpool and Keyhole Radiation
During high power Laser welding, weld material evaporates and a hole is formed in the meltpool. This hole, also called keyhole, is stabilized by the pressure of a hot gas (metal plume) above it. [Steen and Mazumder(2010)]
Steen and Mazumderstate that the Laser induced keyhole resembles a blackbody while the plasma emits its own separate spectrum.
A blackbody is an ideal matter that absorbs and emits light at all wavelengths. Blackbodies emit more energy than any other matter at a specific wavelength and temperature, and are also ideal absorbers, absorbing all incident radiation. [Siegel and Howell (2001)]
Steen and Mazumder (2010) state that the keyhole behaves as an blackbody because the incoming Laser light first enters the keyhole, reflects multiple times against the keyhole wall before exiting. This causes large portion of the incoming light to be absorbed in the keyhole.
Chen et al. (1992) approximate the radiant power from the meltpool with Plank’s law for spectral radiation from a blackbody
∙ = (2.1)
Where ∙ is the maximal emission of unpolarized radiation per unit area in all directions in the wavelength range , h is Planck’s constant, c is the speed of light, k is Boltzmann’s constant and T is the absolute temperature.
All other real and practical matter are categorized as greybodies. Thus the ratio between the emissive ability of a greybody to that of a blackbody is always smaller than 1. This is called the emissivity i.e. For black-and greybodies ≤1. [Siegel and Howell (2001)]
Greses et al. (2001) explain that during CO2 Laser welding, a partially ionized plasma is formed but with a Nd:YAG source, merely a high temperature thermally excited gas is developed above the meltpool. This explains why the background of the spectrum obtained with a Nd:YAG source resembles a blackbody spectrum. While the spectrum obtained with a CO2 source shrouds the keyhole and resembles a compilation of line sources. Figure 2 shows a typical spectrum obtained while using a Nd:YAG source.
Figure 2 Spectrum obtained during Nd:YAG Laser welding. Take note of the ‘blackbody-like’ background. Olsson et al., (2009) use three photodiodes to measure in three separate spectral regions i.e. P (plasma), R (reflected) and T (thermal)
region. [Olsson et al., (2009)]
Chen et al. (1992) state that the Laser induced plasma radiates at shorter wavelengths while the heated metal surface reradiates at longer wavelengths. Eriksson et al. (2009) also conclude that the spectral emissions at longer wavelengths find their origin in the meltpool and surrounding hot surface.
5
2.2.2 Plasma physics
In the plume a low density of electrons is present. These electrons are generated by thermal ionization of vaporizing atoms and through thermionic emissions. Absorption of photons from the Laser beam by these electrons cause the plume to heat up.
The plume is (partly) transformed into plasma if there is some kind of energy deposition into the plume which is fast compared to the expansion time of the plume. [Duley (1999)] This energy deposition is brought about by absorption of Laser beam photons by electrons. These electrons are excited to states of high kinetic energy and they are the cause of the further ionization of the plume. This transfer of energy from the Laser beam into heating of the plume is called the inverse Bremstrahlung. [Duley (1999)]
The following equation gives the density of three different plasma components (i.e. electrons, ions and atoms) (Greses et al. 2001)
= ( ) exp − (2.2)
where Ne, NI, No are the density for electrons, singly ionized atoms and neutral atoms at the ground state respectively. gi, ge and go are the degeneracy factors for ions, electrons and neutral atoms. me is the electron mass, k is the Boltzmann constant, Te is the electron temperature, h is Planck’s constant and Ei is the ionisation potential for neutral atoms.
Equation (2.2) is called the Saha equation and is based on the following assumptions:
- In the plume there is Local Thermal Equilibrium
- The relative population of the excited states is described by the Boltzmann distribution at temperature Te.
- All components of the plasma have temperature Te.
The ratio between the electron density Ne and the total gas density N is called the level of ionization of the plasma.
Since plasmas are formed only when there is vaporization of the welded material, the plasmas are used to derive information on the state of the welding process. [Duley (1999)] The emission of spectral lines coming from the plasma is one of the process signals which can be detected during Laser welding. The transition from a higher energy level m to a lower energy level n, gives the following spectral line intensity [Ancona et al. (2008) and Greses et al. 2001]
= ℎ (2.3)
where Nm is the population of the excited state, Amn is the transition probability between upper and lower energy level, c is the speed of light and is the wavelength of the observed species.
Equation (2.3) is based on the assumption that the plasma is optically thin, this means that there is no self-absorption between the point of plasma radiated photon emission and the plasma surface. [Duley (1999)]
Ancona et al. (2008) determine the population of states with higher energy level as follows
= exp − (2.4)
where No is the population of atoms at the ground state, Z is the statistical weight at the ground state or partition function, gm is the statistical weight of the upper energy level and Em is the upper energy level.
6
( ) ( )=
( ) ( ) ( ) ( ) ( ) ( )exp
( ) ( )
(2.5)
where 1 and 2 denote the emission lines. From (2.4) the electron temperature Te is determined
= ( ) ( )( ) ( ) ( )( ) ( ) ( ) ( ) ( )
(2.6)
This electron or plasma temperature is diagnostic of specific fault conditions i.e. Konuk et al. (2009) and Ancona et al. (2008) show that there is a correlation between the electron temperature and the penetration depth.
From above equations it can be concluded that the signals obtained from the plasma originate from the interaction between Laser beam and vaporized material. Thus the plasma signal is actually indirectly correlated to the welding process itself. [Duley (1999)]
2.3 Process Monitoring
In process monitoring signal components that characterize ‘right’ and ‘wrong’ are extracted from the measured spectrum. These signals are based on predefined weld defects and for each weld application, the importance of a certain weld defect differs. Thus the definition of signal components that characterize ‘right’ and ‘wrong’, are application dependent.
Signal extraction must be followed by some kind of signal recognition of ‘right’ and ‘wrong’. This extraction and recognition is the key to process monitoring and subsequently process control. [Duley (1999)]
2.3.1 Electron Temperature and Covariance Matrix Technique
Ancona et al. (2008) extract two signals from the measured optical emission i.e. the electron temperature and correlation signal. Both signals were calculated with the optical intensity of three chemical species i.e. Mn(I), Fe(I) and Cr(I) composing the plasma plume and stainless steel alloy. Two species couples are used for the correlation analysis i.e. Cr(I)-Fe(I) and Cr(I)-Mn(I).
A CO2 Laser is used to weld stainless steel during the research conducted by Ancona. A spectrometer is used that detects light from 390-580 nm with 0.3 nm resolution.
The electron temperature signal Ancona uses is described by Equation (2.6) while the correlation signal is based on the Covariance Matrix Technique (CMT).
In this technique the element ij of the covariance matrix is calculated as follows
= 1 ( ) ( )− 1 ( ) 1 ( ) (2.7)
( ) is the optical intensity at wavelength of the kth spectrum taken by a spectrometer. N is the total amount of spectra shot. Next, the normalized covariance matrix mij is obtained such that mij lies between -1 and 1.
If mij is positive, the two chemical species are formed by a known process parameter. And if mij is zero, the species couple is uncorrelated and no conclusion is drawn. If mij is negative, the species couple is anti-correlated, and they are the consequence of competing (different) processes.
7
on sound welds and the upper and lower error thresholds are defined by adding and subtracting a fraction of the average standard deviation of the reference signal.
The correlation signal plot contains the chosen confidence level for correlation analysis i.e. the α
factor.
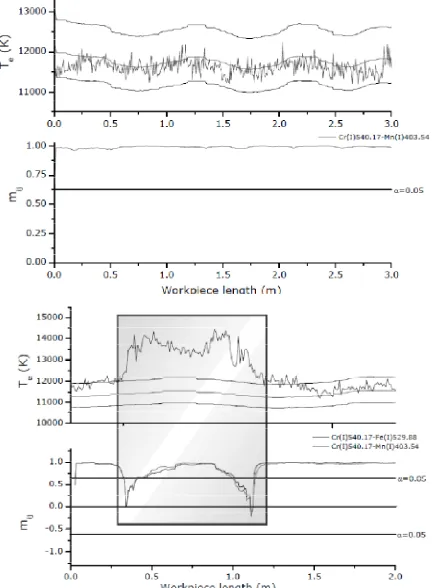
The measured signal shown in Figure 3 (above) is based based on a good weld. From this figure follows that the calculated electron temperature lies between the upper and lower threshold values, and the the correllation signal is above the confidence level. So the specifications for recognizing a good weld are set.
Figure 3 (Above) Electron temperature and correlation signal for a weld without defect. (Below) Electron temperature and correlation signal for a weld with defect (lack of penetration). mij is the normalized correlation between species at
wavelengths λi and λj. α indicates the confidence level for the correlation analysis. [Ancona et al. (2008)]
Figure 3 (below) displays an electron temperature and correlation plot with intentionally produced weld defects obtained by lowering the Laser power and producing welds with a lack of penetration depth.
This figure shows that the electron temperature rises above the upper Te level threshold value and the correlation signal drops below the confidence level.
Concluding remarks:
- Judgment of bad and sound welds in the correlation analysis is based on the value of the correlation signal with respect to the confidence level. But the precise physical meaning of the correlation signal is quite unclear e.g. Ancona et al. give no arguments for mij=0.
- CMT requires long acquisition and computation time.
- The identification of the cause of the defect is only limited to specific cases.
- The realization of a closed loop with CMT seems unlikely because of its computation time.
[image:15.612.196.415.179.473.2]8
2.3.2 Gas Shielding Detection System
Fox et al. (2001) monitor the degradation of gas shielding by measuring radiated from the weld interaction zone. A Nd:YAG Laser was used to weld titanium and stainless steel. The emitted light from the workpiece was measured on-axis with a spectrometer that detects light from 400-850 nm with 0.5 nm resolution.
[image:16.612.219.396.218.318.2]A so called gas shoe was used (Figure 4) to shield the weld zone from air. The overpressure caused by the shielding gas drives away the air inside the shoe. By variation of the shielding gas flow, intentional poor gas shielding conditions were created.
Figure 4 Gas shielding arrangement. [Fox et al. (2001)]
Figure 5 shows the spectrum of poor gas shielding (upper curve) and good gas shielding (lower curve). Fox et al. (2001) describe that the presence of air inside the gas shoe has led to an increase in plume size and intensity, also the plume appeared whiter. These visual observations are accordance with the upper spectrum in Figure 5.
Figure 5 Spectrum obtained while welding stainless steel. Upper curve displays the spectrum for poor gas shielding. Lower curve displays the spectrum for good gas shielding. [Fox et al. (2001)]
Poor gas shielding conditions in Figure 5 was obtained at an argon flow rate smaller than 51 l/min. The titanium welds were severely discolored at these flow rates. Good gas shielding was obtained with a flow rate of approximately 60 l/min, resulting in clean and shiny titanium welds.
[image:16.612.211.390.410.518.2]9 Figure 6 Spectral ratio between poor gas shielding spectrum and good gas shielding spectrum. [Fox et al. (2001)]
In order to compare different optical intensities obtained at different gas flow rates, the intensity at 426 nm, was normalized with that at 835 nm which corresponded to a featureless region. Figure 7 shows a plot in which the intensity ratio is plotted against the gas flow rate.
Figure 7 Intensity spectral ratio between amplitude at 426 nm and 835 nm plotted
against gas shield flow. Triangles represent argon shielding; squares represent helium shielding. [Fox et al. (2001)]
Bad and good gas shielding was determined by visually inspecting the welds: gas shielding was poor when discoloration was seen.
Fox concludes that this intensity spectral ratio is the basis of an air contamination detection system since variations of Laser power and speed did not affect the ratio.
With Figure 7 a spectral ratio can be defined above which bad gas shielding takes place. Figure 8 shows the flow diagram of an alarm system based on this idea. First, the spectrum is captured with a spectrometer, followed by the calculation of the spectral ratio. Next, comparison with the predefined ratio takes places. If the measured ratio is above the decision value, an alarm is sounded. If not, the next spectrum shot is taken and the loop is continued.
10
Conclusions:
- Fox et al. (2001) are unable to identify the cause of the spectral peak at 426 nm (Figure 5 and Figure 6).
- The described system can be augmented to a closed loop which adjusts the gas flow to maintain good shielding conditions.
- In Figure 7 the application of helium shielding gas does not lead to a clear drop in intensity spectral ratio when good shielding conditions are present. So a predefined decision value is not easily obtained with helium gas.
- Discolored surface appearance (e.g. oxidation) is detected with the spectral ratio signal.
- Fox et al. (2001) do not clearly specify if the experiments shown in Figure 6 and Figure 7 are based on titanium or stainless steel.
- Besides visual inspection of the weld, Fox also measures the Vickers hardness of the weld cross section to characterize between good and bad welds.
- Fox does report on a relation between hardness and spectral ratio but stresses that the hardness already increases (indicating a decrease in weld quality) before a noticeable change of the spectral ratio is seen.
2.3.3 Time and Frequency Domain Detection System
Saludes Rodil et al. (2005 and 2010) use a CO2 Laser to weld galvanized steel sheets in a bead-on-plate configuration. Two different photodiodes are used to measure plasma and meltpool radiation. The first photodiode was an IR sensor, and is used to detect meltpool variations. The second photodiode was an UV and visible light sensor, and was used to measure the intensity variation of the plasma plume. The signal from these two sensors is processed in the time and frequency domain. Saludes Rodil assumes that the presence of porosity and lack of penetration in a weld is associated with lesser molten material. Thus, the radiation intensity detected by the IR photodiode should decrease. Figure 9 shows an example of such a dip in intensity.
[image:18.612.200.412.440.681.2]11
Figure 9 (a) displays the rough data obtained with the IR sensor. This data is processed in the following fashion to obtain the curves in plot (b):
First, the IR data is normalized by removing its mean and is scaled with its standard deviation. Next, an adaptive least square (LS) filter is used to obtain a polynomial fit for the measured IR data. From this polynomial fit (solid line in Figure 9 (b)), two polynomial limit curves are produced. In total, three polynomial curves are displayed in (b). The LS filter is combined with a detection system to form the so called CUSUM RLS algorithm.
The detection system detects when the filtered signal goes out of the interval between polynomial limits. This time domain detection method is intended to detect ‘small’ faults such as holes. Saludes Rodil states that the algorithm is trained to respond to a limited amount of known defects by tuning the algorithm in appropriate fashion. Table 1 shows the results of the time domain detection system when applied in the automotive industry.
Table 1 Results of the time domain detection system. [Saludes Rodil et al. (2005)]
Only 55 % of the total amount of intentionally produced holes was detected while 75% of faults were detected. The settings of the CUSUM algorithm are such that the computed polynomial limits are advantageous for detection of faulty seams while specific faults, such as small holes that correspond with small signal changes, are skipped.
The second detection system is based on processing both sensor signals in the frequency domain; a correlation between the power spectrum of the sensor signal and weld defects is used. [Saludes Rodil et al. (2010)] Saludes Rodil et al. conclude from their previous research that the signal energy decreases when a weld is partially penetrated.
First the sensor signal is preprocessed such that the signals corresponding to the weld are isolated. Next, the signal is divided into N equally sized segments, depending on weld speed and length. A fast Fourier Transform (FFT) is done to characterize each portion of the weld with its frequency component distribution. [Saludes Rodil et al. (2010)] For each segment, the global RMS value is computed. Two frequency bands were classified for each sensor i.e. a low frequency band from 500-1500 Hz and a high frequency band from 4000-5000 Hz. The signal energy of the UV-VIS sensor is plotted in Figure 10, for the two specified bands.
Figure 10 Signal energy for different seams. [Saludes Rodil et al. (2010)]
12
computations are carried out. In a multilayer perceptron neural network information flows in a feedforward fashion i.e. from the input layer through hidden layers to the output.
Saludes Rodil’s system processes data from the photodiodes with a neural network which is trained with faulty and non-faulty seams. The output of the neural network is displayed in Figure 11.
Figure 11 Output of neural network. [Saludes Rodil et al. (2010)]
The output varied between 1 and -1, and a decision threshold of 0 was used i.e. seams with a negative neural network output were classified as faulty and seams with positive output were non-faulty. The results of the frequency detection system are given Table 2.
Table 2 Results of frequency domain detection system. [Saludes Rodil et al. (2010)]
Saludes Rodil states that these results are unacceptable since 6.1% of actual normal seams were discarded by the detection system as faulty (1st row of Table 2). Also, 2.9% of actual faulty seams passed as normal by the detection system.
Conclusions:
- With the time domain detection system the position of the fault can be estimated.
- The frequency domain detection system only distinguishes between faulty and non-faulty seams.
- The time based detection system works better when detecting faulty seams than specific holes (see Table 1).
- Although the aim of the time based system was to detect specific faults, the detection system only managed to detect faults is general.
2.3.4 2D and 3D Spectral Clouds
Olsson et al. (2011) use a Nd:YAG Laser to produce lap welds of two zinc coated steel sheets. Three sensors were used for on-axis detection of plasma, reflected and thermal radiation.
13
welds were obtained by positioning the sheets such that there was an overlap with close contact between the sheets, preventing escape of the zinc vapour. This caused a liquid eruption or blow out. [Olsson et al. (2011)] These bad welds are referred to as blow out welds.
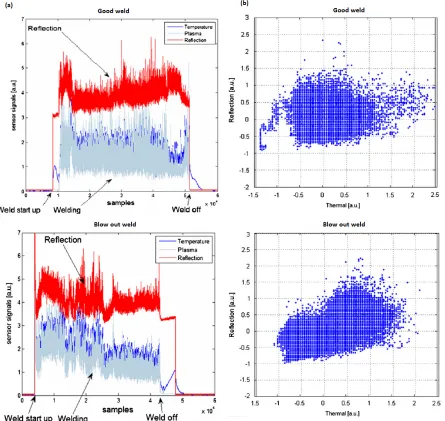
Figure 12 displays the raw data from the sensors. The spectra in this figure displays a strong correlation between the plasma and temperature signal for both good welds as well as blow out welds. The reason for this behaviour is given further in this Section. Also, the sensor signals for the good weld is far more stable then the signals for the blow out welds. This is an expected result since the liquid eruptions cause instable emission of radiation.
Figure 12 (a) Raw data obtained with the three sensors. (b) The reflection sensor signal plotted against the thermal sensor signal. The means have been removed from the signals. [Olsson et al. (2011)]
[image:21.612.96.541.203.624.2]14
not on its temperature. The plot for the reflected signal against the plasma signal also displays low correlation because the reflected light is not strongly related to the plume temperature.
Figure 13 (a) displays a strong correlation between plasma and thermal signal. Olsson states that the connection between the heated meltpool surface and amount of vaporised metal is the reason for the strong correlation; the rate of vapour generation is controlled by the weld pool temperature. The plot for the good weld (Figure 13 (a)) shows that the data points are centred in an elliptical data cloud.
Figure 13 (a) The plasma signal vs. the thermal signal. (b) 3D data clouds consisting of reflection, plasma and thermal data points. The means have been removed from all signals. [Olsson et al. (2011)]
For the blow out weld there are more outlying data points outside the dense elliptical data cloud (Figure 13 (b)). The plasma intensity is also higher for the blow out weld; this could be a consequence of the liquid eruptions spattering more metal into the hot plume, thus causing more vaporized material and higher plasma intensity.
[image:22.612.98.533.167.522.2]15
Conclusions:
- Olsson et al. (2011) explain that raw electromagnetic data from the P-, R- and T- sensor is insufficient for further interpretation of individual weld instability. Yet Olsson only consider blow out welds as a weld defect.
- Plasma and thermal signals show a strong correlation because the rate of vapour generation is controlled by the weld pool temperature. On the other hand, the other combinations of the three sensor signals do not show a strong correlation.
- The 2D and 3D is cloud gives new and novel information but no concrete monitoring system (let alone control system) based on this method has been found yet in literature.
2.4 Process control
Monitoring systems can merely give an alarm when a quality parameter decreases but closed loop systems steer the process back on track by appropriate feedback actions such that the decrease of process quality is instantaneously compensated. [Wiesemann (2004)]
Bardin et al. (2005) gives the following subdivision of actuators in the control of Laser welding processes:
- Laser power
- Welding speed
- Focal point position
- Filler wire speed rate
Only the first three actuators will be discussed in this Section because of limitations specified in the Master thesis description.
2.4.1 Penetration Control with Laser Power Actuation
Postma et al. (2002) use a Nd:YAG Laser to make bead-on-plate welds on mild steel specimens. The plume radiation was measured on-axis with a commercial monitoring system called Weldwatcher. Figure 14 shows the Weldwatcher system, Laser source and controllers. The operation of the Weldwatcher system is outlined below.
Plume radiation is transmitted through the delivery fiber into the Haas 2006D Laser. In front of the Laser cavity, the process radiation is decoupled and fed through a separate fibre into a detector. The output of the detector is then filtered with an analog low pass filter of 500 Hz to filter out high frequency process dynamics. [(De Graaf et al. (2005) and Postma et al. (2002)] Argon gas shielding was applied at the top and bottom of the workpiece.
16
A process model was obtained using system identification and described the dynamic response of the Laser welding process, the sensors and the Laser itself. As is displayed in Figure 15, the input of the identified process is the Laser power = +Δ and output is the sensor signal Sw. With this knowledge a controller is designed which maintains full penetration while intentional disturbances such as power fluctuations and weld speed changes occur.
Figure 15 The feedback setup. Postma et al. (2002])
The identified process in Figure 15 consists of the identified Laser source Gl and the identified welding process and sensor dynamics Gp. The input of the controller C is an error signal Se while the
output is the Laser power ΔP. Together with the nominal power Pn, the input to the process is established. The error signal Se is the difference between the reference signal Sr and sensor signal Sw. The applied controller was a discrete time domain PI controller obtained with pole placement. The aim was to design a feedback system with sufficient disturbance rejection capabilities, yet fast enough to guarantee full penetration.
Figure 16 displays the Weldwatcher sensor signal, the input Laser power and the weld speed as a function of weld position. This figure is based on an experiment in which the weld speed increases suddenly at weld position 46 mm; the speed increases from 100 mm/s to 160 mm/s.
The sensor signal increases in the first 10 mm and suddenly drops while the Laser power is kept constant at 1000 W during the first 10 mm. This is a consequence of the transition from partial to full penetration. At full penetration, plume radiation escapes from the bottom of the weld causing a decrease in radiation that reaches the sensor.
The controller is only active after full penetration is reached since the system identification is based on the full penetration condition. The reference signal was set to Sr=3.25. The controller cautiously adjusts the Laser power to keep the sensor signal near this reference. In particular, the controller also reacts to the speed increase by increasing the Laser power. Postma states that there was no lack of penetration in the weld. This is also visible in the sensor signal after the speed increase i.e. the Weldwatcher sensor signal oscillates around the reference signal Sr=3.25 before and after the speed increase.
17
In Figure 17, the nominal Laser power was decreased to simulate power attenuatuation caused by dirty optics. During this experiment, the reference sensor signal was Sr=3.5 and the weld speed equaled 100 mm/s. The Laser power was changed accordingly by the controller to maintain full penetration. The Laser power signal in this experiment shows more noise than in Figure 16. This is a consequence of the higher value of the reference signal. Postma states that transition from partial to full penetration occurs at a signal value of 3.4 at 100 mm/s weld speed. Since the reference value is above the transition value, the process continuosly tends to switch between full and partial penetration. But the system identification is based on the fully penetrated condition. This is the reason for the noisy output of the controller, which was designed on the identified model. Postma et al. report that higher reference values even lead to an unstable feedback.
Figure 17 Feedback system response for power variation. [Postma et al. (2002)]
Conclusions:
- The designed controller was able to cope with sudden speed changes but more important for this Master thesis is that the controller was able to prevent weld defects such as lack of penetration.
- System identification of the Laser welding process, the sensors and Laser itself proved to be a reliable method for the design of the controller.
- The PI controller was robust against disturbances and also fast if the controller parameters were chosen sensible
2.4.2 Penetraton Control with Laser Power and Weld Speed Actuation
18 Figure 18 Feedback system. [Postma et al. (2002)]
The first loop in Figure 18 consists of controller 1 and uses the Weldwatcher signal as feedback signal while the Laser power is applied as an actuator to keep keyhole on the verge of partial and full penetration. This controller is similar to the solution presented in Section 2.4.1, although a different control algorithm is used as outlined below.
The second loop, consisting of controller 2, uses the actuator Laser power P as feedback signal while the weld speed is used as an actuator. The second closed loop optimises the weld speed with respect to the maximum Laser power Pmax.
Figure 19 shows the response of the Weldwatcher sensor as a function of Laser power. At low speeds (80 mm/s), transition from partial to full penetration is characterized by a change in slope of the signal. At high speeds, transition is characterized by a drop in signal intensity. When fully penetrated, plume radiation also exits at the bottom of the workpiece. This causes the decrease in light intensity detected by the Weldwatcher sensor. Postma et al. define the signal strength right before full penetration as SHL (high level) and the signal strength right after full penetration as SLL (low level). Figure 19 also displays that SHL and SLL increase with increasing speed.
Figure 19 Weldwatcher signal as a function of Laser power at different weld speeds. [Postma et al. (2002, [14])]
Between SHL and SLL, a threshold value Str is defined. Controller 1 compares the Weldwatcher signal Sw with this threshold value:
- If Sw>Str, the keyhole is partially penetrated, and a strong increase in Laser power is demanded by the controller.
- If Sw<Str, the keyhole is already fully penetrated, and the Laser power is slowly decreased. Controller 2 compares the actuator Laser power P with the predefined maximum Laser Pmax:
- If P>Pmax, the weld speed is decreased since controller 1 should demand less power.
19
Figure 20 displays the responses of the closed loops during an experiment in which the initial settings were as follows: a weld speed of 150 mm/s and Laser power of 1400 W. The threshold values were set to Str=4.2 and Pmax=1800 W.
For the first 10 mm, the controller was not active since the keyhole was not yet fully penetrated. After activation of the controller, the Laser power increases to its maximum value of 1800 W and an optimal weld speed of 220 mm/s was achieved. After visual inspection, Postma states that there was full penetration over the entire weld length.
Figure 20 (Top) Laser power demanded by first control loop; (Middle) Response of the second feedback loop; (Bottom) Weldwatcher signal. [Postma et al. (2002, [14])]
The top plot in Figure 20 shows strong increase and slow decrease of the demanded Laser power. The rate of increase differed from the rate of decrease in order to keep the system from becoming unstable i.e. if the Laser power was decreased as strongly as it increased, the Weldwatcher signal value would drop considerably into the region of partial penetration (see Figure 19). But the controller would interpret this lower signal value as the keyhole being in the fully penetrated region. The controller would thus decrease the Laser power further, and become unstable.
The bottom plot of Figure 20 shows the Weldwatcher signal approaching the threshold value Str as the weld progresses. The reason for this is given in Figure 19 i.e. SLL (=signal just after full penetration) increases with increasing velocity. Thus the measured sensor signal in Figure 20 will approach the fixed threshold Str as the speed increases.
Conclusions:
- The control system described by Postma et al. (2002) applies Laser power and weld speed actuation to prevent an important weld defect i.e. lack of penetration.
- The control system also searches for and operates at an optimized weld speed.
- Weld speed is not regulated during a trajectory in practical cases. There is still a possibility for optimizing the weld speed off-line, and using the optimized trajectory afterwards.
2.4.3 Closed Loop Control of Laser Welding using a Spectroscopic Sensor
20
For the Nd:YAG experiments two sheets with thicknesses of 1 and 3 mm were placed on top of each other. A spectrometer was used with a filter with cut-off frequency of 900 nm in order to filter out the reflected Laser radiation. The top surface of the workpiece was shielded with argon gas. A PI controller was designed with the aim of achieving constant penetration depth over the entire weld length for different process conditions. The PI controller had the following form
( ) = 1 + (2.8)
kp and Ti represent the proportional gain and integral time constant respectively. The block diagram of the controller and weld process is given in Figure 21.
Figure 21 Block diagram of closed loop system. [Konuk et al. (2009)]
The electron temperature Te is calculated with Equation (2.6), and the atomic Chromium Cr I 459.23 nm-495.69 nm pair of lines were selected for the calculation. A predefined reference value Te, ref was compared with the calculated electron temperature Te to produce the error ΔTe. This error is the controller input. The controller output is the Laser power demanded to form a weld penetration depth associated with Te, ref.
Within the Labview software, signals received from the spectrometer were used to characterize and control the process. [Konuk et al. (2009)]
The controller parameters were obtained with characterization experiments. During these experiments the weld speed was kept constant and the Laser power was varied. Figure 22 shows such a characterization experiment. The Laser power was varied to identify the characteristics of the welding process. [Konuk et al. (2009)]
Figure 22 Characterization of Nd:YAG Laser weld process. [Konuk et al. (2009)]
21
at each end. The minimum Laser power of 1400 W produced a failed overlap weld (the weld only penetrated the top sheet).
From Figure 22 the optimum values of the controller parameters were determined. Also, the following set points for welds with penetration extending to the bottom plate were chosen: Te, ref = 7300 K, 7400 K and 7500 K.
With the controller parameters and set points determined, the controller can now be tested (in practice, the controller is first calibrated for each specific experimental configuration). Figure 23 shows the performance of the controller when Te, ref = 7500 K.
Figure 23 (Left) Electron temperature, Laser power variation and penetration variation vs. the time for Te, ref=7500 K. (Right) Electron temperature vs. Laser power for Te, ref=7500 K. [Konuk et al. (2009)]
Figure 23 (Left) displays the demanded Laser power of the controller and the calculated electron temperature. Comparing the overall variation of the electron temperature and Laser power signal, some correlation is expected between these two signals. The form and shape of the cloud in Figure 23 (Right) justifies this presumption.
Physical results of the closed loop with PI controller are shown in Figure 24. This figure displays the top surface of four experiments i.e. the upper view displays the characterization experiment and the next three surfaces represent closed loop experiments with Te, ref=7400 K, 7300 K and 7500 K.
The seam oxidation surface was shiny and no oxidation was detected (Figure 24).
Figure 24 Top surface of weld seam of (1) characterization experiment, (2) penetration control experiment with Te, ref = 7400 K, (3) penetration control experiment with Te, ref = 7300 K and penetration control experiment with
22
Conclusions:
- There exists a correlation between the electron temperature and penetration depth (see Figure 22).
- This correlation was not just used for process monitoring but also to successfully control the penetration depth.
- The PI controller performs well, yet improvements to increase its reliability should be made. [Konuk et al. (2009)]
Since the biggest challenge lies in the monitoring of the weld process, a different controller can be chosen or the current PI controller parameters should be chosen differently to improve controller reliability.
2.4.4 Optical Focus Control System
Hand et al. (2000) use a Nd:YAG Laser to process mild steel by forming bead-on-plate welds. Experiments were carried out in which intentional focus errors (= distance from optimum focal position) were created.
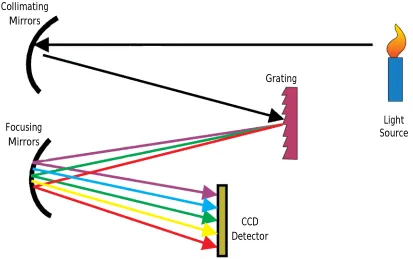
Thermal distortions of the workpiece are one of the causes of focus shift during Laser welding. Focus shifts affect the Laser power density on the workpiece, and can cause defects such as lack of penetration among others. The focus control system described by Hand et al. exploits the chromatic aberration of the collimator and focus lens in the Laser welding head such that by analysing the spectrum of process radiation, the focal error is derived.
[image:30.612.149.463.442.643.2]The process radiation of the Laser material interaction zone is partly collected by the collimator and focus lens, and subsequently imaged into the delivery fibre optic (Figure 25). This delivery optic transports the light into the Laser console in which it is transmitted at a dielectric turning mirror. After this mirror, the radiation is coupled into a fibre optic leading to the detection optics. These detection optics split the process radiation into the following spectral bands: the UV-visible band between 300-700 nm and the IR band between 1100-1600 nm.
Figure 25 Focus control system. [Hand et al. (2000)]
23
[image:31.612.217.400.133.282.2]Maximum coupling of process radiation into the fibre optic occurs at different positions if the height of the workpiece surface changes. These effects are displayed in Figure 26. Thus the difference in light intensity of these two spectral bands has to be correlated with the focus error. This difference signal was used by Hand et al. as a feedback signal in order to keep the Laser beam in focus on the workpiece.
Figure 26 Coupling of process radiation into the delivery fibre optic by placing the workpiece (a) at Laser focus, (b) above Laser focus and (c) below Laser focus. [Hand et al. (2000)]
Figure 25 displays the method of processing the two spectral signals into an error signal. First the output of the detection optics is filtered with low pass filters to remove high frequent noise associated with oscillations of the keyhole and weldpool. [Hand et al. (2000)] The signals and are scaled with gains and to compute the error signal as
= − (2.9)
The gains are chosen such that equals zero when the Laser beam is in focus on the workpiece. This error signal was used as a feedback signal in closed loop to maintain an in-focus Laser beam on the workpiece. The error was minimized by moving the translation stage in Figure 25.
The unfiltered UV-VIS and IR signals are displayed in Figure 27 (Left). The error of the processed signals, as determined in Equation (2.9), are shown in Figure 27 (Right).The signals in Figure 27 were obtained by tilting a mild steel plate 2.5°. In this manner a variable focus error was simulated. The plate had a relative speed of 2.5 m/min. The effect of chromatic abertaion of the lenses is also seen in Figure 27: the IR signal was maximal when the Laser beam was focussed under the workiece surface while the UV signal was maximal when the Laser beam was focussed above the surface.
24
Figure 28 displays the focus control system applied to a bent mild steel plate. Both the results of the controlled and uncontrolled situation are shown. The rear surface of the uncontrolled situation shows that there was no penetration in the middle of the plate where the focal error was 6 mm. With the application of focus control, the steel plate was fully penetrated.
After analysis of the residual error signal of the closed loop, Hand et al. state that the focus was kept within an interval +0.1 mm.
Figure 28 Welds obtained by bending a mild steel plate. The seams were obtained with and without focus control. [Hand et al. (2000)]
Conclusions:
- Focus shift caused by e.g. thermal distortion, can be minimized with the focal control system described by Hand. Consequently, weld defects such as lack of penetration are prevented.
- The on-axis detection setup lends itself for the detection of other process errors in parallel by applying additional process radiation analysis techniques.
2.5 Improvement of Welding Efficiency
In this Section a method for increasing the weld efficiency is described. In this thesis the techniques of previous sections for monitoring and control will be used together with the efficiency increasing method proposed in this Section.
Duley reports that the first role of shielding gas is to prevent oxidation of the melt pool. Secondly, if the gas nozzle is positioned accordingly, the shield gas suppresses plasma formation over the weld zone and, if a plasma does develop, the shielding gas should blow it away. But Oiwa et al. (2011) state that in remote welding it is difficult to shield the weld zone by fixing a gas nozzle to the welding head because of the long focal length of remote systems. This is why Oiwa studied the welding process without shielding and only used an airflow from a fan to suppress the plume above the keyhole.
Oiwa et al. used a 10 kW fiber Laser with 1070 nm radiation wavelength to make bead-on-plate welds on Zinc coated steel. They investigated the influence of the atmosphere above a specimen on welding results, in particular the weld depth.
The airflow from the fan blows away the plume with a wind speed of ~5 m/s. Figure 29 shows the weld obtained without air blowing above the specimen and Figure 30 shows the obtained weld with air blowing above the specimen. The Laser power equals 4 kW, weld speed is 5 m/min (=83.3 mm/s) and weld head is in focus.
25 Figure 29 Front and back surface of welds obtained in 1.5 mm Zinc coated steel with fan turned off.
Laser power equals 4 kW, weld speed is 5 m/min (=83.3 mm/s) and weld head is in focus. [Oiwa (2009)]
Figure 30 Front and back surface of welds obtained in 1.5 mm Zinc coated steel with fan turned on. Laser power equals 4 kW, weld speed is 5 m/min (=83.3 mm/s) and weld head is in focus. [Oiwa (2009)]
The Michelson interferometer technique was used to investigate the influence of air on the increased penetration depth. Figure 31 shows the setup of the fiber Laser, interferometer, probe Laser and fan. The working principle of the setup is described as follows. Radiation from the probe Laser is split into two separate beams by the half mirror i.e. beam (1) and (2) in Figure 31. Beam (1) passes through the atmosphere above the specimen while beam (2) passes through an unaffected region.
Beam (1) is affected by the refractive index distribution above the specimen, and has a phase difference with respect to beam (2). After reflection on the mirrors, both beams are combined by the half mirror and projected onto a screen. The projection is called fringe patterns.
If beam (1) and (2) have no phase difference, the fringe patterns consist of horizontal lines. If there is a phase difference, the fringe patterns display curved lines. Oiwa reports that the obtained fringe patterns change with the spatial refractive index of the observed area.
Figure 32 shows the fringe patterns when no air is blown over the specimen, and Figure 33 shows the fringe pattern with air blowing.
26
Figure 32 shows that the fringe pattern changes in complexity with varying plume height and size. At t1, the plume is narrow and tall and the curved fringe patterns encompassing the plume also have the same form. At t2, the fringe patterns are curved over the entire observation area while the plume is shorter than 10 mm. Between instant of time t3-t5, the plume height grew much taller and the specimen was merely partially penetrated. Oiwa claims that fringe patterns that are curved downwards in the path of the Laser beam correspond to a region with lower refractive index.
Figure 32 Plume behaviour, fringe patterns and specimen surface appearance with fan off. [Oiwa (2009)]
The low refractive index distribution refracts and defocuses the Laser beam causing the Laser power density on the specimen surface to decrease (see Figure 34). Consequently, there is a transition from full to partial penetration.
[image:34.612.145.473.453.654.2]Figure 33 shows that that the plume size decreases significantly when air is blown. The size of the low refractive index zone also decreases and is shifted in the direction of the blowing air. The interaction zone between the Laser radiation and the low refractive index zone is thus made smaller when air is blown, this leads to higher Laser power densities on the specimen surface and deeper welds.
Figure 33 Plume behaviour, fringe patterns and specimen surface appearance with fan on. [Oiwa (2009)]
27
Figure 34 shows a schematic drawing of defocusing and refraction of the Laser beam by the low refractive index zone.
Figure 34 Schematic drawing of defocussing and refraction caused by the atmosphere above specimen. [Oiwa et al. (2008)]
Oiwa reports that without blowing air, the plume height reaches over 100 mm while the low refractive zone reaches a height over 400 mm. Figure 32 shows that the low refractive index zone is present even in places where the plume is not visible. This is particularly visible at time t2.
Since blowing air above the specimen increases the Laser power density reaching the surface, blowing also increases the power absorbed by the workpiece and the welding efficiency. The increased welding efficiency can be described from an energy perspective, or alternatively imply that blowing air enables faster welding since deeper welds are obtained at lower power levels.
Other sources of Laser power loss are scattering and inverse Bremsstrahlung absorption. Steen and Mazumder(2010) describe scattering as a phenomenon in which light does not appear to travel in a straight line but is scattered in different directions. When particles are smaller than the radiation wavelength, they scatter radiation in the form of a spherical wave; this is called Rayleigh scattering. If the diameter of the particles is approximately equal to the radiation wavelength, the scattering effect is called Mie scattering. Steen and Mazumder claim that boiling or ablation in the keyhole or interaction zone will almost certainly lead to an aerosol which causes scattering of the Laser radiation. Table 3 displays the particle size of matter ejected while Laser processing at 3.5 kW with a CO2 Laser source and Nd:YAG source.
Particle size CO2 Laser Nd:YAG Laser
< 100 nm 93% 78%
> 1μm 2% 14%
Table 3 Size of particles ejected during Laser welding with power of 3.5 kW.
From Table 3 follows that during welding with a Nd:YAG source, both small and large particles are ejected from the keyhole while with CO2 welding predominantly small particles are ejected. Steen and Mazumder report that both Rayleigh and Mie scattering are significant when processing matter with a Nd:YAG source. This is in agreement with the Nd:YAG particle size in Table 3.
28
( ) =
√ ( ) ( ) (2.10)
Where α is the inverse Bremsstrahlung absorption coefficient for Laser radiation, the unknown constant m=1, ne is the electron density within the plasma, ni is the density for singly ionized atoms, Z is the average ionic charge within the plasma, e is the elementary charge, g is the quantum mechanical Gaunt factor, c is the speed of light in vacuum, is the permittivity of free space, is frequency of the Laser radiation, me is the electron mass, k is the Boltzmann constant and Te is the electron temperature. Equation (2.10) is rewritten as
= with =
√ ( ) ( ) and
= (2.11)
Where is the Laser radiation wavelength. In order to relate the absorption coefficient in Nd:YAG and CO2 welding, K is assumed as constant.
Since the radiation wavelength of Nd:YAG and CO2 sources equals = 10640 and : =
1064 , the radiation frequency are related as : = 10 .
The absorption coefficient of both sources are then related as : = ⇔ : = . Thus the inverse Bremsstrahlung absorption for Nd:YAG sources is 100 times smaller than that of CO2 sources and is not considered as a cause of significant decrease in Laser power.
So blowing above the specimen surface minimizes the effect of the low refractive index zone and blows away particles that could lead to scattering.
Conclusions:
- The plume heats up the atmosphere above the specimen and consequently the refractive index of the atmosphere decreases. The Laser beam is then refracted and defocused as is shown in Figure 34.
- The refracted and defocused Laser beam causes the Laser power density on the specimen surface to decrease, leading to lower welding efficiency and e.g. to transition from full to partial penetration.
- The size of the interaction zone of the incident Laser and low refractive index zone has significant effect on the penetration depth.
- If no air is blown, the low refractive index zone is taller and broader than the plume itself. See Figure 32 at t2.
- Blowing air during Laser welding, also removes particles that cause scattering. Particle sizes are displayed in Table 3.
29
2.6 Concluding Remarks
2.6.1 Process monitoring
The covariance matrix technique (CMT) proposed by Ancona et al. (2008), the gas shielding monitoring system by Fox et al. (2001) and the frequency domain detection system by Saludes Rodil et al. (2005) are the most interesting monitoring methods, primarily because they have proven to work.
Important drawbacks of CMT are the computation time and limited knowledge of the physical meaning of the covariance matrix elements mij.
If the shielding gas detection system is applied in this thesis, the hardness of the weld cross section should also be measured to distinguish between good and bad welds.
The 3D spectral cloud monitoring technique is quite new and has only been tested for one specific weld defect i.e. blow out welds.
If the frequency domain detection system is applied in this thesis, the Nyquist-Shannon theorem states that the sampling frequency of the spectrometer should be minimally 2∙5000 Hz. The Ocean Optics HR 2000+ spectrometer has a maximal sampling rate of 1000 Hz, and cannot be used to produce signals as in Figure 10. Yet this detection system is still applicable if slow weld defects, such as improper gas shielding, are monitored.
2.6.2 Process control
Actuation with Laser power and focal point position are most pragmatic options while weld speed velocity control is best suited for off-line implantation.
Konuk (2009) and Postma (2002) have successfully actuated with Laser power. Konuk et al. tune their PI controller with characterization experiments while Postma et al. identify the Laser welding process, sensors and the Laser itself, and design a controller based on the identified process. In this thesis the controlled experiments will be conducted by both characterization experiments and weld process identification.
The focus control system recommended by Hand et al. (2000) primarily detects focus shifts caused by e.g. thermal distortions. The direct influence of focus actuation on weld defects other than lack of penetration is not studied by Hand. But Hand does state that his control system is robust against large variations in welding conditions: for different materials, thicknesses, welding speeds and tilt angles, excellent welds are obtained with Hand’s focus control system.
Ancona’s electron temperature signal and Fox’s shielding gas detection signal were used as inspiration to define new spectral signals which monitored the penetration depth.
2.6.3 Welding efficiency
In this thesis blowing experiments are only conducted at high Laser power. Blowing air above a specimen is effective to the improvement of the penetration depth, but neither Oiwa (2011) nor Pocorni (2011) comment on other metallurgical effects, such as pore creation.
Air blown above the specimen could also deteriorate the spectrometer signal but could also unveil other sources of radiation coming out of the keyhole. Experiments with blowing and without blowing will be conducted and the acquired spectral signals will be compared to see how and if they differ from each other.
![Figure 4 Gas shielding arrangement. [Fox et al. (2001)]](https://thumb-us.123doks.com/thumbv2/123dok_us/9919199.493766/16.612.219.396.218.318/figure-gas-shielding-arrangement-fox-et-al.webp)


![Figure 25 Focus control system. [Hand et al. (2000)]](https://thumb-us.123doks.com/thumbv2/123dok_us/9919199.493766/30.612.149.463.442.643/figure-focus-control-system-hand-al.webp)