INTRODUCTION
Air and water have drastically different physical properties, and hence animals capable of moving in both media are expected to face evolutionary trade-offs regarding locomotory performances (Williams, 1999). Some seabirds (or waterbirds) are capable of both level flapping flight and prolonged diving, e.g. auks (Alcidae), cormorants (Phalacrocoracidae), boobies and gannets (Sulidae), loons (Gaviidae), grebes (Podicipedidae), ducks (Anatidae), shearwaters (especially the genus Puffinus) and diving petrels (Pelecanoides). The flight and diving performance of these birds might be compromised, because morphological and physiological demands are conflicting (Lovvorn and Jones, 1994; Wilson et al., 2008). For example, flapping flight favours smaller body sizes to allow for a larger margin of power available relative to the power required (Pennycuick, 2008). By contrast, breath-hold diving favours larger body sizes to allow for a larger margin of the oxygen stored relative to the oxygen consumed (Kooyman, 1989; Halsey et al., 2006). An extreme of the spectrum might be the Galápagos cormorant Phalacrocorax harrisi, which secondarily lost flight capability and has enhanced diving capability with the largest body mass among its family (Wilson et al., 2008). However, few studies have quantified both flight and diving performance of seabirds that dive and fly; consequently, empirical support for the possible compromise is sparse.
A major limitation in testing the prediction of evolutionary trade-offs is that, although the methods to record the diving behaviour of
seabirds (e.g. dive depth, duration and swim speed) using miniaturized animal-attached tags are now well established (Ropert-Coudert and Wilson, 2005), those to record flight behaviour (e.g. flight duration, distance and speed) are still immature. Recently, several methods to record flight duration were developed (Dall’Antonia et al., 2001; Tremblay et al., 2003; Pelletier et al., 2008; Sato et al., 2008), and support for the prediction was provided: when two species of auks were compared, the species that flew for longer durations dived shallower and for shorter durations than the other (Thaxter et al., 2010). Nevertheless, detailed behavioural and biomechanical analysis on the flight behaviour of seabirds in the context of the flight–diving compromise is still lacking. To do this, it is necessary to record more behavioural parameters during flight, such as GPS positions, which provide detailed horizontal paths (Weimerskirch et al., 2002).
Moreover, one of the most important parameters that directly affect flight energetics has never been continuously recorded for any bird: flight speed relative to air. The choice of air speeds by flying animals represents behavioural decisions depending on their ecological or physiological states (Norberg, 1981; Hedenstrom and Alerstam, 1995; Pennycuick, 2008; Grodzinski et al., 2009), and thus could provide useful information for the possible flight–diving compromise. For example, deep-diving seabirds might have only limited power available for flight compared with the power required, owing to their adaptations for diving. If so, they might choose the flight speed that
The Journal of Experimental Biology 214, 412-421 © 2011. Published by The Company of Biologists Ltd doi:10.1242/jeb.050161
RESEARCH ARTICLE
Poor flight performance in deep-diving cormorants
Yuuki Y. Watanabe
1,*, Akinori Takahashi
1, Katsufumi Sato
2, Morgane Viviant
3and Charles-André Bost
3 1National Institute of Polar Research, Tachikawa, Tokyo 190-8518, Japan, 2International Coastal Research Center, Atmosphere andOcean Research Institute, The University of Tokyo, Otsuchi, Iwate 028-1102, Japan and 3Centre d’Etudes Biologiques de Chizé-CNRS, Villiers en bois, 79360 Beauvoir/Niort, France
*Author for correspondence ([email protected])
Accepted 7 October 2010
SUMMARY
Aerial flight and breath-hold diving present conflicting morphological and physiological demands, and hence diving seabirds capable of flight are expected to face evolutionary trade-offs regarding locomotory performances. We tested whether Kerguelen shags Phalacrocorax verrucosus, which are remarkable divers, have poor flight capability using newly developed tags that recorded their flight air speed (the first direct measurement for wild birds) with propeller sensors, flight duration, GPS position and depth during foraging trips. Flight air speed (mean 12.7ms–1) was close to the speed that minimizes power requirement, rather than energy expenditure per distance, when existing aerodynamic models were applied. Flights were short (mean 92s), with a mean summed duration of only 24minday–1. Shags sometimes stayed at the sea surface without diving between flights, even on the way back to the colony, and surface durations increased with the preceding flight durations; these observations suggest that shags rested after flights. Our results indicate that their flight performance is physiologically limited, presumably compromised by their great diving capability (max. depth 94m, duration 306s) through their morphological adaptations for diving, including large body mass (enabling a large oxygen store), small flight muscles (to allow for large leg muscles for underwater propulsion) and short wings (to decrease air volume in the feathers and hence buoyancy). The compromise between flight and diving, as well as the local bathymetry, shape the three-dimensional foraging range (<26km horizontally, <94m vertically) in this bottom-feeding cormorant.
Supplementary material available online at http://jeb.biologists.org/cgi/content/full/214/3/412/DC1
minimizes power requirement, rather than energy expenditure per distance (Pennycuick, 2008). This prediction can be tested by recording the flight air speed of seabirds in known ecological contexts (e.g. migrating, foraging and rearing chicks) and comparing it with the theoretical U-shape curve that represents the relationship between
power requirement and flight air speed (Rayner, 1999). Previously, such studies collected the data of flight speed from ground-based remote observations (Welham, 1994; Pennycuick, 1987; Bruderer and Boldt, 2001; Pennycuick, 2001), where records are inevitably sporadic and limited to the birds flying closely to the observers. Therefore, recording flight air speed continuously with other behavioural parameters using animal-attached tags would be a promising approach to better understand the flight behaviour of birds. In this study, we used newly developed tags to obtain detailed records of free-ranging flight behaviour as well as diving behaviour for a cormorant (here ‘cormorant’ is the general term for species in the family Phalacrocoracidae, whereas some of them are specifically called ‘shags’) (see Siegel-Causey, 1988). Parameters measured for flight behaviour included flight air speed (directly measured using the propeller sensor), GPS positions (which provide horizontal tracks and flight ground speed) and accelerations (which provide flight duration and wingbeat frequency). As a model of seabirds capable of level flapping flight and prolonged diving, we studied the Kerguelen shag Phalacrocorax verrucosus (Cabanis 1875), a member of the so-called blue-eyed shag complex (Siegel-Causey, 1988). Because of the remarkable diving capability in this complex (Quintana et al., 2007), we hypothesized that their flight performance is limited. Specifically, we would expect that: (1) the flight of shags is short, (2) resting behaviour is observed after flights, especially after long flights, and (3) actual flight air speed is close to the flight
air speed that minimizes the power requirement, rather than energy expenditure per distance. The first two predictions were examined using behavioural patterns (flight, diving and stay at the sea surface, monitored by accelerometers) overlaid on the GPS track during foraging trips. The last prediction was examined by comparing recorded flight air speed with the theoretical power curve, calculated for this species using existing aerodynamic models.
MATERIALS AND METHODS Fieldwork and instruments
Fieldwork was conducted at Pointe Suzanne in the Kerguelen archipelago (49.43°S, 70.43°E) from December 2008 to February 2009, under a permit from the nature reserve and ethics committee of the Terres Australes et Antarctiques Françaises and Institut Polaire Français Paul Emile Victor. A total of 26 birds (20 males and 6 females) rearing one or two chicks were captured at the nests with a noose at the end of a 4m fishing pole. They were then measured, weighed, equipped with data loggers (secured on the birds’ backs using tape) and released. The birds were recaptured after one or two days, and the loggers were removed.
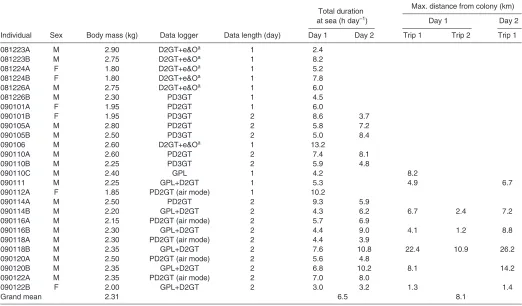
[image:2.612.45.567.427.733.2]Several types of data loggers (Little Leonardo Corp., Tokyo, Japan) were used (Table1): M190L-D2GT (15mm diameter, 53mm in length, 16g in air) recorded depth, two-axis accelerations and temperature; W190L-PD2GT (21mm diameter, 117mm in length, 60g in air) recorded swim or flight speed (see below), depth, two-axis accelerations and temperature; W1000-PD3GT (22mm in diameter, 102mm length, 90g in air) recorded swim or flight speed, depth, three-axis accelerations and temperature; and GPL20 [49mm in width and length, 21mm in depth (with rounded corners), 61g in air] recorded GPS positions. Sampling intervals were set at 1s
Table 1. Descriptive information and foraging trips of Kerguelen shags
Total duration Max. distance from colony (km) at sea (h day–1) Day 1 Day 2
Individual Sex Body mass (kg) Data logger Data length (day) Day 1 Day 2 Trip 1 Trip 2 Trip 1
081223A M 2.90 D2GT+e&Oa 1 2.4
081223B M 2.75 D2GT+e&Oa 1 8.2
081224A F 1.80 D2GT+e&Oa 1 5.2
081224B F 1.80 D2GT+e&Oa 1 7.8
081226A M 2.75 D2GT+e&Oa 1 6.0
081226B M 2.30 PD3GT 1 4.5
090101A F 1.95 PD2GT 1 6.0
090101B F 1.95 PD3GT 2 8.6 3.7
090105A M 2.80 PD2GT 2 5.8 7.2
090105B M 2.50 PD3GT 2 5.0 8.4
090106 M 2.60 D2GT+e&Oa 1 13.2
090110A M 2.60 PD2GT 2 7.4 8.1
090110B M 2.25 PD3GT 2 5.9 4.8
090110C M 2.40 GPL 1 4.2 8.2
090111 M 2.25 GPL+D2GT 1 5.3 4.9 6.7
090112A F 1.85 PD2GT (air mode) 1 10.2
090114A M 2.50 PD2GT 2 9.3 5.9
090114B M 2.20 GPL+D2GT 2 4.3 6.2 6.7 2.4 7.2
090116A M 2.15 PD2GT (air mode) 2 5.7 6.9
090116B M 2.30 GPL+D2GT 2 4.4 9.0 4.1 1.2 8.8
090118A M 2.30 PD2GT (air mode) 2 4.4 3.9
090118B M 2.35 GPL+D2GT 2 7.6 10.8 22.4 10.9 26.2
090120A M 2.50 PD2GT (air mode) 2 5.6 4.8
090120B M 2.35 GPL+D2GT 2 6.8 10.2 8.1 14.2
090122A M 2.35 PD2GT (air mode) 2 7.0 8.0
090122B F 2.00 GPL+D2GT 2 3.0 3.2 1.3 1.4
Grand mean 2.31 6.5 8.1
for depth, temperature and GPS positions, 1/32 or 1/64s for accelerations, and 1, 1/4 or 1/8s for speed. All loggers had enough memories to record for the full deployment periods. GPS loggers [MiniGPSlog, 47mm in length, 32mm in width, 19mm in depth (with rounded corners), 25g in air; earth&OCEAN Technologies, Kiel, Germany] were deployed with the D2GT data loggers for some birds (Table1); data from these loggers are not reported in this paper. Data loggers in this study weighed 2.8% of the birds’ body mass on average, which is relatively large and could potentially impact their flight and diving behaviour. Although we could not fully examine possible negative effects, the occasional regurgitations of the study birds during the data logger removal, and our unpublished observations with camera loggers (80g), showed that the birds were successfully foraging. No birds equipped with data loggers abandoned their nests. Moreover, the relationship between dive depth and duration observed in this study (data not shown) closely resembled that reported previously with smaller data loggers (30g) for the same species (Cook et al., 2008). Therefore, we assumed that the behaviour of study birds was not substantially altered, although further miniaturization of loggers is clearly needed in the future.
Flight air speed
The PD2GT and PD3GT data loggers have a propeller as the speed sensor. The shaft of the propeller has a magnet on the other side, so that the rotation of the propeller is detected as the magnetic signal. Normally, the propeller rotates well in the water when the animal is swimming, but not in the air when the animal is flying (‘normal mode’; Fig.1A). However, by adjusting the tightness of the nut on the propeller, it can be modified so that it works well in the air but not in the water (Fig.1B). In this ‘air mode’, the propeller idles relative to the shaft (therefore the rotation value is not recorded) when speed is low, whereas it rotates with the shaft as in normal
mode when speed is high. Introducing the idle phase prompts the start of the propeller rotation, making it possible to record relative air speed during flight. The propeller loggers were set in normal mode for eight birds and in air mode for five birds (Table1). In the case of one bird (ID: 090122B), air mode was accidentally switched to normal mode while the bird was at the nest (presumably by the pecks of the bird), resulting in air mode on the first day and normal mode on the second day.
Calibration experiments were made using the wind tunnels of Meisei University and Kogakuin University, Tokyo, Japan. The propeller loggers in air mode were set in front of the tunnel, and air speed was increased from 3 to 24ms–1with an increment of
3ms–1. At 3ms–1, the propeller did not rotate continuously. At
24ms–1, it rotated continuously, but the rotation values recorded
were very low, indicating that it idled relative to the shaft. At the medium range of 6–21ms–1, the propeller rotation was correctly
recorded and stable within ±3revs–1(±0.2m s–1) around the mean
value at each speed, except for infrequent instantaneous drops by ~20revs–1(1.5ms–1) at the speed of 21ms–1. At this range, the mean
propeller rotation (Y, revs–1) increased with air speed (X, ms–1)
highly linearly as:
Y13.3X– 63.6 (N6, R2>0.999). (1)
Using this equation, the rotation value recorded during flight was converted into flight air speed.
Moreover, the effect of off-axis flow was examined with the tunnel at an air speed of 12ms–1(close to the flight speed of shags;
see Results) by setting the logger at an angle of 0 (head wind) to 90deg (side wind) from the wind direction, with an increment of 10deg. The propeller rotation decreased with the angle, and stopped at 80 and 90deg. From 0–40deg, the propeller rotation recorded at each angle agreed well (within 7revs–1, or 0.5ms–1) with the value
A
B
1812
6
20:17 20:18 20:19 20:20
Time (h) 20
10 0
–40 0 40 200
100
0
Depth (m)
Acceler
a
tion
(m
s
–2
)
Propeller
rot
a
tion (
s
–1
) Dive Surface Flight
200
100
0
80 40 0
–40 0 40
3
2 1 0
Flight
a
ir
s
peed (m
s
–1
)
Depth (m)
Acceler
a
tion
(m
s
–2
)
Propeller
rot
a
tion (
s
–1
)
S
wim
s
peed
(m
s
–1
)
17:02 17:04 17:06 17:08 17:10
Time (h)
Flight
Surface
predicted from the component of the air speed vector along the propeller logger axis [i.e. 12ms–1⫻cos(angle)] and Eqn 1. This
indicates that, if birds experience off-axis flow during forward flight, the propeller logger records the component of the total flow vector along the flying direction.
Wing morphology
Estimating the flight power curve of birds (see below) requires morphological information, including wingspan (i.e. distance from one wing tip to the other, with wings at full stretch) and wing area (i.e. area of both wings including the part of the body between the wings, projected on a flat surface). Therefore, in addition to the behavioural study, we captured 24 shags (12 males and 12 females) and traced their wings on a paper, before releasing them. A digital picture of the wing trace was taken with a reference square of known area, and the pixels of the wing trace and of the square were counted using IGOR Pro (WaveMetrics Inc., Lake Oswego, OR, USA) to calculate wing area. The mean values were used to estimate the flight power curve of Kerguelen shags (Table2). Aspect ratio (dimensionless) was calculated as wingspan (m) squared divided by wing area (m2). Wing loading (Nm–2) was calculated as body weight
[i.e. body mass (kg)⫻g(9.8ms–2)] divided by wing area (m2).
Flight power curve
To interpret the measured flight air speed, the theoretical U-shaped
curve that represents relationship between the mechanical power requirement and flight speed is useful (Tobalske, 2007; Pennycuick, 2008). It indicates the two characteristic speeds: minimum power speed (Vmp, the speed at which the power requirement is minimum)
and the maximum range speed (Vmr, the speed at which the distance
flown with a given energy is maximum). Vmris equivalent to the
speed that minimizes energy expenditure per distance travelled. The Pennycuick and Norberg models (Pennycuick, 2008; Norberg, 1990) are widely used to estimate the power curve, with different assumptions for the profile power (see below). Because any existing aerodynamic models have uncertainties that can cause biased results (Rayner, 1999), we used both models and compared the results.
In both models, the total mechanical power for flight (P, W) can be expressed as:
PPind+ Ppar+ Ppro, (2)
where Pindis the induced power (i.e. the power needed to impart
downward momentum of the air at a sufficient rate to support body weight), Ppar is the parasite power (i.e. the power needed to
overcome the drag of the body, excluding the wings) andPprois
the profile power (i.e. the power needed to overcome the drag of the wings). Pindis calculated as:
Pind2km2g2/ VB2, (3)
where kis the induced power factor (dimensionless), mis the body mass (kg), gis the acceleration due to gravity (9.8ms–2), Vis the
flight air speed (ms–1), Bis the wingspan (m) and is the air density
(kgm–3). P
paris calculated as:
Ppar0.5SbCdV3, (4)
where Sb is the frontal area of the body (m2) and Cd is the drag
coefficient based on frontal area (dimensionless). In the Pennycuick model (Pennycuick, 2008), Pprois assumed to be independent of V
for the range of Vthat birds normally use, for the following reason. Pprodepends on the airflow over the wings, which can be divided
into two components: the airflow due to the forward movements of the bird and that due to flapping motion. Although the first component increases with V, the second component decreases with Vdue to decreased flapping frequency and amplitude, resulting in the total airflow that is approximately independent of V. Pproin the
Pennycuick model (Pennycuick, 2008) is calculated as:
Ppro(4km2g2/ 3B22SbCd)1/4CproSw/ B2, (5)
where Cprois the profile power coefficient (dimensionless) and Sw
is the wing area (m2). In the Norberg model (Norberg, 1990), P pro
is assumed to depend on V, and is calculated as:
Ppro0.5SwC⬘proV3, (6)
where C⬘pro is the profile power coefficient for this model
(dimensionless). Pwas then converted into the total metabolic power of the bird (M, W) as:
MR(P/ + MB), (7)
where Ris the respiration factor (dimensionless), is the efficiency to convert the mechanical power for flight into the metabolic power for flight (dimensionless) and MBis the basal metabolic rate (W)
(Pennycuick, 2008). MBwas estimated using the allometric equation
specific to seabirds (Ellis and Gabrielsen, 2002):
MB5.43m0.72. (8)
For each model, Vmp and Vmr were calculated as the V that
minimizes M and M/V (which represents metabolic energy
expenditure per distance travelled), respectively. In fact, converting Pinto M is not necessary to obtain Vmp, because Pand M are
minimized at the same V, as long as R, and MBare independent
of V (see Eqn 7). The parameters were set as follows: k1.2 (Pennycuick, 2008), m2.4 (the measured body mass + the mass of the propeller logger), B1.18 (measured), 1.26, S0.0149 (the frontal area of birds calculated from girth measurements + the frontal area of the propeller logger), Sw0.18 (measured), Cpro8.4
(Pennycuick, 2008), C⬘pro0.02 (Rayner, 1979), R1.1 (Pennycuick,
2008) and 0.23 (Pennycuick, 2008). Cd is among the most
influential parameters and is notoriously difficult to measure (Hedenstrom and Liechti, 2001; Pennycuick, 2008). We used the Cdvalue measured from captive cormorants gliding in the water
(0.28) (Ribak et al., 2005). Our application of Cdmeasured in water
to flight in air is justified by the fact that the Reynolds numbers of the shag’s body were similar between flight (5.4⫻105) and
swimming (6.4⫻105) in this study. In other words, flight and
swimming were dynamically similar (Alexander, 2003) with respect to the flow pattern around the body, despite the difference in media. An underlying assumption of these aerodynamic models is that birds are in level steady flight, without changes in potential or kinetic energy. Visual observations suggest that this assumption is generally met (see supplementary material Movie 1); however, shags do sometimes descend or ascend during flight. We therefore examined the sensitivity of Vmp and Vmr to the change of flight angle. In
[image:4.612.45.296.654.723.2]descending and ascending flight, the total mechanical power (P⬘,
Table 2. Wing morphology of Kerguelen shags
Male (N=12) Female (N=12) Pa
Body mass (kg) 2.5±0.2 2.2±0.1 <0.001 Wing span (m) 1.21±0.04 1.15±0.03 <0.0001 Wing area (m2) 0.19±0.01 0.17±0.01 <0.0005
Aspect ratio 7.7±0.4 7.6±0.3 0.61 Wing loading (N m–2) 127±12 126±10 0.81
Data are means ± s.d.
W) could be estimated by adding the rate of change in potential energy (PPE, W) to the right side of the Eqn 2 (Berg and Biewener,
2008) as:
P⬘Pind+ Ppar+ Ppro+ PPE. (9)
PPEcan be expressed as:
PPEmgVsin, (10)
where is the flight angle relative to the horizontal (deg), with positive values indicating ascent and negative descent. Replacing Pin Eqn 7 with P⬘allowed us to estimate Vmpand Vmrin ascending
and descending flight. For example, by changing from 0 (level flight) to 5deg (slightly ascending flight), Vmpdecreased by 3.8 and
2.6ms–1in the Pennycuick and Norberg models (Pennycuick, 2008;
Norberg, 1990), respectively. By changing from 0 (level flight) to –5deg (slightly descending flight), Vmp increased by 5.4 and
3.4ms–1in the Pennycuick and Norberg models (Pennycuick, 2008;
Norberg, 1990), respectively. These calculations show that the estimate for Vmpis indeed sensitive to the change of flight angle.
By contrast, Vmrwas not affected by in either model. (This can
be explained mathematically. Equating the first derivative of M/V with respect to Vto zero gives Vmr. The term is eliminated during
the process.) In this study, the estimated Vmpand Vmr, assuming
level steady flight, were compared only with the mean flight air speed of relatively long flights (>30s), where the effect of unsteady flight condition (takeoff, landing and possible occasional descent or ascent in the middle of flight) is expected to be small.
Behavioural data analysis
We used IGOR Pro with the package Ethographer (Sakamoto et al., 2009) to analyse the behavioural data. On the basis of acceleration and depth data, behaviour was categorized into diving, flight, stay at the sea surface and stay on land. Diving was defined as periods with depth >1m, and flight was detected by high-frequency and high-amplitude fluctuation of dorso-ventral acceleration (Fig.1). To distinguish between stay at the sea surface and stay on land, we used pitch angle, which is close to horizontal at the sea surface and upright on land. Pitch angle was calculated from low-frequency signals of longitudinal acceleration, and the values recorded just before the release of the birds was corrected to the horizontal level, because we kept the birds horizontally for ~10s before releasing. The dominant wingbeat frequency during flights was calculated for each individual, as the peak frequency in the power spectral density analysis of the dorso-ventral accelerations (Sato et al., 2007). The propeller rotation values recorded during swimming were converted into actual swim speed (ms–1), based on an in situcalibration method
using depth change and pitch angle (Sato et al., 2003). GPS positions were converted into UTM coordinates using Ethographer, allowing us to calculate the distance between the positions (and hence flight ground speed), accounting for the fact that the Earth’s surface is not flat. As for mean air speed, the mean ground speed was calculated only for relatively long flights (>30s), so that the effect of unsteady flight condition could be minimized.
To test the relationships between the behavioural parameters, we used generalized linear mixed models (GLMM) with individuals as a random effect, using the software R and the package lme4 (The R Project for Statistical Computing, http://www.r-project.org/). The most parsimonious model was selected on the basis of Akaike’s information criterion, and a chi-square test was used to determine the effect of term in the selected model. Statistical significance was set at P<0.05. Means (±s.d.) are reported.
RESULTS
All instrumented birds made foraging trips every day, and parameters for flights and diving were recorded (Tables1, 3 and 4). Acceleration records from 25 birds showed that flights were short, with a grand mean of 104s (max. 1098s) for males and 51s (max. 534s) for females. Males flew for significantly longer durations than females (GLMM, 25.2, P<0.05, N741). The frequency distribution of flight
duration had a peak at 0–30s with a long tail for both males and females (Fig.2). Flight air speed was recorded for a total of 61 flights (>30s) for five birds (grand mean 12.7ms–1; Table3, Fig.3), excluding
some flights where the propeller stopped temporarily. Flight ground speed was recorded for a total of 160 flights (>30s) for six birds (grand mean 13.0ms–1; Table3). The mean value was similar between
air and ground speed, but ground speed was much more variable than air speed, as shown by a higher standard deviation. Diving behaviour was recorded for 25 birds, with a grand mean dive depth of 27.7m (max. 94.2m) for males and 10.4m (max. 26.0m) for females, and
60
40
20
0
20 15
10 5
0
Flight duration (min)
No
. of flight
s
140 160
Male Female
Fig.2. Frequency distribution of flight duration for male (16 birds pooled) and female (nine birds pooled) Kerguelen shags.
20
10
0
30 20
10 0
90
60
30
0
Mech
a
nic
a
l po
w
er (W)
No
. of flight
s
Flight air speed (m s–1)
Min. power Max. range
a grand mean dive duration of 110s (max. 306s) for males and 53s (max. 154s) for females (Table 4). Males dived significantly deeper (GLMM, 27.5, P<0.01, N4084) and for longer durations (GLMM,
27.9, P<0.005, N4084) than females.
GPS position, depth and acceleration were simultaneously recorded for six birds, providing the tracks of foraging trips and the records of diving behaviour. Dive depths were generally consistent with the local sea depth, although some dives were much shallower (Fig.4). Each trip consisted of the periods of flight, stay at the sea surface and diving (Fig.5), with the maximum distance from the colony ranging from 1.4 to 26.2km (Table1). Flights were not always followed by diving interrupted by a surface period, but were often followed by another flight interrupted by a surface period. This flight–surfacing–flight sequence was observed even when the birds were heading directly back to the colony (Fig.5). Based on the acceleration data from 25 birds, 206 of 695 flights (29%) were followed by another flight rather than diving interrupted by a surface period. In these flight–surfacing– flight sequences, the duration of the first flight was positively related to the subsequent surface duration (GLMM, 221.0, P<0.0001;
Fig.6).
According to the Pennycuick model (Pennycuick, 2008), the values of Vmpand Vmrof Kerguelen shags were 13.2 and 19.8ms–1,
with the mechanical power required equal to 39 and 47W, respectively. The observed speeds agreed well with Vmp, and were
much lower than Vmr (Fig.3). According to the Norberg model
(Norberg, 1990), the values of Vmpand Vmrwere 11.3 and 15.2m s–1,
with the mechanical power required equal to 28 and 33W, respectively. The observed speeds agreed better with Vmpthan with
Vmr, although the difference was less clear than in the Pennycuick
model (Pennycuick, 2008).
DISCUSSION
Direct measurement of flight air speed
The power requirement for flapping flight is high and is directly affected by air speed (Norberg, 1990; Pennycuick, 2008). Therefore, recording flight air speed is important not only in biomechanics but also in the ecology of flying animals (Hedenstrom and Alerstam, 1995). We provided, to our knowledge, the first direct measurement
30
3
0
60 90 120 150 180 210
300 330
360
360 342045090
70°00⬘ 70°20⬘ 70°40⬘ 71°00⬘
–49°30⬘ –49°20⬘ –49°10⬘
Dive depth (m)
0 90
30 m 60 m90 m
10 km
45 Kerguelen
Study site
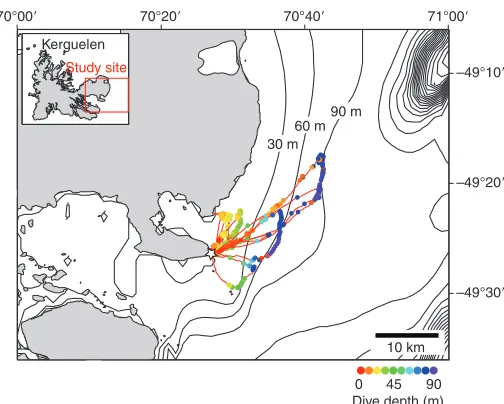
[image:6.612.45.572.80.373.2]Fig.4. GPS tracks of six Kerguelen shags, with the location and depth of dives (colour circles) overlaid on the bathymetric map. The star indicates the location of the colony.
Table 3. Flight behaviour of Kerguelen shags
Flight duration (s) Total flight duration (s day–1)
Individual Mean Max. Air speed (m s–1) Ground speed (m s–1) Wingbeat frequency (Hz) Day 1 Day 2
081223A 126±165 511 (8) 6.1 1005
081223B 169±136 372 (12) 5.6 2025
081224A 52±31 111 (16) 6.3 834
081224B 48±40 131 (15) 5.6 721
081226A 100±77 311 (19) 5.7 1900
081226B 63±57 229 (18) 6.0 1131
090101A 91±122 534 (15) 5.9 1367
090101B 19±16 105 (104) 6.0 1489 507
090105A 266±282 1098 (18) 5.8 2553 2230
090105B 104±114 383 (31) 5.8 2105 1123
090106 61±80 310 (16) 5.8 977
090110A 167±151 608 (28) 6.2 2313 2365
090110B 78±55 190 (10) 6.2 386 396
090110C
090111 31±22 112 (23) 12.8±5.6 (9) 6.0 718
090112A 59±43 214 (25) 11.7±0.7 (19) 6.2 1478
090114A 68±130 811 (42) 6.1 1335 1515
090114B 123±106 389 (22) 14.6±5.2 (21) 6.0 1429 1272
090116A 48±38 200 (41) 10.9±0.7 (12) 5.8 1067 887
090116B 94±107 476 (16) 14.7±3.0 (17) 6.2 609 900
090118A 66±76 273 (26) 13.6±0.8 (8) 5.7 913 794
090118B 122±150 788 (74) 11.0±3.5 (55) 5.8 4425 4619
090120A 55±50 220 (40) 13.7±0.9 (10) 6.1 1155 1048
090120B 97±102 352 (36) 12.2±5.5 (27) 5.9 1708 1776
090122A 147±191 837 (44) 13.7±0.3 (12) 5.8 3789 2673
090122B 37±24 142 (42) 12.5±4.0 (31) 6.1 558 1013
Grand mean 92 388 12.7 13.0 5.9 1465
[image:6.612.316.568.506.708.2]of flight air speed in wild birds. According to the calibration experiments using the wind tunnel, the range of air speed that can be measured with our propeller loggers was between 6 and 21ms–1,
which covers the normal speed of most flying birds (Welham, 1994; Bruderer and Boldt, 2001; Alerstam et al., 2007). Although we have no independent data to validate the field measurement of flight air speed, similar mean values of air and ground speed during flights suggest that our measurement is reasonable. This is because the shags made return foraging trips from the colony (see Fig.5), and hence the effect of wind (which is shown by the difference between air and ground speed) during the trips is expected to sum to zero.
Our method using propeller loggers has several advantages over conventional ground-based methods, in which flight speed relative to the ground is measured using stopwatches (Elliott and Gaston, 2005), radar (Alerstam et al., 2007), theodolites (Pennycuick, 2008) or hydrophone arrays, e.g. in bats (Grodzinski et al., 2009), and then wind speed is subtracted to obtain air speed. First, our method does not require information on the speed and direction of the wind experienced by the animals, which is difficult to measure. Second, it does not require the animals to fly closely to the observers, and hence air speed can be recorded continuously for long periods. Third, our propeller loggers provide data on several behavioural parameters,
such as acceleration, in addition to flight air speed. However, the size of the propeller logger (60g) is currently limiting its application to relatively large birds. Nevertheless, this method has a great potential in the studies of flying animals.
Flight and diving capability
According to the Pennycuick model (Pennycuick, 2008), the minimum mechanical power required for flight (i.e. the power at Vmp) was 39W in Kerguelen shags. Independently, the maximum
aerobically sustainable mechanical power available for flight in a 2.3kg shag can be estimated to be 39W, by assuming that the bird has flight muscles equal to 17% body mass (Bishop and Butler, 1995) and that 1kg of flight muscle generates the maximum mechanical power of 100W (Marden, 1994). Similar estimates of the power required (39W) and the power available (39W) suggest that the flight of Kerguelen shags is near the limit of aerobic metabolism. According to the Norberg model (Norberg, 1990), the minimum mechanical power required is 28W, which is less than the estimate for the mechanical power available (39W), suggesting that shags have enough aerobic power to fly at least at Vmp.
Nevertheless, their flight speed is predicted to be limited to <17.3ms–1, above which the power required exceeds the power
available. Overall, these analyses suggest that Kerguelen shags do not have a large margin of power available relative to the power required during flight, and that their flight capabilities are physiologically limited. These analyses might be an oversimplification, because: (1) there are inevitable uncertainties in the aerodynamic models (Rayner, 1999), and (2) the mass-specific mechanical power of flight muscles might change depending on several factors, including wing kinematics, flight speed, body size (Tobalske, 2007) and the composition of muscle fibres (Bishop, 2005). However, as shown below, our empirical data on the free-ranging flight behaviour support the suggestion.
Flight duration was only 92s on average, which means that shags flew only ~1km during each flight at a mean ground speed of 13ms–1. The sum of flight durations in a day was only 0.4h on
average, which is similar to the value of the common eider Somateria mollissima (0.2hd–1) (Pelletier et al., 2008), a large sea
duck that is presumably at the limit of flight capability (Guillemette and Ouellet, 2005). Most birds fly for a longer daily duration, with
12
8
4
0
22:30 22:45 22:30 22:45 Time (h)
60 40 20 0
–40 –20 0 20 40
Di
s
t
a
nce from
the colon
y (km)
–49.44 –49.42 –49.40 –49.38
70.45 70.50 70.55 70.60
Longitude (deg)
L
a
tit
u
de (deg)
Flight Surface Diving
2 km
Depth (m)
Acceler
a
tion
(m
s
–2
)
A
B
Fig.5. (A)GPS track of a foraging trip made by a Kerguelen shag (bird ID: 090120B), with behavioural categories including flight (pink), stay at the sea surface (grey), and diving (blue). The star indicates the location of the colony. (B)Time-series data (distance from the colony, depth and dorso-ventral acceleration) on the way back to the colony, including the last deep dive (the part of the GPS track shown by the dashed line in A). Note that the bird stayed at the surface without diving between flights, which is suggestive of resting. Colour codes are as in A.
Flight duration (min)
Subs
e
qu
ent
su
rf
a
ce d
u
r
a
tion (min)
0.01 0.1 1 10 100
0.1 1 10 100
a mean value of 4.1hd–1(Pelletier et al., 2008), although available
information is limited. Note, however, that short flights do not necessarily indicate poor flight capability, because shags may not need to fly longer because of the presence of prey near the colony. According to the simultaneous records of GPS position, depth and acceleration, the shags sometimes stayed at the sea surface without any diving activity between flights, even when they were headed directly back to the colony. In such flight–surfacing–flight sequences, the duration of the first flight was positively related to the subsequent surface duration. These observations suggest that surfacing periods have a function of rest, and that longer flights require longer surfacing periods. This is analogous to the observations of breath-hold diving animals, where longer dives require longer surfacing periods, especially when anaerobic metabolism is incorporated during the dives (Kooyman, 1989). Thus, the short flight durations in the shags are likely due to their physiological limitations, rather than their environment.
Moreover, the measured flight air speeds were close to Vmpand
lower than Vmr, especially when the Pennycuick model (Pennycuick,
2008) was applied. The Norberg model (Norberg, 1990) produced a steeper flight power curve (where high speed is very expensive) and hence lower Vmr. This difference is expected from the different
assumption for profile power, which is proportional to speed cubed in the Norberg model (Norberg, 1990) (Eqn 6) and is speed-independent in the Pennycuick model (Pennycuick, 2008) (Eqn 5). Our observation of flight speed close to Vmpcontrasts with optimal
flight theories, which predict that birds feeding chicks (as the shags in this study) should fly faster than Vmr to maximize energy
delivered to the chicks (Norberg, 1981; Hedenstrom and Alerstam, 1995). Instead, our observation agrees with the suggestion that shags do not have a large margin of power available relative to the power
required during flight. Flight at Vmpwas presumably the practical
choice for the shags without relying heavily on anaerobic metabolism, compared with Vmr, which requires higher power. A
similar suggestion was previously made for the European shag P. aristotelis, based on the flight speed measured by theodolites (Pennycuick, 1987). Our results may be due to the negative effect of the logger attached; however, note that we included the mass and frontal area of the loggers in the power curve calculation, which means that the device effect was accounted for, although the possible increase in drag coefficient (resulting from the change in the body outline) could not be ruled out. Overall, our behavioural and biomechanical analyses support the prediction that flight performance is limited in Kerguelen shags.
By contrast, their diving performance was remarkable. The maximum recorded dive depth (94m) and duration (306s) are similar to the previous records of the same species and other blue-eyed shags, and are much greater than those of non-blue-eyed cormorants (Quintana et al., 2007; Cook et al., 2008). These values are close to the records of penguins, when the effect of size is accounted for (Schreer and Kovacs, 1997). A large variation in dive depth among individuals and between sexes (Table4) is clearly explained by the variation in depth of the foraging sites: individuals foraging at the deeper coastal area dived deeper (Fig.4). This is consistent with observations that Kerguelen shags prey on benthic animals, including nototheniid fishes (T. R. Cook, C.-A.B. and Y. Cherel, unpublished) and polychaetes (Y.Y.W. and C.-A.B. unpublished).
The compromise
[image:8.612.45.579.80.373.2]The contrasting performances of flight and diving in Kerguelen shags are presumably interrelated through their morphological characteristics. First, Kerguelen shags are large (mean 2.3kg) among
Table 4. Diving behaviour of Kerguelen shags
Dive depth (m) Dive duration (s) Swim speed (m s–1) Total dive duration (s day–1)
Individual Mean Max. Mean Max. Descent Ascent Day 1 Day 2
081223A 32.5±23.9 58.4 (19) 116±88 215 (19) 2201
081223B 27.6±21.7 76.7 (104) 89±69 270 (104) 9254
081224A 1.9±0.9 5.0 (331) 27±7 45 (331) 8811
081224B 17.8±4.8 23.9 (142) 90±30 154 (142) 12855
081226A 31.8±10.9 41.4 (57) 135±50 208 (57) 7680
081226B 11.9±9.2 25.0 (95) 64±50 145 (95) 1.48±0.03 (42) 1.56±0.06 (42) 6096 090101A 16.7±3.8 23.9 (180) 66±18 111 (180) 1.35±0.11 (32) 1.56±0.18 (32) 11848
090101B 2.0±1.0 8.0 (625) 14±8 44 (625) 7047 1416
090105A 48.7±20.5 79.8 (58) 171±73 261 (58) 1.54±0.24 (47) 1.64±0.18 (47) 4601 5334 090105B 26.3±27.7 74.0 (124) 95±89 256 (124) 1.49±0.08 (40) 1.51±0.13 (40) 5313 6459
090106 14.4±27.8 94.2 (184) 51±81 285 (184) 9403
090110A 24.2±12.4 35.3 (166) 105±55 194 (166) 1.63±0.08 (92) 1.69±0.11 (92) 8639 8810 090110B 16.5±7.6 24.3 (172) 92±40 144 (172) 1.43±0.06 (99) 1.60±0.10 (99) 8911 6951 090110C
090111 21.1±11.4 31.1 (65) 96±50 154 (65) 6228
090112A 13.8±8.7 26.0 (179) 70±45 125 (179) 12610
090114A 14.0±23.0 81.3 (307) 57±79 286 (307) 1.52±0.09 (45) 1.67±0.10 (45) 11495 5913
090114B 18.7±4.8 28.5 (153) 92±22 148 (153) 5764 8382
090116A 18.7±4.8 28.3 (193) 90±29 140 (193) 8542 8802
090116B 20.6±7.1 31.9 (173) 113±41 187 (173) 6619 12934
090118A 23.1±8.0 29.2 (88) 124±50 172 (88) 6946 3933
090118B 40.7±37.2 91.8 (143) 130±113 291 (143) 6806 11848
090120A 18.5±8.3 29.8 (232) 68±36 152 (232) 8947 6792
090120B 51.3±28.4 90.8 (94) 177±92 306 (94) 7734 8893
090122A 65.6±20.5 84.9 (72) 234±64 296 (72) 1.56±0.02 (33) 1.52±0.12 (33) 7718 9124
090122B 10.3±5.5 16.7 (128) 51±25 95 (128) 2902 3650
Grand mean 23.5 45.6 97 187 1.50 1.59 7824
seabirds that exhibit flapping flight. Large body mass is disadvantageous for flapping flight, because power requirement increases with size more rapidly than the power available (Pennycuick, 2008). By contrast, it is advantageous for breath-hold diving, because oxygen storage capacity increases with size more rapidly than the rate of oxygen metabolism, enabling larger animals to dive deeper and longer (Halsey et al., 2006). Second, the wings of cormorants are characterized by a low aspect ratio (7.6 in this study) and a short wingspan (1.2m in this study) for their size among seabirds (Gaston, 2004). A different expression for this characteristic is a high wing loading for their size (127Nm–2in this study), although auks have
higher wing loading for their size (Gaston, 2004). Short wings are disadvantageous for flapping flight because of increased induced power (see Eqn 3). By contrast, short wings are advantageous for diving, because they decrease the magnitude of positive buoyancy (because of decreased air volume in the feathers) and drag (because of decreased body surface area) in the water, and hence the cost of swimming (Wilson et al., 1992; Wilson et al., 2008). Third, the flight muscles of cormorants are small among flying birds (17% of body mass) (Bishop and Butler, 1995), limiting the power available for flight. This is presumably related to their large leg muscles (10–12% body mass, compared with 4.5–5.5% in non-diving pelicans) (Nelson, 2005), which provides power for swimming. In foot-propelled swimmers, such as cormorants, loons, grebes and ducks, different muscles are used for flight and swimming, and flight and leg muscles cannot be equally powerful while maintaining body size. Wing-propelled swimming, observed in auks, diving petrels and some shearwaters, is an evolutionary solution for the conflict of muscle allocation; however, these birds face other conflicts, including the design of wings (which cannot be efficient in both air and water) (Pennycuick, 2008) and the myoglobin concentration in the locomotor muscles (Croll et al., 1992; Davis and Guderley, 1987).
Our results have implications for the ecology and evolution of seabirds. First, the compromise between flight and diving might be a major factor in determining their three-dimensional foraging range, with horizontal and vertical components limited by flight and diving capability, respectively. Poor flyers have a limited horizontal foraging range, which might be compensated by their great diving capability, and vice versa. Note, however, that such relationship is mediated by the local bathymetry in bottom-feeders, such as Kerguelen shags. Because of the shallow bathymetry of the Kerguelen archipelago and the great diving capability of Keguelen shags, a relatively large horizontal area (<26km offshore from the colony) with respect to their limited flight capability was utilised by the shags (Fig.4). Second, an extreme of the compromise between flight and diving would be flightless birds with enhanced diving capability, which is in fact found in Galápagos cormorants (Wilson et al., 2008). Our empirical data on deep-diving seabirds capable of flight agree with the results of Wilson et al. (Wilson et al., 2008), which suggest that giving up flight ability prompted the evolution of great diving capability in Galápagos cormorants.
In conclusion, we provided detailed records of flight behaviour in Kerguelen shags, including the first direct measurement of flight air speed using propeller loggers. Their flight performance was poor, as indicated by: (1) short flight duration; (2) surfacing behaviour between flight events, suggestive of resting, with the positive relationship between flight duration and subsequent surface duration; and (3) flight air speed close to the theoretical Vmprather than Vmr.
These results are presumably related to the great diving capability of Kerguelen shags through their morphological adaptations for diving, including large body mass, small flight muscles and short wings. The compromise between flight and diving, and the local
bathymetry, shape the three-dimensional foraging range in this bottom-feeding cormorant.
ACKNOWLEDGEMENTS
We thank Y. Charbonnier, C. Guinet and J.-B. Pons for help in the field; S. Ito and M. Ogata for help with the wind-tunnel experiments; K. Q. Sakamoto for help with data analysis; G. Ribak for providing supplemental information for the published work; and L. G. Halsey for comments on the manuscript. We also acknowledge use of the Maptool program (http://www.seaturtle.org/) for the map of study site. This work was funded by the program Bio-logging Science of the University of Tokyo (UTBLS), Grant-in-Aids for Scientific Research from the Japan Society for the Promotion of Science (JSPS) (21681002 to Y.Y.W., 20310016 to A.T. and 19255001 to K.S.) and the Institut Polaire Français Paul-Emile Victor (IPEV, program no. 394, supervisor: C.-A.B.).
REFERENCES
Alerstam, T., Rosén, M., Bäckman, J., Ericson, P. G. P. and Hellgren, O.(2007). Flight speeds among bird species: allometric and phylogenetic effects. PLoS Biol. 5, e197.
Alexander, R. McN.(2003). Principles of Animal Locomotion. Princeton: Princeton University Press.
Berg, A. M. and Biewener, A. A.(2008). Kinematics and power requirements of ascending and descending flight in the pigeon (Columba livia). J. Exp. Biol. 211, 1120-1130.
Bishop, C. M.(2005). Circulatory variables and the flight performance of birds. J. Exp. Biol. 208, 1695-1708.
Bishop, C. M. and Butler, P. J.(1995). Physiological modelling of oxygen consumption in birds during flight.J. Exp. Biol. 198, 2153-2163.
Bruderer, B. and Boldt, A.(2001). Flight characteristics of birds: I. Radar measurements of speeds. Ibis143, 178-204.
Cook, T. R., Lescroël, A., Tremblay, Y. and Bost, C.-A.(2008). To breathe or not to breathe? Optimal breathing, aerobic dive limit and oxygen stores in deep-diving blue-eyed shags. Anim. Behav. 76, 565-576.
Croll, D. A., Gaston, A. J., Burger, A. E. and Konnoff, D.(1992). Foraging behavior and physiological adaptation for diving in thick-billed murres. Ecology73, 344-356.
Dall’Antonia, L., Gudmundsson, G. and Benvenuti, S.(2001). Time allocation and foraging pattern of chick-rearing razorbills in northwest Iceland.Condor103, 469-480.
Davis, M. B. and Guderley, H.(1987). Energy metabolism in the locomotor muscles of the common murre (Uria aalge) and the Atlantic puffin (Fratercula arctica). Auk
104, 733-739.
Elliott, K. H. and Gaston, A. J.(2005). Flight speeds of two seabirds: a test of Norberg’s hypothesis. Ibis 147, 783-789.
Ellis, H. I. and Gabrielsen, G. W.(2002). Energetics of free-ranging seabirds. In Biology of Marine Birds (ed. E. A. Schreiber and J. Burger), pp. 359-408. Boca Raton: CRC Press.
Gaston, A. J.(2004). Seabirds: a Natural History. London: A and C Black.
Grodzinski, U., Spiegel, O., Korine, C. and Holderied, M. W.(2009). Context-dependent flight speed: evidence for energetically optimal flight speed in the bat Pipistrellus kuhlii? J. Anim. Ecol. 78, 540-548.
Guillemette, M. and Ouellet, J.-F.(2005). Temporary flightlessness in pre-laying common eiders Somateria mollissima: are females constrained by excessive wing-loading or by minimal flight muscle ratio. Ibis147, 293-300.
Halsey, L. G., Butler, P. J. and Blackburn, T. M.(2006). A phylogenetic analysis of the allometry of diving. Am. Nat. 167, 276-287.
Hedenstrom, A. and Alerstam, T.(1995). Optimal flight speed of birds. Philos. Trans. R. Soc. Lond. B Biol. Sci.348, 471-487.
Hedenstrom, A. and Liechti, F.(2001). Field estimates of body drag coefficient on the basis of dives in passerine birds. J. Exp. Biol. 204, 1167-1175.
Kooyman, G. L.(1989). Diverse Divers: Physiology and Behavior. Berlin: Springer-Verlag.
Lovvorn, J. R. and Jones, D. R.(1994). Biomechanical conflicts between adaptations for diving and aerial flight in estuarine birds. Estuaries17, 62-75.
Marden, J. H.(1994). From damselflies to pterosaurs: how burst and sustainable flight performance scale with size. Am. J. Physiol. 266, R1077-R1084.
Nelson, J. B.(2005). Pelicans, Cormorants and their Relatives. Oxford: Oxford University Press.
Norberg, R. A.(1981). Optimal flight speed in birds when feeding young. J. Anim. Ecol. 50, 473-477.
Norberg, U. M.(1990). Vertebrate Flight: Mechanics, Physiology, Morphology, Ecology and Evolution. Berlin: Springer-Verlag.
Pelletier, D., Guillemette, M., Grandbois, J.-M. and Butler, P. J.(2008). To fly or not to fly: high flight costs in a large sea duck do not imply an expensive lifestyle. Proc. R. Soc. Lond. B Biol. Sci. 275, 2117-2124.
Pennycuick, C. J.(1987). Flight of auks (Alcidae) and other northern seabirds compared with southern Procellariiformes: ornithodolite observations. J. Exp. Biol.
128, 335-347.
Pennycuick, C. J.(2001). Speeds and wingbeat frequencies of migrating birds compared with calculated benchmarks.J. Exp. Biol. 204, 3283-3294.
Pennycuick, C. J.(2008). Modelling the Flying Bird. London: Academic Press.
Quintana, F., Wilson, R. P. and Yorio, P.(2007). Dive depth and plumage air in wettable birds: the extraordinary case of the imperial cormorant. Mar. Ecol. Prog. Ser. 334, 299-310.
Rayner, J. M. V.(1979). A vortex theory of animal flight. II. The forward flight of birds. J. Fluid Mech. 91, 731-763.
Rayner, J. M. V.(1999). Estimating power curves of flying vertebrates. J. Exp. Biol.
Ribak, G., Weihs, D. and Arad, Z.(2005). Submerged swimming of the great cormorant Phalacrocorax carbo sinensis is a variant of the burst-and-glide gait. J. Exp. Biol. 208, 3835-3849.
Ropert-Coudert, Y. and Wilson, R.(2005). Trends and perspectives in animal-attached remote sensing. Front. Ecol. Environ. 3, 437-444.
Sakamoto, K. Q., Sato, K., Ishizuka, M., Watanuki, Y., Takahashi, A., Daunt, F. and Wanless, S.(2009). Can ethograms be automatically generated using body acceleration data from free-ranging birds? PLoS ONE4, e5379.
Sato, K., Mitani, Y., Cameron, M. F., Siniff, D. B. and Naito, Y.(2003). Factors affecting stroking patterns and body angle in diving Weddell seals under natural conditions. J. Exp. Biol. 206, 1461-1470.
Sato, K., Watanuki, Y., Takahashi, A., Miller, P. J. O., Tanaka, H., Kawabe, R., Ponganis, P. J., Handrich, Y., Akamatsu, T., Watanabe, Y. et al.(2007). Stroke frequency, but not swimming speed, is related to body size in free-ranging seabirds, pinnipeds and cetaceans. Proc. R. Soc. Lond. B Biol. Sci. 274, 471-477.
Sato, K., Daunt, F., Watanuki, Y., Takahashi, A. and Wanless, S.(2008). A new method to quantify prey acquisition in diving seabirds using wing stroke frequency. J. Exp. Biol. 211, 58-65.
Schreer, J. F. and Kovacs, K. M.(1997). Allometry of diving capacity in air-breathing vertebrates. Can. J. Zool. 75, 339-358.
Siegel-Causey, D.(1988). Phylogeny of the Phalacrocoracidae. Condor90, 885-905.
Thaxter, C. B., Wanless, S., Daunt, F., Harris, M. P., Benvenuti, S., Watanuki, Y., Grémillet, D. and Hamer, K. C.(2010). Influence of wing loading on the trade-off between pursuit-diving and flight in common guillemots and razorbills. J. Exp. Biol.
213, 1018-1025.
Tobalske, B. W.(2007). Biomechanics of bird flight. J. Exp. Biol. 210, 3135-3146.
Tremblay, Y., Cherel, Y., Oremus, M., Tveraa, T. and Chastel, O.(2003). Unconventional ventral attachment of time-depth recorders as a new method for investigating time budget and diving behaviour of seabirds. J. Exp. Biol. 206, 1929-1940.
Weimerskirch, H., Bonadonna, F., Bailleul, F., Mabille, G., Dell’Omo, G. and Lipp, H.-P.(2002). GPS tracking of foraging albatrosses. Science295, 1259.
Welham, C. V. J.(1994). Flight speeds of migrating birds: a test of maximum range speed predictions from three aerodynamic equations. Behav. Ecol. 5, 1-8.
Williams, T. M.(1999). The evolution of cost efficient swimming in marine mammals: limits to energetic optimization. Philos. Trans. R. Soc. Lond. B Biol. Sci.354, 193-201.
Wilson, R. P., Hustler, K., Ryan, P. G., Burger, A. E. and Noldeke, E. C.(1992). Diving birds in cold water: do Archimedes and Boyle determine energetic costs? Am. Nat. 140, 179-200.