RESEARCH ARTICLE
A Model for Selection of Eyespots on
Butterfly Wings
Toshio Sekimura1*, Chandrasekhar Venkataraman2*, Anotida Madzvamuse3
1Department of Biological Chemistry, Graduate School of Bioscience and Biotechnology, Chubu University, Kasugai, Aichi 487–8501, Japan,2School of Mathematics and Statistics, University of St Andrews, Fife, KY16 9SS, United Kingdom,3Department of Mathematics, University of Sussex, Falmer, BN1 9QH, United Kingdom
*[email protected](TS);[email protected](CV)
Abstract
Unsolved Problem
The development of eyespots on the wing surface of butterflies of the family Nympalidae is one of the most studied examples of biological pattern formation.However, little is known about the mechanism that determines the number and precise locations of eyespots on the wing. Eyespots develop around signaling centers, called foci, that are located equidistant from wing veins along the midline of a wing cell (an area bounded by veins). A fundamental question that remains unsolved is, why a certain wing cell develops an eyespot, while other wing cells do not.
Key Idea and Model
We illustrate that the key to understanding focus point selection may be in the venation sys-tem of the wing disc. Our main hypothesis is that changes in morphogen concentration along the proximal boundary veins of wing cells govern focus point selection. Based on pre-vious studies, we focus on a spatially two-dimensional reaction-diffusion system model posed in the interior of each wing cell that describes the formation of focus points. Using finite element based numerical simulations, we demonstrate that variation in the proximal boundary condition is sufficient to robustly select whether an eyespot focus point forms in otherwise identical wing cells. We also illustrate that this behavior is robust to small pertur-bations in the parameters and geometry and moderate levels of noise. Hence, we suggest that an anterior-posterior pattern of morphogen concentration along the proximal vein may be the main determinant of the distribution of focus points on the wing surface. In order to complete our model, we propose a two stage reaction-diffusion system model, in which an one-dimensional surface reaction-diffusion system, posed on the proximal vein, generates the morphogen concentrations that act as non-homogeneous Dirichlet (i.e., fixed) boundary conditions for the two-dimensional reaction-diffusion model posed in the wing cells. The two-stage model appears capable of generating focus point distributions observed in nature.
OPEN ACCESS
Citation:Sekimura T, Venkataraman C, Madzvamuse A (2015) A Model for Selection of Eyespots on Butterfly Wings. PLoS ONE 10(11): e0141434. doi:10.1371/journal.pone.0141434
Editor:Jordi Garcia-Ojalvo, Universitat Pompeu Fabra, SPAIN
Received:May 27, 2014
Accepted:October 8, 2015
Published:November 4, 2015
Copyright:© 2015 Sekimura et al. This is an open access article distributed under the terms of the Creative Commons Attribution License, which permits unrestricted use, distribution, and reproduction in any medium, provided the original author and source are credited.
Data Availability Statement:All relevant data are within the paper.
Result
We therefore conclude that changes in the proximal boundary conditions are sufficient to explain the empirically observed distribution of eyespot focus points on the entire wing sur-face. The model predicts, subject to experimental verification, that the source strength of the activator at the proximal boundary should be lower in wing cells in which focus points form than in those that lack focus points. The model suggests that the number and locations of eyespot foci on the wing disc could be largely controlled by two kinds of gradients along two different directions, that is, the first one is the gradient in spatially varying parameters such as the reaction rate along the anterior-posterior direction on the proximal boundary of the wing cells, and the second one is the gradient in source values of the activator along the veins in the proximal-distal direction of the wing cell.
Introduction
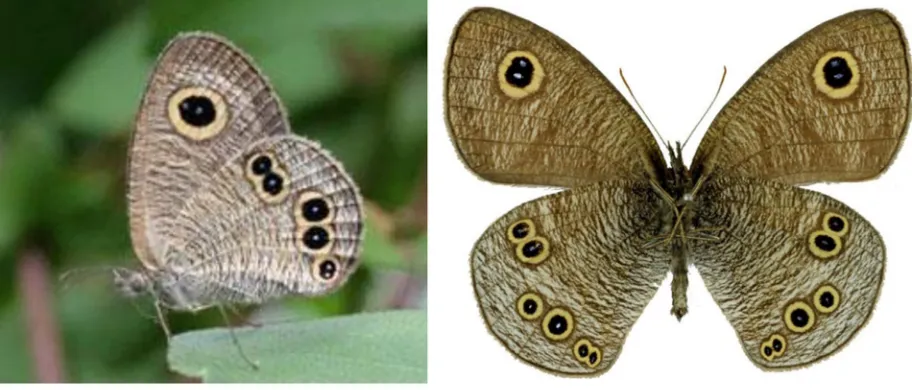
Butterfly wing color patterns are among the most spectacular and remarkable examples of pat-terning in biology. For more than a century, they have attracted much attention from experi-mentalists and theoreticians alike. One of the most studied color patterns on butterfly wings is the eyespot (Fig 1) that may play a central role in interactions with predators. The formation of eyespots has been the subject of studies in molecular and developmental genetics (e.g.,[1,2,3]), evolution, physiology (e.g., [4,5]), ecology (e.g., [6,7,8]), and theoretical biology (e.g., [9,10,
11]). These studies, however, have focused on the formation mechanism of a single eyespot located at a specific position on the wing surface. Several species of butterflies, however, have many eyespots on their wing surface. The number, size, shape, pigmentation and precise posi-tion of these eyespots are extremely diverse and are typically species-specific. In order to fully understand the evolution and diversity of eyespot patterns, it is necessary to analyze the mecha-nism that governs the formation of these different pattern elements.
In this paper, we focus on the mechanism underlying the determination of the number and locations of eyespots on the wing surface. Each eyespot develops around a focus, a small group of cells that sends out a morphogenetic signal that determines the synthesis of circular patterns of pigments in their surroundings. Our paper is concerned with the mechanism that places these foci in various locations on the wing surface. This fundamental process constitutes the first of three developmental steps of eyespot formation (seeSection 2for details). We do not consider the mechanism behind the determination of the size, shape and pigment patterns around the foci, which occurs later in the developmental stages. The number and locations of foci would have undergone considerable evolution during the diversification of the butterflies. Our objective in this article is to propose a model that determines the global distribution of foci in the overall venation system of the wing.
Background and a Mechanism for Selection of Focus Points
2.1 General features of eyespot formation
The formation of wing color patterns including eyespot patterns is a spatially two-dimensional phenomenon that takes place in the single layer of cells that makes up each surface of the wing [e.g.,12]. The butterfly wing begins its development as a wing imaginal disc in the larva. The wing imaginal disc is transparent and colorless throughout the larval and early pupal stages of development. Antibody and mRNA fluorescence techniques for the several developmental Union Horizon 2020 research and innovation
programme under the Marie Sklodowska-Curie grant agreement No 642866. AM was partially supported by a grant from the Simons Foundation.
genes have revealed existence of a developmental pre-pattern on the wing disc, which predicts the color pattern of the adult butterfly wing (e.g., [3]).
For the specific case of eyespot formation, the formation mechanism is thought to consist of the following three developmental stages (e.g., [13,14])
i. The first stage is the determination of the location of the signaling center, i.e.,“the eyespot focal cells”, from which some signaling chemicals, or morphogens originate.
ii. The second stage is the spreading out of morphogens into the surroundings of the focus cells through diffusion and activation of corresponding genes (e.g.,Dll,engrailed), which establish a pattern of concentric rings of gene expression that constitutes the pre-pattern for pigment synthesis.
iii. The third stage is the activation of the pigmentation genes (e.g.,DDC,GTP-CH1,cinebar) that cause the synthesis of species-specific pigments as a set of concentric colored rings we recognize as an eyespot. The focus cells are typically pigmented white and form the“pupil” of the eyespot on the adult wing.
The target problem in this paper pertains to the first developmental stage described above: the formation and positioning of the foci. We will not consider the growth of the wing disc as part of the modeling as this is assumed to occur on a longer timescale influencing only the sec-ond and the third stages.
[image:3.612.48.504.89.284.2]2.2 A mechanism for selection of eyespot focus points in the wing disc
Although there is experimental data on the development of eyespot foci, little is known about the mechanism that determines the number and locations of focus points in the entire wing disc. As seen inFig 2, only certain wing cells develop eyespot foci, while other wing cells do not develop any foci. The proposal of a mechanism that explains whether or not an eyespot focus forms in a given wing cell is one of the main objectives of the current study. We assume that the key determinant of focus point selection is in the overall venation system of the wing disc.Fig 1. Ventral eyespot patterns of the butterflyYpthima arugus(Nymphalidae, Satyrinae) at rest (left), and the extended adult specimen (right).The right-hand side photo: courtesy of Mr.Toru Tokiwa.
doi:10.1371/journal.pone.0141434.g001
Following Nijhout [9], we assume that veins act as sources of one of the two diffusing reactants. To investigate the selection mechanism, we assume a hypothetical venation system, where wing cells of the wing disc are rectangular (seeFig 3), although for completeness we also illus-trate that our results are robust to perturbations from this rectangular geometry by considering wing cells with curved boundaries and varying width in Section 3.2. Under these assumptions, we investigate whether the nature of the proximal boundary condition can determine focus point selection, i.e., the number and locations of focus points in the entire wing disc.
Proximal Boundary Conditions as a Mechanism for Focus Point
Selection
3.1 Mathematical description of the model
[image:4.612.46.468.74.384.2]For the sake of simplicity, we approximate the wing cells by rectangular domains and assume that all wing cells are of the same size (seeFig 3) and are independent [4]. Our results appear insensitive to small perturbations to this geometry. The only difference between wing cells is assumed to be in the source value of the activator at the proximal veins. We propose variable boundary conditions on the proximal boundary in the anterior-posterior direction of the wing disc. We assume that the entire wing disc comprises seven wing cells on which eyespot foci
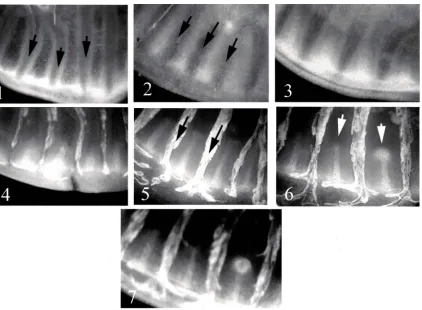
Fig 2. Development of eyespot focus points in the wing disc ofJunonia coenia(Nymphalidae, Nymphalinae).Numbers 1~7 in the photos show a time course of theNotchexpression pattern during the focus point development. The expression pattern by antibody staining were visualized on a fluorescent light microscope and digitally photographed. Black arrows in photo numbers 1, 2, and 5 indicate pre-veins, which finally evolve to become veins of the adult butterfly wing. White arrows in photo 6 show two peaks ofN-related chemicals along the centerline of each wing cell, the right-hand one of which evolves into a focus point afterwards (in photo number 7) while no focus point remains on the left-hand wing cell. Photos: courtesy of Prof. Fred Nijhout of Duke University. For more details on the adult forewing ofJ.coeniabutterfly, seeFig 7in Section3.3.
patterns can form. Following Nijhout [9], in the interior of each wing cell, we employ the acti-vator-inhibitor reaction-diffusion model of Gierer-Meinhardt (G-M) [15] that describes focus point formation. Therefore, our model consists of several sets of coupled G-M models; each set is posed in a single rectangular wing cell. We remark that under this framework, the focus point formation occurs independently in each rectangular wing cell.
Letnseqdenote the number of wing cells, typically seven. For thei–th (i= 1,. . .,nseq) wing
cell, the boundary conditions for the activator concentration (a1) are Dirichlet (fixed) on the
proximal boundaryΓp,iand the wing veinsΓv,i,Γv,i+1, and Neumann (zero flux) boundary
con-ditions on the wing marginΓm,i(i= 1,. . .,nseq) (seeFig 3). The boundary conditions for the
inhibitor concentration (a2) are zero flux on all four boundaries of each rectangular wing cell.
The Dirichlet boundary condition on each veinΓv,iis the same for each vein. The initial
condi-tions are taken to be the spatially homogeneous positive steady state solucondi-tions of the G-M equation. Thus our model for selection of focus points consists ofnseqindependent G-M
equa-tions. Let us denote byOithei-th wing cell with boundaries,Γm,i(wing margin),Γv,i,Γv,i+1
(veins) andΓp,i(proximal boundary). The model system equations in dimensionless form may
be stated as follows: Fori(= 1,. . .,nseq), we finda
!
[image:5.612.41.541.77.380.2]ð!x;tÞ ¼ ða1ðx!;tÞ; a2ðx!;tÞÞT,x!2Oi, such
Fig 3. A wing disc in the larval stage (up left) and its venation system (down left) ofPapilio polyxenes(Papilionidae).Both photos: courtesy of Prof. Fred Nijhout of Duke University. (Right) Hypothetical wing disc and its venation system with rectangular approximation to wing cells in which eyespot focus point selection occurs.
doi:10.1371/journal.pone.0141434.g003
that
@ta
!
D!D!a ¼!fð!aÞ in Oi;
a1ð!x;tÞ ¼uðx
!
Þ onGp;i;
a1ðx!;tÞ ¼~aðsource valueÞ onGv;i[Gv;iþ1; ra1v¼0ðzero fluxÞ onGm;i;
ra2v¼0ðzero fluxÞ onGm;i[Gv;i[Gv;iþ1[Gp;i;
a
!
ð!x;0Þ ¼a!ss inOi;
ð3:1Þ
8 > > > > > > > > > > > < > > > > > > > > > > > :
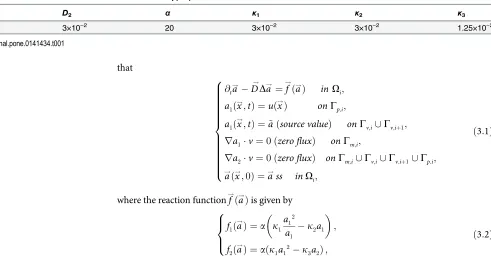
where the reaction function!fða!Þis given by
f1ða!Þ ¼a k1a1
2
a1 k2a1
;
f2ða!Þ ¼aðk1a12k3a2Þ;
ð3:2Þ
8 > < > :
withα,κ1,κ2,κ3>0. This choice of reaction kinetics implies the existence of a positive steady
statea!ssof the ordinary differential equation (ODE) system and this is given by k3
k2; k1k3
k22
T
.
Other than the prescribed proximal boundary conditionuðx!Þin Eq (3.1), each of the wing cells is assumed to be identical with the same source terms from the wing veins, diffusion
coef-ficients and reactions. The boundary conditions at the veins are taken to be constant at twice the steady state of the activator, i.e.,~a¼2a1ss(following [9]).
3.2 Simulation results of the model with prescribed boundary conditions
We now present numerical simulations illustrating that the proximal boundary condition can act as a determinant of whether or not a focus point forms in a given wing cell. We use the finite element method, derived and analyzed in Lakkis et al. [16], for all the simulations approximating the equations on meshes with 33025 degrees of freedom and using a time-step of 10−3. We take the parameter values for the reaction kinetics and diffusion coefficients to be those given inTable 1. The majority of the results we report on remain qualitatively unchanged with small changes in the parameter values (10%). We consistently show only snapshots of the numerical solution of the activator concentration corresponding to Eq (3.1). The inhibitor con-centration profile is in-phase and hence its snapshots are omitted.We start by considering prescribed boundary conditions on the proximal boundary, i.e., the functionuðx!Þin Eq (3.1) is a given function. We consider the following three cases for the qua-dratic proximal boundary condition.
3.2.1 Constant boundary condition. We first consider the case that the proximal bound-ary condition is constant in each wing cell, i.e., it is a piecewise constant discontinuous function over the whole proximal anterior-posterior boundary. InFig 4, we show simulation results of Eq (3.1) on wing cells with constant proximal boundary condition of the formkpa1ss, where
kp= 0, 1 and 2 (reading from left to right in each row) anda1ssis the (activator) steady state
[image:6.612.83.574.84.341.2]value. Each wing cell is taken to be a rectangular domain of length (proximal-wing margin)
Table 1. Parameter values used for all the simulations of Eq (3.1).
D1 D2 α κ1 κ2 κ3
3.1×10⁻³ 3×10⁻² 20 3×10⁻² 3×10⁻² 1.25×10⁻²
three and width (anterior-posterior) two. We observe the formation of activator peaks along the centerline of each wing cell (even those that do not eventually possess focus points) that is a characteristic of Nijhout’s model [17] and is observed in experiments [1,2]. In wing cells with an activator concentration of less than 2a1sson the proximal boundary, as the midline peak
[image:7.612.234.477.75.446.2]recedes it leaves behind focus points (two columns on the left inFig 4), whilst for the cell with activator concentration on the proximal boundary equal to 2a1ss, (right hand rectangle) the
Fig 4. Proximal boundary conditions may govern eyespot focus point determination.The figure shows snapshots of the activator concentration corresponding to the solution of Eq (3.1). The boundary conditions on the proximal boundary (top) of the rectangular cell for the activator are of the formkpa1sswherekp= 0, 1 and 2 (reading from left to right in each row) anda1
ss
is the (activator) steady state value. The veins (left and right boundaries of each wing cell) have Dirichlet (fixed) boundary conditions for the activator with constant values at twice the steady state. Initially in all the wing cells a vertical stripe of high activator concentration is generated originating from the zero-flux distal boundary (bottom). In the wing cells with lowest activator values at the proximal boundary (left hand), a spot forms and this spot eventually moves towards the center of the cell (see also Section3.3). In the wing cells with medium activator values at the proximal boundary (middle), we have both the formation of a spot from the receding midline peak and later the insertion of a new spot that originates from the proximal boundary with the steady state consisting of two spots. In the wing cell with highest activator values at the proximal boundary (right hand), the vertical stripe recedes without leaving behind a spot.
doi:10.1371/journal.pone.0141434.g004
midline peak completely recedes and no focus point remains. Interestingly for the simulations with proximal boundary conditiona1ss, an extra focus point is formed which originates at the
proximal boundary, migrates to the interior of the wing cell and persists at the steady state. Thus, for this choice of parameter values and domain geometry, the number of focus points at steady state does not depend monotonically on the proximal boundary condition. As each wing cell only differs in terms of the proximal boundary condition, we see that the changes in the proximal boundary condition can act as a determinant of focus point formation. The piece-wise constant boundary profiles considered so far are only an approximation and it is likely that the real activator boundary profile may appear as a continuous smooth function.
3.2.2 Concave and convex boundary conditions. We consider the following two addi-tional proximal boundary condition profiles, a concave profile:
uð!xÞ ¼ 1sin2 px
!
w
2a1ss ; ð3:3Þ
and a convex profile:
uðx!Þ ¼ sin2 px
!
w
2a1ss; ð3:4Þ
wherewis the width of the wing cell.
Fig 5shows simulation results of Eq (3.1) on wing cells together with two profiles of the proximal boundary conditions given by Eqs (3.3) and (3.4). As previously, each wing cell is taken to be a rectangular domain of length (proximal-wing margin) three and width (anterior-posterior) two. We once again observe the formation of activator peaks along the centerline of each wing cell and as this midline peak recedes, it leaves behind a spot in the wing cell with the concave boundary condition whilst with the convex boundary condition the peak completely recedes leaving behind no spot. We have performed a number of other simulations (results not shown) with spatially varying (within each wing cell) proximal boundary conditions and we observe analogous behavior to this simulation, namely that the value of the boundary condition in the middle of the proximal boundary of the wing cell is a key in determining whether or not a focus point forms. We further note that by appropriately super imposing together boundary conditions as inFig 5together with the piecewise constant boundary conditions used to gener-ate the results ofFig 4, it is possible to generate all possible configurations of focus point distri-butions (consisting of at most a single focus point in each wing cell) with a boundary profile that is continuous across the whole wing along the anterior-posterior proximal vein.
As a robustness test of sensitivity of the observed behavior to the geometry, we relax the assumption of rectangular geometries and work on a geometry closer to that of the real wing cells shown inFig 2. We consider a wing cell whose width increases as we move in the proxi-mal-distal direction and we consider curved proximal and wing margin boundaries. The spe-cific geometry for which we present results is defined by the following boundaries:Γv,1is taken
to be the line between the points (-0.8, 3) and (-1, 0),Γv,2is taken to be the line between the
points (0.83, 3) and (1, 0) and the proximal and wing margin boundaries are taken to be curves given by
Gp;1 := fx
!
Fig 5. (Top row): Examples of proximal boundary condition: concave (left) and convex (right) profiles. (Bottom row): Numerical simulations on the influence of proximal boundary profile on eyespot focus point determination.The figure shows snapshots of the activator concentration corresponding to the solution of Eq (3.1) on wing cells with proximal boundary conditions. The wing cells are taken to be rectangular of length 3 and width 2. In each subfigure, the left hand plot corresponds to the concave proximal boundary condition and the right hand plot the convex proximal boundary condition (c.f., Fig 5 (Top row)). We observe the formation of a spot in the concave case whilst the midline peak completely recedes leaving behind no spot in the convex case.
doi:10.1371/journal.pone.0141434.g005
[image:9.612.88.404.74.613.2]and
Gm;1 := fx
!
2R2jðx1Þ2þ ððx2Þ=0:1Þ2¼1 with x2 0g:
Fig 6shows simulation results of Eq (3.1) on wing cells with curved proximal and wing mar-gin boundaries and increasing width towards the wing marmar-gin. We observe analogous behav-iors to the rectangular domain case with larger values of the Dirichlet proximal boundary condition inhibiting the formation of a focus point. In the case of values at the steady state for the proximal Dirichlet boundary condition, we note that in contrast to the rectangular domain case only one focus point is observed (results not included in the interests of space), with the steady state profile similar to those of the zero Dirichlet boundary condition (Fig 6(left)).
[image:10.612.52.503.78.407.2]Finally, we investigate the dependence of the number of focus points on the aspect ratio of the wing cell (see figures (a)–(h) inS1 Appendixfor detailed numerical simulations). Figures (g) and (h) inS1 Appendixshow steady states of the simulation of Eq (3.1) on wing cells with constant proximal boundary condition at zero and 2 times the steady state value. The length (proximal-distal) is held fixed at 3 and the width (anterior-posterior) is varied between 1.5 and 3 (i.e., the aspect ratio varies from 2 to 1). We observe a monotonic dependence of the number of focus points on the aspect ratio.
Fig 6. Steady state values of the activator concentration in simulations of Eq (3.1) on a domain of increasing width in the proximal-distal direction (top to bottom) and with curved proximal (top) and wing margin (bottom) boundaries.The left hand figure corresponds to constant boundary conditions equal to zero on the proximal boundary curve. The right hand figure corresponds to proximal boundary conditions equal to twice the activator steady state. The observed behavior is analogous to the rectangular domain case.
We have also simulated cases (results not shown) where the proximal boundary condition is asymmetric and where the boundary condition along the veins is varied, rather than the fixed Dirichlet conditions presented above. Although it is possible through careful tuning of the parameter values and boundary conditions to generate focus points which are not circular (spots) such as arc shaped foci as well as focus points which are positioned away from the cen-terline of the wing cell, the predominantly observed behavior is the generation of circular spot shaped foci positioned along the centerline of the wing cell at steady state.
3.3 Simulations of variations in focus point patterning observed in nature
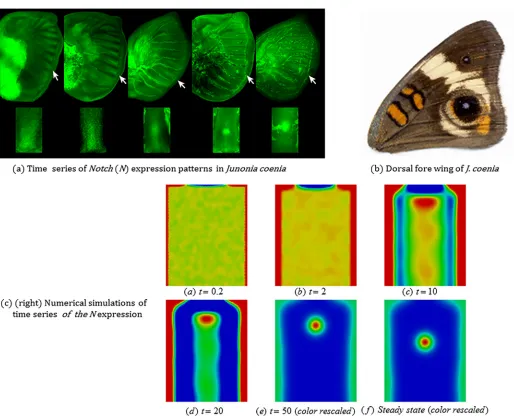
We now present some simulation results together with experimental images of real specimens, which illustrate the capability of the model to describe naturally occurring variations in eyespot focus point patterning.3.3.1 Development of focus points in the wing disc during eyespot determination. Fig 7 (A)shows time series ofNotch(N) expression patterns inJunonia coeniawing discs during eyespot focus determination andFig 7(B)is the adult fore wing ofJ.coenia[18]. TheN expres-sion patterns are divided into five stages: (1) broad expresexpres-sion in intervenous regions, (2) upre-gulation along intervein midlines with no obvious expansion of focal expression, (3)
upregulation along intervein midlines with an obvious expansion of focal expression, (4) upre-gulation in five well-defined foci, with little or no midline expression, and (5) strong upregula-tion in posterior-most focus, with four anterior foci being greatly reduced or undetectable. From the 3rdstage (middle) to the 4thstage or the 5thstage (right-hand most) inFig 7(A), we can see a migration of the focal point into the distal direction along the midline of the wing cell. Since the distal margin of the wing cell of the 5thstage could not be seen clearly, the migra-tion might have completed during the time period between the 4thstage and the 5thstage. In any case, the migration of the focal point is reproduced in numerical simulations of our mathe-matical model as seen inFig 7(C)(see alsoFig 4).
Fig 7(C)shows snapshots of a simulation of the focus point formation shown inFig 7(A). The domain, that represents a single wing cell, is taken to be a rectangle of length (proximal-distal) 2.5 and width (anterior-posterior) 2. In order to incorporate natural variation in the modeling, we consider boundary conditions on the veins of the form2ass
1ð1þZðxÞÞand for the
proximal boundary we used boundary conditions of the form
uð!xÞ ¼ 1sin2 px
!
w
2ass
1ð1þZðxÞÞ; ð3:5Þ
whereηis a uniformly distributed random variable with range [−0.1,0.1]. Similarly the initial data was taken to be the steady state values perturbed byη. We see inFig 7(C)that the results appear insensitive to this moderate level of noise and that the qualitative features are similar to those seen in the simulations and experiments shown in Figs4and7, respectively. A centerline peak forms leaving behind a single focus point which then migrates in the distal direction as is observed in experiments. The incorporation of noise in the boundary conditions appears to destroy the strong symmetry observed in the other simulation as illustrated in the asymmetric nature of the centerline peak.
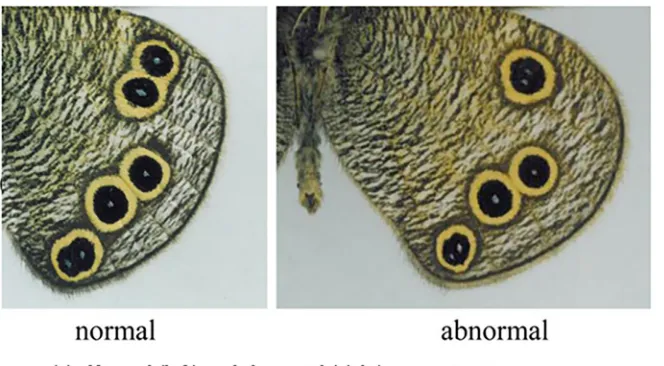
3.3.2 Abnormal pattern resulting from incomplete vein development. Fig 8shows an abnormal eyespot pattern of the hind wing of the butterflyYpthima arugusand for comparison the corresponding normal pattern. The left hand subfigure (a) shows two patterns: normal ven-tral hind wing pattern (left) and the corresponding abnormal pattern in which a vein did not fully develop. To illustrate the scenario during abnormal development of the vein, we include a
sketch (right hand subfigure (b) ofFig 8) of the venation system and also an arrow in the pic-ture where we see two distinct focus points and only one eyespot covering the two focus points.
[image:12.612.56.570.82.500.2]Fig 8(C)illustrates the simulation results on a domain representative of the abnormal case ofFig 8. The domain is a rectangle of width (left to right) four and length three representing two neighboring wing cells. The incompletely developed vein is modeled as an interior bound-ary originating from the midpoint of the proximal (top boundbound-ary) and extending halfway into
Fig 7. Development of focus points in the wing disc during eyespot determination.(a) Time series ofNotchexpression patterns inJunonia coeniawing discs for the final instar eyespot determination. TheNotchexpression patterns were obtained by anti-Nmouse monoclonal antibody and were visualized on a fluorescent light microscope [18]. (Upper row) The five panels show stained wing discs. (Bottom row) The five panels show the wing cells extracted from the respective figures in the upper panels. Regarding the orientation of bottom panels, the upper side corresponds to the proximal boundary and the bottom side corresponds to the distal boundary of the wing cell, respectively. Insets in the panels detail gene expression in the wing cells marked by white arrows. (b) The corresponding adult forewing ofJ.coenia. (c) Simulation results of Fig 7 (a) by use of Eq (3.1). The initial data and boundary conditions are perturbed by uniformly distributed noise which leaves the qualitative features of the results unchanged. In Fig 7 (a), we could see a migration of the focal point into the distal direction from the 3rdstage (middle) to the 4thstage (next to the middle). Both photos (a) and (b): courtesy of Dr. Robert Reed of Cornell University.
[image:12.612.50.387.90.238.2]the interior of the rectangle. For this simulation we selected boundary conditions to be four times the steady state on the completely developed veins and the proximal boundary and twice the steady state on the incompletely developed vein. The interior boundary was modeled as a Dirichlet boundary only for the activator whilst for the inhibitor all the boundaries were taken to be zero-flux. The inclusion of such an interior boundary in the finite element simulations is straightforward once a triangulation is defined over the desired geometry.
We see that with this choice of boundary profiles the resulting focus point distribution is similar to that observed in the case of abnormal wing venation. The results suggest that the incomplete vein may constitute a smaller source of activator than completely developed veins and this could account for the variation in the position of focus points and hence the resultant eyespot pattern.
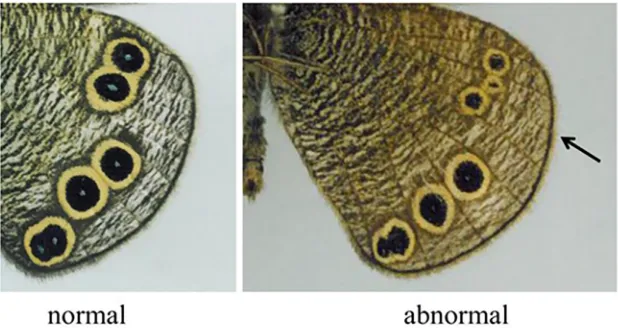
[image:13.612.48.380.87.270.2]3.3.3 One eyespot splits into two eyespots through the addition of a vein. Finally, we conclude this subsection with another example of an abnormal eyespot pattern on the hind wing of the butterflyY.arugus, which at first glance appears incompatible with the current
Fig 8. Incomplete vein development leaves two focus points with an eyespot covering two focus points.(a) Normal (left) and abnormal (right) eyespot patterns on the hind wing of the butterflyYpthima arugus. (b) Sketch of the abnormal venation system and an arrow to show two distinct focus points. (c) Simulations of the abnormal case of incomplete vein development shown in (a) (right) by use of Eq (3.1). This incomplete vein development leads to two focus points forming close to both the incompletely developed vein’s end point. The eventual pattern observed on the butterfly wing is that of a single eyespot generated by two focus points that are in close proximity. The corresponding normal pattern is of two distinct eyespots with orally separated foci. Photos (a) and the sketch (b): courtesy of Mr.Toru Tokiwa.
doi:10.1371/journal.pone.0141434.g008
model. The left hand subfigure (a) ofFig 9(A)shows a normal ventral hind wing pattern (left) and the corresponding abnormal pattern, in which an additional vein has developed in the middle of two adjacent veins (right) of the butterflyY.arugus. Each of the two newly produced wing cells has one eyespot or focus point, respectively. The width of each wing cell is, of course, narrower than that of the normal width. To illustrate the scenario during abnormal insertion of a vein, we include a sketch (right hand subfigure (b) ofFig 9) of the venation system and also an arrow in the picture where we see the additional foci. The results ofFig 9(C)appear incompatible with our model, as the results inS1 Appendix(i.e., the influence of aspect ratio on focus point determination) show that, in general, reducing the width of the wing cell leads to the formation of fewer foci. However once again if we assume that the abnormal case corre-sponds to a change in the venation system, specifically, a change in the boundary conditions at the newly formed vein then the model is capable of generating results consistent with the experimental observations.Fig 9(C)shows results of a simulation on two rectangles of length three and width one, i.e., wing cells of half the usual width. The black line in the figure indicates
Fig 9. One eyespot splits into two eyespots through the addition of a vein.(a) Normal (left) and abnormal (right) eyespot patterns on the hind wing of the butterflyYpthima arugus. (b) Sketch of the abnormal venation system and the corresponding patterning, where arrows show an additional vein. (c)
Simulations of the abnormal case of an additional vein development in the middle of adjacent two veins shown in (a) (right) by use of Eq (3.1). Photos (a) and the sketch (b): courtesy of Mr.Toru Tokiwa.
the new vein. We assume that this new vein acts as a homogeneous Dirichlet boundary for the activator. The proximal boundary is also taken to be a homogeneous Dirichlet boundary for the activator whilst the other pre-existing vein is assumed to be a Dirichlet boundary, with the concentration at the boundary at twice the steady state. Due to symmetry, we only solve on a single wing cell and simply reflect along the line of the new vein. We clearly see the formation of two focus points, one in each thin wing cell. Hence under our model one prediction is that for abnormal scenarios such as those inFig 9lower activator source strengths on the abnor-mally inserted veins may account for the abnormal patterning.
A 2-Stage Model for Focus Point Selection
In Section 3.2, we illustrated that the consideration of different proximal boundary conditions is sufficient to explain focus point selection in a single wing cell. In order to present a complete model for focus point selection, it remains to develop a mechanism for the generation of the proximal boundary profiles. We propose a 2-stage process whereby the first stage consists of the formation of the pattern generating the proximal boundary profiles and the second stage consists of the focus point formation model described in Section 3.1. Although we consider a 2-stage model in this work for simplicity, however, it is certainly of interest mathematically and may be biologically important to consider models where the boundary profile pattern for-mation process occurs on the same timescale as the focus point forfor-mation process. Such a cou-pled bulk-surface system may be an interesting direction for future research.
4.1 A model for the generation of the proximal boundary condition and a
2-stage model for focus point patterning
For the generation of the proximal boundary profiles, we propose an 1-dimensional (1D) pat-tern formation model posed on the proximal boundaryΓp=
S
iΓp,i, the union of the proximal
boundaries of the wing cells. Clearly, a large variety of models could generate boundary condi-tions of the form considered in the previous section, the 1Dmodel we present here is just one concrete example.
To illustrate the modeling, we work with a concrete example, the activator depleted sub-strate model of Schnakenberg [19] (see also Murray [20]). The reaction-diffusion system (RDS) is posed on the anterior-posterior margin of the entire wing disc, i.e., the proximal boundaryΓpand we assume zero-flux boundary conditions. We consider the following
dimen-sionless RDS for the concentrations of two chemicals (activator and substrate): Findu!ðx;tÞ ¼
ðu1ðx;tÞ;u2ðx;tÞÞTsuch that
@tu1ðx;tÞ d1DGu1ðx;tÞ ¼gðxÞðk1u1þu12u2Þ on Gp;
@tu2ðx;tÞ d2DGu2ðx;tÞ ¼gðxÞðk2u12u2Þ on Gp;
rGu1n¼ rGu2n¼0 on @Gp;
u!ðx;0Þ ¼u!0ðxÞ on Gp;
ð4:1Þ
8 > > > > > < > > > > > :
where,d1,d2,k1andk2are all positive constants.rΓandΔΓdenote the surface gradient and
Laplace-Beltrami operators, respectively. Usually the functionγappearing in Eq (4.1) is taken to be a positive constant (which may be interpreted as being related to the domain size or alter-natively may be interpreted as a reaction rate [20]). However, in general due to the inherent uniform wavelength associated with Turing patterns, we believe it is not possible to generate boundary profiles such as those considered in Section 3.1, which allow focus points to be gener-ated in arbitrary wing cells with constant parameters if one considers only two component
RDSs. We propose here the 1Dcontinuous two component RDSs (4.1) with a spatially varying γto obtain different proximal boundary profiles. We note that 3 or more component RDSs have much richer behavior than 2 component RDSs [21and22] and hence may be attractive candidates for the generation of the posterior pattern.We remark, that this anterior-posterior patterning may occur on a different timescale to the focus point formation process, and it may even occur at an earlier stage of the focus point development, and it would then lay down a pre-pattern for the formation of the proximal boundary profile.
We now describe the 2-stage model we propose for the modelling of focus point patterning on butterfly wings:
Stage 1: In the first stage, the 1DRDS (4.1) is solved on the proximal boundaryΓp(i.e., the
union of the proximal boundaries of the wing cells) to steady state.
Stage 2: In the second stage, independent bulk RDSs of the form (3.1) are solved, i.e., each RDS is posed in a single wing cell and the pattern formation process in this stage occurs inde-pendently in each wing cell. The Dirichlet (fixed) boundary conditions on the proximal bound-ary,uðx!Þin Eq (3.1), are taken to be functions of the (patterned) steady state values of the solution to the 1DRDS from Stage 1.
In the next section, we present firstly (1) simulation results of Eq (4.1) in cases where the functionγis constant, and secondly (2) simulation results of Eq (4.1) with a spatially varyingγ.
4.2 Simulation results of the 2-stage model
We consider the 2-stage model for the selection of focus points described in Section 4.1. The Dirichlet boundary conditions on the proximal boundary given by
uðxÞ ¼cp;1u1ðxÞ þcp;2u2ðxÞ, forx2Γp, wherecp,1,cp,22R.u1ðxÞ;u2ðxÞare the (patterned)
steady state solution values of the 1DRDS (4.1).
We reused the parameter values given inTable 1for the system (3.1) and the remaining parameters were taken as shown below. Thus as the parametercp,2= 0, the Dirichlet boundary
conditionsuin Eq (3.1) are simply given by one third of the (patterned) steady state activator concentration,u1of the 1DRDS (4.1). The initial conditions for the 1DRDS are taken as small
quasi-random perturbations around the uniform steady stateðk1þk2;k2=ðk1þk2Þ2ÞTand the initial conditions for the bulk RDS are taken as in Section 3.1 (uniform steady state values). In all the simulations, we assume the idealized geometry depicted inFig 3(right) consisting of seven rectangular wing cells. We assume the proximal (and marginal boundaries) of each wing cell are of length two and the veins are of length three. Thus the union of the proximal bound-ariesΓp, on which the 1DRDS (4.1) is posed is a line of length fourteen (the union of seven
proximal wing cell boundaries).
4.2.1 Case study where the functionγ(x) is constant. We start by considering three cases where the functionγ(x) in the 1DRDS (4.1) is constant. Firstly we setγ(x) = 0.01 andγ(x) = 1 withκ1= 0.1,κ2= 0.9,d1= 0.01,d2= 1,cp,1= 1/3 andcp,2= 0. For the third case, we setγ(x) =
5.4 withκ1= 0.1,κ2= 0.9,d1= 1,d2= 1,cp,1= 1.4 andcp,2= 0.
On the other hand, (left hand column): (a) and (c) ofFig 10show results of the 2-stage model withγ(x) = 0.01. In this case,γis below the critical value for the onset of diffusion driven-instability globally and the solution to the 1DRDS (4.1) simply converges to the uni-form steady state. Hence, we have a constant value for the proximal boundary condition. As the choice of the coupling coefficientcp,1is such that the proximal boundary conditionðcp;1u1Þ
is below the critical value for focus point formation, we generate a focus point in every wing cell. The resultant pattern is similar to that observed in the developing wing disc ofB.anynana as shown inFig 10(right hand column).
Case 2: No focus points on the wing:Fig 11shows results of the coupled model withγ(x) = 1. In this case,γis above the critical value for the onset of diffusion driven instability and we obtained a patterned steady state solution to the 1DRDS (4.1). The solution profile is one of seven equally spaced activator peaks in the domain with the activator profile on each proximal boundary ([0,2], [2,4],. . .) appearing similar in shape to the convex profile ofFig 5. When we simulate the 2-stage model with this boundary profile and the selected coupling coefficientcp,1,
we observe similar behavior to the simulations ofFig 5(with the convex profile) with no focus points forming in any of the wing cell.
[image:17.612.49.565.81.362.2]Beldade et al. [4] did artificial selection to examine how the relative size of the anterior and posterior eyespots on the dorsal forewing ofB.anynanacan be changed in a laboratory
Fig 10. Focus points on the ventral hind wing ofBycyclus anynanaand numerical simulation results by the 2-stage model.(a) Steady state values of activator concentration (u1) of the 1DRDS (4.1) withγ(x) = 0.01. (b) Ventral hindwing ofB.anynana. (c) Steady state values of the activator concentration (a1)
for the seven independent bulk RDSs (3.1) with proximal boundary conditions given by (1/3)u1whereu1is the steady state activator concentration shown
above. (d) The hind wing imaginal disc ofB.anynanawith focus points labelled. (Left hand column) Simulation results of the 2-stage model for focus point formation with a small constant value of the reaction rateγappearing in the 1DRDS (4.1) (γ(x) = 0.01). The model generates a focus point in every wing cell. (Right hand column) The adult ventral hind wing ofB.anynanawith seven eyes-pots (top) and the fifth-instar hind wing imaginal disc displaying a pre-pattern with seven foci (bottom), which correspond to eyespots positions on the adult ventral hind wing. Experimental figures: from Brakefield et al. [2] with permission by the publisher.
doi:10.1371/journal.pone.0141434.g010
population. They got almost all possible phenotypes by generations G25, e.g., females with no eyespots, with only one anterior eyespot, only one posterior eyespot, two (anterior and poste-rior) eyespots, and extra, satellite eyespots on the entire dorsal forewing. Simulation results of
Fig 11(B)correspond toB.anynanafemales having no eyespots.
Case 3: Two focus points on the dorsal hindwing ofPrecis coenia: Brakefield et al. [2] showed that the fifth-instarPrecis coeniahindwing imaginal disc exhibits two spots ofDll expression, which correspond to the future positions of two eyespots on the adult hindwing. In
Fig 12, the top right photo (b) shows the adultP.coeniadorsal hindwing with two eyespot focus points, and the bottom right (d) is the fifth instarP.coeniahindwing imaginal disc displaying a pre-pattern with two focus points ofDllexpression, which correspond to the position of the eyespots on the adult dorsal hindwing.
[image:18.612.49.559.91.441.2]By selecting, the parameters in the two component RDS posed on the proximal boundary corresponding to the third case described above, we generate patterns with a larger wavelength (due to the increased diffusion coefficients). As shown inFig 12(A), the resultant steady state
Fig 11. Simulation results of the 2-stage model for focus point formation with a large constant value of the reaction rateγappearing in the 1DRDS (4.1) (γ(x) = 1).The model generates no focus points. (a) Steady state values of activator concentration (u1) of the 1DRDS (4.1) withγ(x) = 1. (b) Steady state
values of the activator concentration (a1) for the seven independent bulk RDSs (3.1) with proximal boundary conditions given by (1/3)u1whereu1is the
steady state activator concentration shown above.
[image:18.612.54.556.102.238.2] [image:18.612.61.526.291.408.2]consists of an activator pattern with only two interior minima in the domain corresponding to the proximal boundaries of wing cells two and five. When we simulate the 2-stage model with this boundary profile and the selected coupling coefficientcp,1, we observe the formation of foci
in wing cells 2 and 5 and no foci in the other wing cells similar to the experimental observations ofP.coeniaas shown inFig 12(right hand column).
[image:19.612.47.560.90.407.2]4.2.2 Simulation results of (4.1) with a spatially varyingγin the anterior-posterior direc-tion. As mentioned in Section 4.1, through the consideration of 2-component RDSs with constant parameters, for the 1Dpatterning mechanism appears insufficient to generate bound-ary profiles leading to focus points in an arbitrbound-ary wing cells. A major difficulty lies in the fact that Turing patterns typically possess a constant wavelength over the domain, hence patterned profiles in one region of the domain with no patterning (convergence to the homogeneous steady state) in another region is not possible. However, such a pattern distribution is easily achieved through the consideration of systems with spatially varying parameters. See for exam-ple [23] for previous work in this direction.
Fig 12. Focus points on the dorsal hind wing ofPrecis coeniaand numerical simulation results by the 2-stage model.(a) Steady state values of activator concentration (u1) of the 1DRDS (4.1) with a constant value of the functionγ(x). (b) Dosal hindwing ofP.coenia. (c) Steady state values of the
activator concentration (a1) for the seven independent bulk RDSs (3.1) with proximal boundary conditions given by (1/3)u1whereu1is the steady state
activator concentration shown above. (d) The hind wing imaginal disc ofP.coeniawith focus points labelled. Two white arrows point twoDllstained focus points. (Left hand column) Simulation results of the 2-stage model for focus point formation with aconstant value of the reaction rateγappearing in Eq (4.1) (γ (x) = 5.4). The model generates the formation of foci in wing cells 2 and 5 and no foci in the other wing cells similar to the experimental observations. (Right hand column) The adultP.coeniadorsal hindwing with two eyespots (top) and the fifth-instar hindwing imaginal disc displaying a pre-pattern with two foci (bottom), which correspond to eyespots positions on the adult dorsal hindwing. Experimental figures: from Brakefield et al. [2] with permission by the publisher.
doi:10.1371/journal.pone.0141434.g012
In upper figures inS2 Appendix, we present simulation results of Eq (4.1) (as part of the coupled model) that illustrate that a system of the form (4.1) with a spatially varyingγ, specifi-cally an anterior-posterior gradient inγcan restrict patterning to certain portions of the wing (see also the corresponding bottom figures inS2 Appendix). RDSs with spatially varying parameters have been the subject of much study in the literature, for example [24]. We remark that numerical studies suggest patterning can be restricted to certain portions of the domain through the use of spatially varying parameters similar to the results we report on the current work. In [25,26], the authors model the regulation of digit patterning of developing vertebrate limb buds byHoxgenes using a Turing RDS. Their results indicate that changing the kinetic parameters can influence the wavelength of the resultant pattern. They also consider spatial gradients in kinetic parameters, and show that this allows the robust formation of a striped pat-tern with a given orientation that models digit formation.
Summary and Discussion
In this study, we presented a model for the selection and distribution of eyespot focus points on the wings of Lepidoptera. The basic idea of the model is that the wing cells, in which eyespot foci are formed, are selected by the source value of an activator on the proximal veins of the entire wing disc. Specifically a variable proximal boundary condition in the anterior-posterior direction of the entire wing disc governs focus point selection. Through numerical simulations on idealized wing disc geometries, we illustrated that this proximal wave-like boundary condi-tion can govern the number and locacondi-tions of eyespot focus points on the wing surface. As a result, the model could provide a plausible mechanism for the selection of global eyespot focus points on wing discs of some butterfly species such asJunonia(orPrecis)coenia,Bicyclus any-nana, andYpthima arugusin the Nympalidae family.
Our study suggests that a key factor that determines focus point selection could be in the overall venation system of the wing disc. We assumed that the veins are sources of the activator [9], i.e., they act as Dirichlet boundaries in the mathematical model and numerical simulations. We first considered a number of different prescribed boundary conditions on the proximal boundary, and our results show that one may construct boundary profiles (which could be smooth and continuous or discontinuous across the whole wing disc) such that focus points may be selected in any wing cell and hence may reproduce the variety of focus point distribu-tions observed in experiments. To complete the model, we then proposed a simple 1D reac-tion-diffusion model for the generation of the proximal boundary condition profile, that is, a surface Turing system posed in the anterior-posterior direction on the proximal vein.
The role of boundary conditions in the determination of patterning generated by reaction-diffusion systems has been the subject of previous work. For example, Dillon et al. [27] show that changes in boundary conditions can have a profound influence on the solutions both in terms of existence and uniqueness and in terms of the stability of patterns. Page et al. [24] investigate Turing systems with a discontinuity in a kinetic parameter and show that such a system may be decomposed into systems with constant parameters and anomalous boundary conditions. They further show that such systems may exhibit spatial patterns outside the classi-cal Turing space. Barrio et al., [28] and Aragon et al., [29] consider the role of boundary condi-tions in Turing reaction-diffusion system models for pigment patterns on the skin of fish. In particular, they observe that the consideration of different boundary conditions may increase the number of scenarios such models are capable of explaining. In light of our numerical results and the theoretical and numerical works mentioned above, further mathematical investigations in the same direction as the works above into the role of boundary conditions in patterning by Turing systems are certainly warranted.
The current model framework consists of wing discs that are the union of several (identical) rectangular wing cells, although we also considered a somewhat more representative wing cell with curved (proximal and wing margin) boundaries and varying width. This modeling framework might be improved by considering a more realistic geometry of the wing cells, rather than the rect-angular cells considered in this study, although experimental results suggest that during the time at which focus points form, a rectangular cell is a good approximation. Preliminary numerical results suggest that other forms of boundary conditions can generate more complicated foci such as arc shaped foci or multiple foci of different sizes in a wing cell. Such models could perhaps reproduce some of the diversity of focal shapes that are occasionally observed in nature. The exploration of such possibilities are reserved for future work. Here our objective has been to provide a proof of concept that anterior-posterior patterning alone may determine focus point selection.
Supporting Information
S1 Appendix. The influence of aspect ratio on eyespot focus point determination.The fig-ures inS1 Appendixshow snapshots of the activator concentration corresponding to the solu-tion of Eq (3.1). The wing cells are taken to be rectangular and of fixed length equal to three, but the width is now varied with the width taken to be 1, 1.5, 2, 2.5 and 3 reading from left to right in each subfigure. In the left hand column, the boundary conditions for the activator on the proximal boundary (top) of each rectangular cell are taken to be zero, and in the right hand column, they are set to twice the steady state value. Initially in all but the thinnest wing cell (left hand most in each column), a vertical stripe of high activator concentration is generated origi-nating from the zero-flux distal boundary (bottom). As the width of the wing cells is increased, the midline peak starts to generate multiple spots as it recedes with insertion of new spots in the proximal-wing margin, and in the anterior-posterior direction, both exhibited. There appears to be a monotonic relationship between aspect ratio and number of focus points with wider wing cells (with a fixed length) exhibiting more focus points at steady state.
(TIF)
S2 Appendix. Restricting focus point formation to regions of the wing through the use of spatially varying parameters in the anterior-posterior 1DRDS.As mentioned in Section 4.2.2, 2-component RDSs with constant parameters alone for the 1Dpatterning mechanism appear insufficient to generate boundary profiles leading to focus points in arbitrary wing cells. However, such a pattern distribution is achieved through the consideration of systems with spatially varying parameters such as the reaction rateγ(x) in Eq (4.1). To illustrate this effect, in figures inS2 Appendix, we report on the steady states for the 1Dsystems obtained using a
monotonically increasing gradient for the reaction rateγ(x) = (x/14)p, withp= 1, 2 and 8 ((a), (b), and (c), respectively). The remaining parameters were taken to be withκ1= 0.1,κ2= 0.9,
d1= 0.01,d2= 1,cp,1= 1/3 andcp,2= 0. As the gradient of this function is decreased (smallerp),
focus points form only closer to the anterior margin whilst for larger gradients focus points can be made to form on almost the entire wing. The casep= 0, corresponds toFig 11with no focus points forming, whilst formally in the limitp!1, a focus point forms in each wing cell, as in
Fig 10, as the 1DRDS solution would be close to the steady state value due to the initial condi-tions.
(TIF)
Acknowledgments
We would like to thank Prof. Fred Nijhout of Duke University for critical reading and valuable comments and suggestions. We also thank Mr. Toru Tokiwa of Amada Co. Ltd., Kanagawa, Japan and Dr. Robert Reed of Cornell University for their permission to use their photos in this paper. We finally thank anonymous reviewers for their valuable comments. The authors acknowledge financial support from the EPSRC grant EP/J016780/1. AM and CV acknowledge financial support from the Leverhulme Trust Research Project Grant (RPG-2014-149). This research was started while CV was visiting Japan as a 2013 Japanese Society for the Promotion of Science (JSPS) Summer Fellow. This research was finalized whilst TS, CV and AM were par-ticipants in the Isaac Newton Institute Program, Coupling Geometric PDEs with Physics for Cell Morphology, Motility and Pattern Formation. This work (AM) has received funding from the European Union Horizon 2020 research and innovation programme under the Marie Sklo-dowska-Curie grant agreement No 642866. AM was partially supported by a grant from the Simons Foundation.
Author Contributions
Conceived and designed the experiments: TS. Performed the experiments: CV. Analyzed the data: CV AM. Contributed reagents/materials/analysis tools: TS AM CV. Wrote the paper: TS CV AM.
References
1. Carroll SB, Gates J, Keys J, Paddock SW, Panganiban GE, Selegue JE, et al. Pattern formation and eyespot determination in butterfly wings. Science1994; 265(5168):109–114. PMID:7912449
2. Brakefield PM, Gates J, Keys D, Kesbeke F, Wijngaarden PJ, Monteiro A, et al. Development, plasticity and evolution of butterfly eyespot patterns. Nature1996; 384 (6606):236–242. PMID:12809139 3. Brunetti CR, Selegue JE, Monteiro A, French V, Brakefield PM, Carroll SB. The generation and
diversi-fication of butterfly eyespot color patterns. Curr. Biol. 2001; 11: 1578–1585. PMID:11676917 4. Beldade P, Koops K, Brakefield PM. Developmental constraints versus flexibility in morphological
evo-lution. Nature2002; 416(6883):844–847. PMID:11976682
5. Otaki JM. Structural analysis of eyespots: dynamics of morphogenic signals that govern elemental posi-tions in butterfly wings. BMC systems biology2012; 6(1):17.
6. Shirota Y. Kamen-sei no Shinka-ron. volume 37. Monad Books, Kaimeisha Co., Ltd., Tokyo. Japanese.
7. Stevens M. The role of eyespots as anti-predator mechanisms, principally demonstrated in the Lepdop-tera. Biol. Rev. 2005; 80: 573–588. PMID:16221330
8. Prudic KL, Stoehr AM, Wasik BR, Monteiro A. Eyespots deflect predator attack increasing fitness and promoting the evolution of phenotypic plasticity. Proc. R. Soc. Lond. 2015; B 282: 20141531.
10. Dilão R, Sainhas J. Modelling butterfly wing eyespot patterns, Proc. R. Soc. Lond.2004; B 271(1548): 1565–1569.
11. Evans TM, Marcus JM. A simulation study of the genetic regulatory hierarchy for butterfly eyespot focus determination. Evo. Dev. 2006; 8(3):273–283.
12. Sekimura T, Maini PK, Nardi JB, Zhu M, Murray JD. Pattern formation in lepidopteran wings. Comments in Theoretical Biology 1998; 5(2–4):69–87.
13. Nijhout HF, Maini PK, Madzvamuse A, Wathen AJ, Sekimura T. Pigmentation pattern formation in but-terflies: experiments and models. Comptes Rendus Biologies 2003; 326(8):717–727. PMID:14608692 14. Carroll SB, Grenier JK, Weatherbee SD. From DNA to Diversity‒Molecular Genetics and Evolution of
Animal Design 2nd edition, Blackwell Publishing Ltd.2005.
15. Gierer A, Meinhardt H. A theory of biological pattern formation. Biol. Cyber. 1972; 12(1):30–39. 16. Lakkis O, Madzvamuse A, Venkataraman C. Implicit–explicit timestepping with finite element
approxi-mation of reaction–diffusion systems on evolving domains. SIAM J. Num. Anal. 2013; 51(4):2309– 2330.
17. Nijhout HF. Genes on the wing. Science1994; 265(5168):44–45. PMID:7912450
18. Reed RD, Chen PH, Nijhout HF. Cryptic variation in butterfly eyespot development: the importance of sample size in gene expression studies. Evo. Dev. 2007; 9(1):2–9.
19. Schnakenberg J. Simple chemical reaction systems with limit cycle behaviour. J. Theor. Biol. 1979; 81 (3):389–400. PMID:537379
20. Murray JD. Mathematical biology. Springer Verlag, New York, Berlin, Heidelberg. 2003.
21. Meinhardt H. Models for positional signalling with application to the dorsoventral patterning of insects and segregation into different cell types. Development 1989 (Supplement: ): 169–180.
22. Meinhardt H. Models of Biological Pattern Formation: From Elementary Steps to the Organization of Embryonic Axes. Curr. Top. Dev. Biol. 2008; 81:1–63. PMID:18023723
23. Benson DL, Maini PK, Sherratt JA. Unravelling the Turing bifurcation using spatially varying diffusion coefficients. J. Math. Biol. 1998; 37:381–417.
24. Page K, Maini PK, Monk NMA. Pattern formation in spatially heterogeneous Turing reaction-diffusion models. Physica D 2003; 181:80–101.
25. Sheth R, Marcon L, Bastida MF, Junco M, Quintana L, Dahn R, et al. Hox Genes Regulate Digit Pattern-ing by ControllPattern-ing the Wavelength of a TurPattern-ing-Type Mechanism. Science 2012; 338:1476–1480. doi: 10.1126/science.1226804PMID:23239739
26. Raspopovic J, Marcon L, Russo L, Sharpe J. Digit patterning is controlled by a Bmp-Sox9-Wnt Turing network modulated by morphogen gradients. Science 2014; 345: 566–570. doi:10.1126/science. 1252960PMID:25082703
27. Dillon R, Maini PK, Othmer HG. Pattern formation in generalized Turing systems. J. Math. Biol. 1994; 32:345–393.
28. Barrio RA, Aragon JL, Varea C, Maini PK. A Two-Dimensional Numerical Study of Spatial Pattern For-mation in Interacting Turing Systems. Bull. Math. Biol. 1999; 61:483–505. PMID:17883228
29. Aragon JL, Varea C, Barrio RA, Maini PK. Spatial Patterning in Modified Turing Systems: Application to Pigmentation Patterns on Marine Fish. FORMA 1998; 13:(3):145–254.