ISSN Online: 2327-5227 ISSN Print: 2327-5219
DOI: 10.4236/jcc.2019.77018 Jul. 24, 2019 219 Journal of Computer and Communications
A Prediction Method of Charging Station
Planning Based on BP Neural Network
Jia Xu, Jing Li, Xin Liao, Changping Song
School of Computer Science and Technology, Shanghai University of Electric Power, Shanghai, China
Abstract
The construction of charging service facilities is a very important factor in the popularization of electric vehicles. Therefore, the planning problems of electric vehicle charging station are urgent to be solved. Considering the standard of natural environment, society, traffic, power grid and economy, an evaluation system is created for electric vehicle charging station project through 15 sub-standards. Planning model of charging station is constructed based on BP neural network adopted in the analysis. It is used for location and capacity prediction of charging station planning. By analyzing the model with data samples, a stable network structure is established and the feasibility of the model is verified in the charging station planning.
Keywords
Electric Vehicle Charging Station, BP Neural Network, Location, Capacity Prediction
1. Introduction
Emissions from fuel vehicles are one of the most important causes of environ-mental pollution. In order to reduce environenviron-mental pollution, governments advocate green travel like carrying on impose restriction on car license number in many countries, which has brought a lot of inconvenience to the public. If pollution caused by fuel vehicles is required to be solved fundamentally, we must replace the fuel vehicles with new energy vehicles. Some Western countries who signed the “Paris Agreement” have set a timetable for fuel vehicle sales ban: Norway’s deadline is 2025, India is 2030 and Britain and France are 2040. The Paris plans to ban the use of diesel locomotives including diesel and petrol by 2030. The Deputy Minister of the Ministry of Industry and Information Tech-nology of China also pointed out that China will consider setting a timetable for
How to cite this paper: Xu, J., Li, J., Liao, X. and Song, C.P. (2019) A Prediction Me-thod of Charging Station Planning Based on BP Neural Network. Journal of Computer and Communications, 7, 219-230.
https://doi.org/10.4236/jcc.2019.77018
Received: June 10, 2019 Accepted: July 21, 2019 Published: July 24, 2019
Copyright © 2019 by author(s) and Scientific Research Publishing Inc. This work is licensed under the Creative Commons Attribution International License (CC BY 4.0).
DOI:10.4236/jcc.2019.77018 220 Journal of Computer and Communications
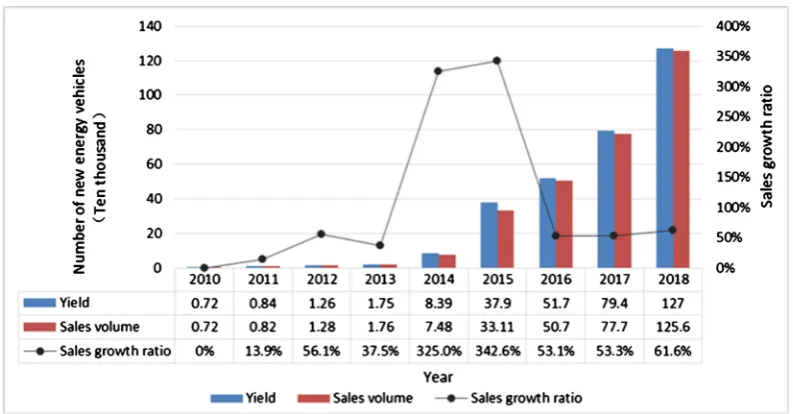
the ban on fuel vehicles, and it is imperative to develop new energy vehicles. New energy vehicles can effectively reduce the deterioration of environmental pollution and adopting new energy vehicles is an effective way to solve the dep-letion of fossil resources. Electric vehicles play an important role. With the con-tinuous improvement of battery technology, electric vehicles have become the center of the development trend of new energy vehicles. Since 2009, China’s subsidy policy for new energy vehicles has been going on for ten years. As shown in Figure 1, the sales of new energy vehicles are showing a rapid growth trend due to the government subsidy policy. The popularity of new energy vehicles is unquestionable with the largest share of electric vehicles and pure electric ve-hicles accounting for at least 80% of new energy veve-hicles. However, basic charg-ing service facilities of electric vehicles in China are still the shortcomcharg-ings of the development of new energy vehicles. The construction of charging service facili-ties is a very important factor in the popularization of electric vehicles. There-fore, the planning problems of electric vehicle charging station are urgent to be solved.
[image:2.595.143.540.500.707.2]The location and capacity prediction are most part in the planning and its problems are generally regarded as an optimization problem. Literature [1] pro-vides a new research perspective by considering uncertainty, qualitative and quantitative factors into the site selection assessment, and presents the main-stream penetration of BN as a powerful decision-making tool in the context of electrical energy management. According to the actual measured vehicle arrival heat map data, the literature [2] establishes a charging load estimation model and introduces a multi-objective planning model, which takes into account the actual operational constraints of the distribution network. The literature [3] main-ly studies the location division of urban charging stations, determines the power supply range, and combines the traditional Voronoi diagram and real-time traffic flow map information. Literature [4] uses POI-specific geographic influences to
DOI:10.4236/jcc.2019.77018 221 Journal of Computer and Communications
improve POI recommendations. We use three factors to simulate the geographic impact between two POIs: the geographic impact of POI, the geographic sensi-tivity of POIs, and their physical distance. Literature [5] establish a path selec-tion model and an assessment model of urban traffic satisfacselec-tion. Considering the fact that DGs have to supply power to distribution network and EV charging stations simultaneously, a model to determine the site and capacity of DGs and EV charging stations, in which the minimum total cost, the lowest network loss and the highest traffic satisfaction are taken as the objectives, is built and solved by new multi-objective free-search algorithm, and then a Pareto solution set is achieved. Literature [6] presents a location method of electric vehicle charge sta-tion based on data driven. Potential traffic demand, including traffic origin and destination are extracted with massive location data. Map is divided into grids with the same interval. Traffic demand of each grid is calculated. Grids with large traffic demand are selected as the alternative location for electric charging station.
Previous researches have focused on economic and social standards such as financial constraints and service capacity constraints, construction costs, and service convenience. There has been almost no qualitative analysis of previous studies. For example, environmental factors are rarely considered, including effects of air quality and lightning strikes. In order to promote car users’ love for environment and awareness of protection, it is possible to consider building charging station in a place where air quality is relatively poor. Most methods used today are multi-objective optimizations and few people apply deep learning method to the area. With arrival of the big data era, it is a matter of time before deep learning is applied to the planning field of electric vehicle charging stations. The charging stations currently in use is increasing and the data is getting better and better which providing a good environment for deep learning in this field.
2. BP Neural Network
The BP (error Back Propagation, BP) neural network consists of an input layer, one or more hidden layers, and an output layer. Each layer contains several neural unit nodes. One node is a learning unit. The output value is set by input values, weights, thresholds and activation functions. A simple mathematical model of a neural node:
1
n
j i ji i j
Z =
∑
= w X −θ(1)
( )
j j
y = f Z (2)
where, i: Number of nodes in the input layer; j: Number of nodes in the output layer;
(
1, 2, ,)
i
X i= n : Enter information;
ji
w : Weight of two layers of neuron nodes; j
θ : Threshold; j
Z : Total input;
( )
jDOI:10.4236/jcc.2019.77018 222 Journal of Computer and Communications j
y : Output information.
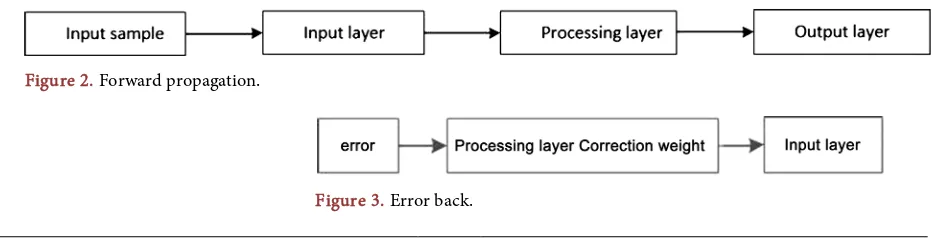
The BP algorithm is divided into two parts that is forward propagation and error back propagation shown in Figure 2.
If actual output does not match expected output, the process of error back propagation begins shown in Figure 3.
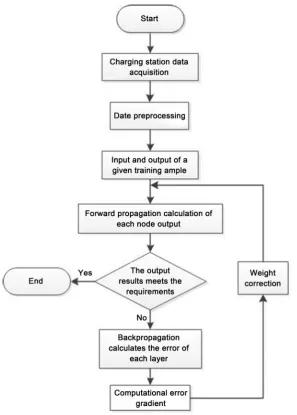
The training process of BP neural network consists of two processes: forward propagation of information and back propagation of error. Firstly, the weights between the nodes of each layer of the neural network are randomly initialized, and the input layer receives the information provided by the training samples. According to the weight of the network and the transfer function between the layers, the information is processed by forward propagation, and finally the cal-culation is performed. Obtaining the output value and completing a forward propagation process; when the actual output of the neural network does not match the expected output, it enters the back propagation phase of the error, and reverses the error of each layer from the output layer, using an optimization al-gorithm. Adjust the weight between the nodes of each layer until the output er-ror of the network reaches the preset requirement or reaches the preset number of learning. The forward and backward propagation is the process of constant adjustment of weights and the training process of BP neural network, as shown in Figure 4.
3. Evaluation System for Electric Vehicle
Charging Station Planning
[image:4.595.73.539.619.738.2]There are many factors affecting planning of electric vehicle charging stations. In the paper, five standards such as natural environment standards, social stan-dards, traffic stanstan-dards, grid standards and economic stanstan-dards, are subdivided into 15 sub-criteria, and their evaluation indicators are standardized. According to value of each sub-standard, corresponding evaluation value is given, and the higher the evaluation value is, the more favorable to the planning of the charging station. Among influence factors of charging station location, there are both qu-alitative and quantitative indicators and the units and standards are also variant between different influence factors. If data range input is quite different, it may lead to long training time of the neural network, slow convergence rate and large difference in the proportion of different influence factors. Therefore, the stan-dardization of data is contributed to facilitate the training and modeling of the neural network.
Figure 2. Forward propagation.
DOI:10.4236/jcc.2019.77018 223 Journal of Computer and Communications Figure 4. Modeling process of charging station planning based on BP neural network.
3.1. Natural Environment Standard
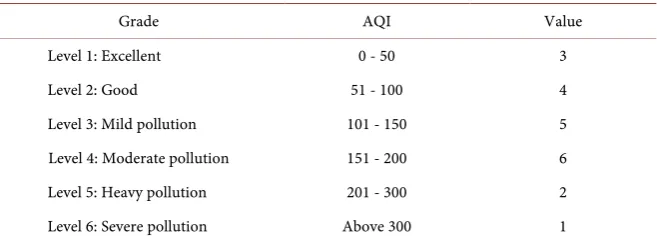
For the previous research issues in charging station planning, the impact of the natural environment is rarely considered. The natural environment also has a certain influence in the planning of charging stations, such as Thunderstorm Days and Air Quality Index (AQI).
As shown in Table 1, thunderstorm Day refers to numbers of days of lightning discharge in a region indicating the frequency of lightning activity in different regions. The charging station must be built in a safe place. If selected address is easily get lightning damage, it will not only threaten the safety of people, but also increase the cost of adding lightning protection function in the charging station.
DOI:10.4236/jcc.2019.77018 224 Journal of Computer and Communications
protection, fuel vehicles are designed to replace fuel vehicles. Charging stations should be built in places with high pollution levels without affecting people health, which can raise public awareness of environmental protection and en-courage citizens to use electric vehicles. Therefore, the evaluation values of moderate pollution and mild pollution are high and serious or severe pollution has affected people health so it is not conducive to built the charging station and then come with low evaluation value.
3.2. Social Standard
[image:6.595.124.536.263.744.2]The social function properties and development of the area where the charging station is located have an important impact on the charging station. As shown in
Table 4, it specifically includes three aspects.
Table 1. Thunderstorm day evaluation form.
Thunderstorm day Value
0 - 20 5
21 - 30 4
31 - 40 3
41 - 50 2
[image:6.595.206.542.285.379.2]Above 50 1
Table 2. Air quality index evaluation form.
Grade AQI Value
Level 1: Excellent 0 - 50 3
Level 2: Good 51 - 100 4
Level 3: Mild pollution 101 - 150 5
Level 4: Moderate pollution 151 - 200 6
Level 5: Heavy pollution 201 - 300 2
Level 6: Severe pollution Above 300 1
Table 3. Natural environment standard evaluation form.
Variable name Impact factor Value
N1 Thunderstorm day (5, 4, 3, 2, 1)
N2 Air quality index(AQI) (6, 5, 4, 3, 2, 1)
Table 4. Social standard evaluation form.
Variable name Impact factor Value
S1 Regional functions (residential area, office area, leisure area, commercial area) (4, 3, 2, 1)
S2 Regional development level (from development to maturity) (1, 2, 3)
[image:6.595.210.539.410.530.2]DOI:10.4236/jcc.2019.77018 225 Journal of Computer and Communications
It takes a certain amount of time for the electric vehicle to charge, so the func-tion of the area where the charging stafunc-tion is located directly affects the use of the charging station. The charging station near the residential area is the most convenient to use, charging at home time to avoid affecting the use of cars and wasting time. The charging station in the office area is also convenient for the public.
The degree of development of the region also has an impact on the charging station. The area is divided into three levels from developing to maturity, and the evaluation values are: 1, 2, and 3.
Many charging stations are built in the parking lot, where the electric vehicle can be charged and parked as well, which not only saves land resources, but also improves the convenience of charging electric vehicles.
3.3. Traffic Standard
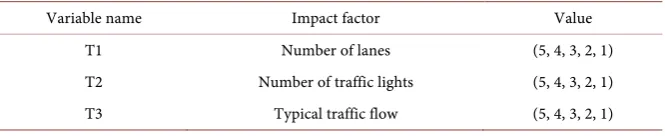
Traffic has the most important impact on the planning of the charging station. According to the data collected by the existing charging station, the number of lanes, the number of traffic lights, and the typical traffic volume are reasonably divided into sections, and the corresponding intervals are set. The specific stan-dards are shown in Table 5.
As for the number of lanes, according to the number of lanes in the 5 kM range of the station, the more lanes there are, the more convenient the traffic is, and the higher the evaluation value is.
The number of traffic lights and traffic lights can improve the safety and sta-bility of traffic, but as the number of traffic lights increases, it will affect the smoothness of traffic and lower the evaluation value.
The typical traffic flow and traffic flow intuitively reflect the ability of the charging station to intercept the vehicle. As the traffic volume increases, the evaluation value increases.
3.4. Grid Standard
[image:7.595.207.540.657.725.2]The construction of the charging station is inseparable from the grid environ-ment and affects each other. The capacity of the charging station will affect the stability of the power grid, the stability of the power grid and the quality of ser-vice of the charging station [7]. As shown in Table 6, it is divided into 4 aspects. The greater the loads of the recent important points are, the more favorable it is for the construction of the charging station, and the expansion of the charging station is allowed, so that the future development of the charging station will be
Table 5. Traffic standard evaluation form.
Variable name Impact factor Value
T1 Number of lanes (5, 4, 3, 2, 1)
T2 Number of traffic lights (5, 4, 3, 2, 1)
DOI:10.4236/jcc.2019.77018 226 Journal of Computer and Communications Table 6. Grid standard evaluation form.
Variable name Impact factor Value
G1 Recent important load point level (4, 3, 2, 1)
G2 Important load point distance (3, 2, 1)
G3 Channel resource availability margin (3, 2, 1)
G4 The impact of charging stations on grid stability (2, 1)
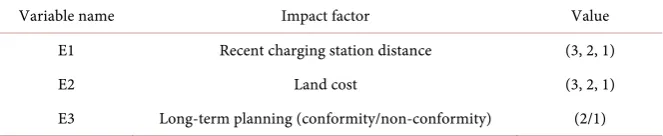
Table 7. Economic standard evaluation form.
Variable name Impact factor Value
E1 Recent charging station distance (3, 2, 1)
E2 Land cost (3, 2, 1)
E3 Long-term planning (conformity/non-conformity) (2/1)
more flexible and the evaluation value will be higher.
The closer the distance to the important load point is, the lower the construc-tion cost of the charging staconstruc-tion is, and the higher the evaluaconstruc-tion value is.
The available margin of channel resources is related to the future planning of the nearby power grid. The higher the available margin of the channel resources are, the higher the evaluation value is.
The degree of influence of the charging station on the grid is divided into two levels. If the charging station has a relatively large impact on the power grid, it is not conducive to the construction and operation of the charging station.
3.5. Economic Standard
As shown in Table 7, when the charging station is close to other charging sta-tions, the traffic flow of the charged electric vehicles will be dispersed, and the more serious the consequences of mutual influence, the lower the evaluation value is.
High land cost will increase the construction cost of the charging station and reduce its economic efficiency. The low land cost is more conducive to the con-struction and operation of the charging station.
If the location cannot meet the urban planning, it may be dismantled in the near future and cause unnecessary waste and reduce economic efficiency. Therefore, it is in line with the long-term planning of the city, which is condu-cive to the development of the charging station, and then come with high evalu-ation value.
4. Electric Vehicle Charging Station Planning Model
4.1. Electric Vehicle Charging Station Planning Model Construction
[image:8.595.207.539.201.269.2]DOI:10.4236/jcc.2019.77018 227 Journal of Computer and Communications Table 8. Algorithm of BP neural network.
Input: training set Z=(x yk, k); learning rate
Algorithm process: BEGIN:
1. Randomly initializing weights and thresholds within the range of (0, 1); 2. Repeat;
3. For all (x yk, k)∈Z do
4. Calculating the output of the current sample from the current parameters and the training set;
5. Calculating a gradient term of the output layer neuron from the mean square error and the output of the current sample;
6. Calculating the gradient term of the hidden layer neuron according to the error; 7. Update weights and thresholds;
8. End for
9. Until reaches the stop condition;
Output: charging station planning model, weighted and threshold-determined multilayer feedforward neural network
Location model: The influence factors are collected for the operation charging station and make data standardized, and then put processed data as input. The charging station is evaluated according to the actual operation of the charging station and the evaluation of the professional, and put evaluation value as an output to constitute a training set and construct a stable location neural network model.
Capacity prediction model: The processed influence factor is taken as input, actual operation capacity of charging station as output to get a training set con-structing a stable capacity prediction neural network model. The data collected by the candidate station is processed and input into the location model and the capacity prediction model, and the evaluation value of the charging station can-didate station location and the predicted capacity are output.
4.2. Experiments and Applications
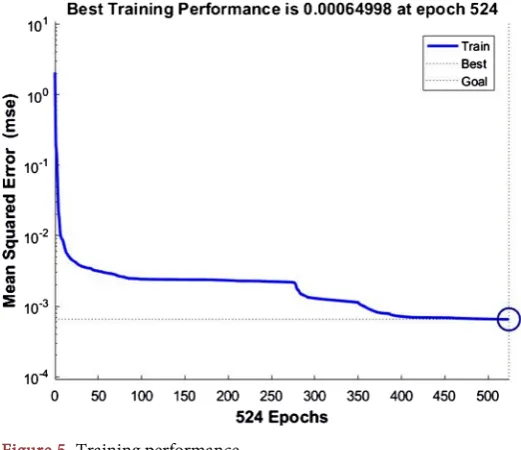
In the paper, the data collected from 50 charging stations putting into operation are used as training samples. According to government’ urban planning and field survey, five charging station candidate stations are selected, and the data of these five candidate stations are input into the model for prediction. According to relevant theoretical experience and many experiments, the target error is set to 0.00065, the learning rate is 0.05, and the maximum number of training is 50,000. After the training set is trained, the mean square error of the network reaches the optimal level after 524 iterations, and a stable charging station plan-ning neural network model is obtained. As shown in Figure 5, the mean square error of the model achieves the desired performance. As shown in Figure 6, the regression state reached 0.99839.
As shown in Figure 7, the red “○” represents the network output evaluation
DOI:10.4236/jcc.2019.77018 228 Journal of Computer and Communications Figure 5. Training performance.
[image:10.595.242.503.70.295.2]Figure 6. Regression state.
DOI:10.4236/jcc.2019.77018 229 Journal of Computer and Communications
seen that the network output evaluation value and the actual input evaluation value are basically the same, achieving a good learning effect. The five red “○”s
at the back represent the predicted charging station evaluation values.
As shown in Figure 8, the red “○” represents the network output capacity,
and the blue “+” represents the actual input capacity. It can tell that the network output capacity is same with the actual input capacity basically and achieving a good learning effect. The five red “○”s on the back represent the predicted
charging station capacity.
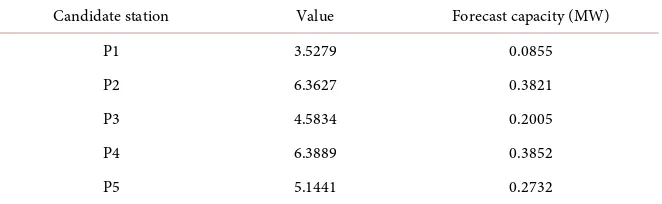
The results of the five charging station candidate stations are shown in Table 9. According to the output results of the electric vehicle charging station plan-ning model based on BP neural network, among the five candidate charging sta-tions, the evaluation values P2 and P4 are the higher indicating the environment around the candidate station are suitable for the construction and operation of charging station. The result of the model output can be used as an important reference for the actual location of the charging station. According to the capac-ity and actual situation predicted by the model, the capaccapac-ity can be selected as: 0.4 MW, 0.4 MW.
5. Conclusion
[image:11.595.226.522.462.567.2]In this paper, the influence factors are divided into five standards and 15 sub-standards affecting electric vehicle charging stations such as natural envi-ronment standards, social standards, traffic standards, power grid standards and economic standards establishing an evaluation system for charging station plan-ning. By analyzing data, the BP neural network algorithm was introduced and data was collected and standardized based on the 15 sub-standards, through
Figure 8. Training data and forecast data for charging station capacity.
Table 9. Prediction results of five candidate stations.
Candidate station Value Forecast capacity (MW)
P1 3.5279 0.0855
P2 6.3627 0.3821
P3 4.5834 0.2005
P4 6.3889 0.3852
[image:11.595.209.540.617.719.2]DOI:10.4236/jcc.2019.77018 230 Journal of Computer and Communications
which we can get a training set. Through BP neural network training, an electric vehicle charging station planning model is obtained based on BP neural net-work. Compared with the traditional multi-objective optimization method, the proposed method adopts the data of the charging station in operation, so the impact factor is more comprehensive and model is more in line with the actual operation effect of the charging station. The charging station planning problem should not only consider the quantitative indicators, but also consider the qua-litative indicators. The big data is applied to the charging station’s location and capacity prediction problems successfully and solve the charging station plan-ning problem with deep learplan-ning.
Conflicts of Interest
The authors declare no conflicts of interest regarding the publication of this paper.
References
[1] Seyedmohsen, H. and Sarder, M.D. (2019) Development of a Bayesian Network Model for Optimal Site Selection of Electric Vehicle Charging Station. International
Journal of Electrical Power and Energy Systems, 105, 110-122.
https://doi.org/10.1016/j.ijepes.2018.08.011
[2] Zhang, J., Zhou, H. and Li, H. (2017) Multi-Objective Planning of Charging Stations Considering Vehicle Arrival Hot Map. 2017 IEEE Conference on Energy Internet
and Energy System Integration, Beijing, 26-28 November 2017, 1-6.
https://doi.org/10.1109/EI2.2017.8245374
[3] Yin, X. and Zhao, X. (2016) Planning of Electric Vehicle Charging Station Based on Real Time Traffic Flow. 2016 IEEE Vehicle Power and Propulsion Conference, Hangzhou, 17-20 October 2016, 1-4.https://doi.org/10.1109/VPPC.2016.7791751
[4] Wang, H., Shen, H. and Ouyang, W. (2018) Exploiting POI-Specific Geographical Influence for Point-of-Interest Recommendation. Proceedings of the 27th
Interna-tional Joint Conference on Artificial Intelligence, Stockholm, 13-19 July 2018,
3877-3883. https://doi.org/10.24963/ijcai.2018/539
[5] Liu, B., Huang, X., Li, J., Qian, X. and Cheng, J. (2015) Multi-Objective Planning of Distribution Network Containing Distributed Generation and Electric Vehicle Charging Stations. Power System Technology, 39, 450-456.
[6] Yang, Z. and Gao, Z. (2018) Location Method of Electric Vehicle Charging Station Based on Data Driven. Journal of Transportation Systems Engineering and
Infor-mation Technology, 18, 143-150.
[7] Cui, Q., Weng, Y. and Tan, C.-W. (2019) Electric Vehicle Charging Station Place-ment Method for Urban Areas. IEEE Transactions on Smart Grid, 1.
https://doi.org/10.1109/TSG.2019.2907262