Journal of Environmental Protection, 2011, 2, 231-242
doi:10.4236/jep.2011.23027 Published Online May 2011 (http://www.SciRP.org/journal/jep)
Study of the Temperature Distribution in a Road
Tunnel under the Effect of Two Ventilation
Systems
Kalech Brahim, Bouterra Mourad, El Cafsi Afif, Belghith Ali
LETTM, Faculty of Sciences of Tunis, University of Tunis-El Manar, Tunis, Tunisia. Ema
Received October 18th, 2010; revised January 13th, 2011; accepted February 10th, 2011.
ABSTRACT
This paper proposes numerical investigations carried out on a small scale tunnel model airing to study the fire-induced smoke control by longitudinal and longitudinal-natural ventilation systems. We studied the effect of two ventilation sys-tems on the temperature distribution and stratification of the pollutant to estimate the efficiency of ventilation syssys-tems. The flow is characterized by the temperature fields, temperature profiles and the Froude number. The numerical tool used is FDS (version 4.0). This numerical study requires validation with an experience of literature. Good agreement with experimental results confirms the possibility of using this code in the problem.
Keywords: Tunnel Fire, Ventilation, FDS, Stratified Flow, Temperature
1. Introduction
Generally, a tunnel fire has very complex flow structure because it is a physical phenomenon that is affected by tunnel geometry, inclination, ventilation system capacity, and wind pressure, also including chemical reaction, etc. Efficient control of smoke propagation, therefore, is one of the most important issues in designing tunnel ventila-tion. A full understanding of the characteristics of smoke propagation in tunnels is a necessity in order to proceed with a successful design.
Thermal stratification is an important feature of fire environment in a confined space. It has been found that relative influence of inertia and buoyancy forces resolves the stratified flow characteristics. In this study under-standing the characteristics of flow is characterized by the stratification and temperature distribution.
The ventilation system installed in a tunnel must en-sure a safe environment under both emergency condi-tions and normal condicondi-tions. Smoke movement should be controlled in a fire incident. The design of ventilation systems for road tunnels depends on various parameters, such as the expected design fire and desired smoke clear height. Under normal conditions, the tunnel ventilation system design aims to prevent accumulation of vehicular emissions to dangerous levels. For dilution ventilation, fresh air entering the tunnel would mix with vehicle
emissions. The polluted air will be exhausted conse-quently by the tunnel ventilation system. The volume of fresh air required, traffic density and tunnel length are the design parameters in normal conditions. The Ventila-tion systems commonly installed for road tunnels are longitudinal, semi-transverse, transverse, partial trans-verse and natural ventilation systems. There are many variations and combinations of systems, such as the combination chosen in our study of longitudinal and nat-ural systems.
prime criteria for the design of longitudinal ventilation system.
The natural ventilation system is based on the buo- yancy of the smoke as the first criterion to control the smoke, and largely depends on the thickness and temper-ature of the smoke under the ceiling.
Numerical study, by using FDS, is performed by using a large eddy simulation to give a quantitative description of the temperature stratification and heat flux from a square fire source in a ventilated tunnel. Numerical si-mulation analyzed the effect of the aspect ratio on smoke movement in tunnel fires and temperature distribution under the tunnel ceiling will be studied by Sung Ryong Lee et al. [1]. The back-layering length, the critical ven-tilation velocity and the temperature distribution under the ceiling in tunnel fires will be studied by Hu et al. [2].
The longitudinal temperature distribution under the tun- nel ceiling at different longitudinal ventilation velocities have been studied experimentally and numerically. [3,4].
Numerical simulations have also been tried to predict the fire development and to investigate into the efficien-cy of different smoke control methods in tunnels [5-7].
Experimental tests in reduced scale are performed to study the fire characteristics, smoke movement and con-trol of smoke in case of a tunnel fire. A semi-empirical model has been developed to evaluate the physical cha-racteristics of fire in tunnels by Mégret et al. [8]. Wu et al. [9], by using a horizontal model tunnel with propane gas burner as the fire source, studied a control of smoke flow using longitudinal ventilation system.
Experimental study of the smoke temperature distribu-tion along the tunnel ceiling under the effect of the lon-gitudinal velocity of ventilation was studied bay Hu and al [10]. Study the fire-induced smoke control by longitu-dinal and transverse ventilation systems [11]. To under-stand the phenomena, Vauquelin [12] studied the critical velocity is evaluated for different channel dimensions and for different buoyant source characteristics to deter-minate the influence of these parameters on the critical velocity.
Hwang et al. [13] studied the critical ventilation ve-locity and described the stratification and the temperature distribution in tunnel fires. Hwang studied the stratifica-tion based on the experimental study of Newman. New-man [14] described the temperature stratification in tun-nel fires by the Froude model is defined by the following relation:
( )
12 ref r ref ref V T
f F f
T T gH T ∆ = = ∆ ∆
where ΔT is a temperature difference associated with the stratification; Tref is the reference temperature; Vref is
the reference flow velocity; g is the acceleration due to gravity; H is the characteristic dimension of the duct. In this study as in the study of Hwang et al. [2] a Froude number is used based on: ∆ = ∆T Tcf ;
ref avg
T =T ; Vref =Vavg
with in avg
avg in in
avg in
T
V u u
T ρ
ρ
= ≈
Three regions can be defined:
Region I: For r 0.9, cf 1.7
avg T F T ∆ ≤ ≤
∆ ; i.e., buoyancy dominating temperature stratification.
Region II: For 0.9 r 10, 0.12 cf 1.7 avg T F T ∆ ≤ ≤ ≤ ≤
∆ i.e.,
significant interaction of the ventilation velocity with the fire-induced buoyancy occurs.
Region III: For 10 r, cf 012 avg T F T ∆ ≤ ≤
∆ i.e., stratification
is insignificant.
Also note that Hwang and al [13] showed that the Froude model is independent of the dimensions of the geometric configuration.
The smoke movement has been described mainly from equations derived by applying Froude number preserva-tion, combined with some experimental data from a model channel [12,15]. The approximate Froude model-ing requires geometric similarity, and does not apply to a full-scale tunnel. Functional relationships have been de-rived from laboratory-scale tests [9,15-17].
Kunsh [16] derived an expression that takes into ac-count the effect of the aspect ratio of the tunnel cross- section on the critical ventilation velocity.
Falin Chen [18] review the progress of research on smoke propagation in tunnels, wherein the tests in full-scale tunnels, the nature of fire, the smoke propaga-tion behavior in tunnels and the longitudinal ventilapropaga-tion systems.
project [20]. The main objective of this series of tests was to determine the heat output of fire in tunnels and the velocity profile upstream of the fire. In the full-scale, the transverse and longitudinal ventilation configurations were studied in the Memorial Tunnel Program [21].
When a fire occurres in a tunnel, a buoyant smoke flow is formed below the ceiling along the tunnel. The development of a buoyant smoke layer in a tunnel can be summarized into four phases or regions [22,23]
-Impinging region of rising plume on the ceiling -Radial spread of smoke under the ceiling after im-pingement
-Interaction with side walls, and thus the transition re-gion to one-dimensional spread
-One-dimensional spreading
The mechanism for the tunnel plume distribution is the interaction of the air flow with the plume and the interac-tion of the plume with the tunnel walls.
In a tunnel fire situation, since the fresh air is supplied via the ventilation upstream from the fire, there would be rapid air entertainment into the fire plume upstream compared with the downstream area. The entrainment rate is responsible for the flame height and the characte-ristics of the fire plume. Heat transfer from the smoke to the cooler ceiling can reduce the temperature and friction force and also the smoke velocity. Ceiling area plays an important role in the movement of the ceiling jet. The geometry of a tunnel is an important factor affecting growth and development of a fire.
This paper presents numerical investigations carried out on a small scale tunnel model to study the fire-in- duced smoke control by longitudinal and longitudin-al-natural ventilation systems, for certain types of tunnels, based on the criterion of flow stratification and tempera-ture distribution.
2. Numerical Model
The Fire Dynamics Simulator (FDS) is being developed at NIST (National Institute of Standards and Technology) (2006) to study fire behavior and to evaluate the perfor-mance of fire protection systems in buildings. An ap-proximate form of Navier-Stokes equations appropriate for low Mach number applications is used in the model. The approximation involves the filtering out of acoustic waves while allowing for large variations in temperature and density. To handle sub-grid scale convective motion, a large eddy simulation technique is used in which the large-scale eddies are computed directly and the sub-grid scale dissipative processes are modeled. Fire-driven flow in FDS is simulated by LES turbulence model. Details on
the numerical model may be found in [24,25]. The com- puter program can be used to analyze fire related prob-lems, such as temperature, velocity and concentration distribution.
FDS solves flow equations numerically. The physical equations include Navier-Stokes equations for flow analysis, energy conservation equations for temperature distribution, and other scalar equations for smoke and particles transport. Governing equations are described as follows (NIST, 2006):
Conservation of mass:
( )
0t
ρ ρ
∂ + ∇ ⋅ =
∂ u (1)
Conservation of momentum:
(
)
up g f
t
ρ∂ + ⋅∇ + ∇ =ρ + + ∇ ⋅τ
∂
u u (2)
Conservation of energy (see Equation (3)): Conservation of species:
( )
( ) l
l l l l
Y
Y D Y W
t
ρ ρ ρ ⋅
∂ ′′′
+ ∇ ⋅ = ∇ +
∂ u (4)
CFD simulation is now a practical tool in fire engi-neering for simulating buoyancy-induced flows [26,27]. Turbulence methods commonly used in CFD are based on the Reynolds Averaging Navier-Stokes equation (RANS) method, Large Eddy Simulation (LES) and Di-rect Numerical Simulation (DNS).
In this study used Large Eddy Simulation (LES) me-thod. The application of LES techniques to fire is aimed to extract greater temporal and spatial fidelity from si-mulation of fire. This model explicitly calculates the turbulent large scales and models the effects of smaller ones using sub grid closure rules. LES of reacting flows can resolve the instantaneous position of a large-scale flame, so that LES captures the low-frequency variations of flow parameters. The approach based on LES has a particular advantage over the Reynolds-Averaging pro-cedures which is that only the effects of small-scale tur-bulence motion have to be modeled. The balance equa-tions for LES are obtained by filtering the instantaneous balance equations.
In predicting smoke movement by LES, two points should be considered [24,25,28]:
-Fine enough grids; and
-A suitable Sub-grid Model (SGM) on small eddies. The grid size should be fine enough to include the turbulence scales associated with the largest eddy mo-tions which can be described accurately by the SGM.
( )
( )
r l l l
l
h Dp
h q q k T h D Y
t Dt
ρ
ρ ⋅ ρ
∂ ′′′
+ ∇ ⋅ − = − ∇ ⋅ + ∇ ⋅ ∇ + ∇ ⋅ ∇
The ratio of the largest to the smallest eddy length scales that can be resolved by the computation with the current- hardware limitations giving a few million grids is about 100 [24].
The LES Sub-grid Model commonly used in LES was developed originally by Smagorinsky. In LES, the eddy viscosity was obtained by assuming that the small scales are in equilibrium, by balancing the energy production and dissipation [24,28]. A refined filtered dynamics sub-grid model was applied in the FDS model to account for the sub-grid scale motion of viscosity, thermal con-ductivity and material diffusivity [24]. The dynamic vis-cosity defined in FDS is
(
)
2ijk ijk Cs S
µ =ρ ∆ (5)
where Cs is the empirical Smagorinsky constant,
1 3
( x y z)
∆ = δ δ δ and the term S consists of second-order
spatial differences averaged at the grid centre. The ther-mal conductivity kijk and material diffusivity Dijk of
the fluid are related to the viscosity µijk in terms of the Prandtl number Pr and Schmidt number Sc by:
p ijk ijk r C k P µ
= (7)
(
)
ijk ijkc
D S µ
ρ = (8)
Both Pr and Sc are assumed to be constant. The spe-cific heat Cp is taken to be that of the dominant species of the mixture [24]. The constants Cs, Pr and Sc are de-faulted in FDS as 0.2, 0.5 and 0.5, respectively.
The Courant-Friedrichs-Lewy (CFL) was used in FDS [24] to justify convergence. This criterion is more im-portant for large-scale calculations where convective transport dominates the diffusive one. The estimated velocities are tested at each time step to ensure that the CFL condition is satisfied [24]:
max max uijk ,vijk , wijk 1 t
x y z
δ ⋅ <
δ δ δ
(9)
The initial time step was set automatically in FDS by the size of a grid cell divided by the characteristic veloc-ity of the flow.
Default values of the initial time step is
(
)
1 35 δ δ δx y z gH where δ δx y, and δz are the
di-mensions of the smallest grid cell, H is the height of the
computational domain, and g is the gravitational accele-ration [24]. During the calculation, the time step is vary-ing and constrained by the convective and diffusive transport speeds to make sure that the CFL condition is satisfied [24].
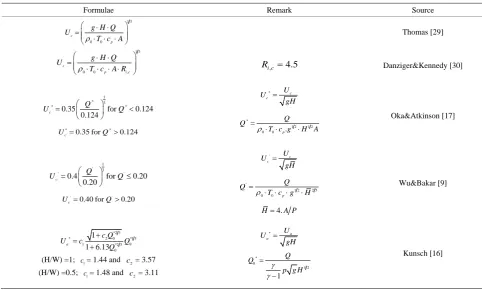
The time step is eventually changed to a quasi-steady value when the fire burns steadily. The results from a numerical analysis are sensitive to the grid size used. In this study we chose the time step to be sure that the CFL condition is verified, in order to obtain a good conver-gence. The most recent models derived to calculate the critical ventilation velocity are those presented by [9,16,17,29,30,] in Table 1.
This study used dimensionless velocity and dimen-sionless heat release rate with the tunnel hydraulic height as the characteristic length in the analysis. The study of the fire plume showed that the critical ventilation veloci-ty is determined by the interaction of the fire with the fresh air ventilation flow and the tunnel walls. The flow behaviors should be studied in three dimensions. The presence of the tunnel wall has a strong influence on the fire plume distributions. The tunnel fire situation is in principle different from the one where fire plume im-pinges on a ceiling, in which the buoyancy force in the ceiling flow is a function of the ceiling height. In a tun-nel fire, the buoyancy force in the back layering is due to the whole fire plume. Although the problem is three-di- mensional, at the critical ventilation conditions, the flow in the tunnel can be divided into three sections, they are the fresh air flow section, the fire plume section and the downstream smoke flow section. In each section, the mean hydraulic tunnel height is the characteristic length for the flow. Therefore it provides a basis for using the hydraulic tunnel height as the characteristic length in the dimensionless analysis study.
The following equations for dimensionless heat re-lease rate and the critical ventilation velocity in this study:
1 2 5 2
0 0 p
Q Q
T c g H
ρ
′′ =
⋅ ⋅ ⋅ ⋅ (10)
c c
U U
gH
′′ = (11)
where Uc′′ and Q′′ are the dimensionless critical ven-
tilation velocity and dimensionless heat release rate. where ρ0 is ambient air density, cp is heat capacity
2 2 2
2 2 2
2
2
2 2 2 ( )
3
u v w u v u w v w
S
x y z x y z x z y
∂ ∂ ∂ ∂ ∂ ∂ ∂ ∂ ∂
= + + + + + + + + − ∇ ⋅
∂ ∂ ∂ ∂ ∂ ∂ ∂ ∂ ∂
of the hot gases, T0is the ambient temperature and g the acceleration due to gravity (g = 9.81 m/s2). The ex-pression of H isH=4.A P. A cross-sectional area of the tunnel and P is the tunnel perimeter.
The geometric configuration of the field study is shown in Figure 1(a). The longitudinal computational domain, L=14.92 m, was divided into five segments Figure 1(b). Segment 1 is the upstream section of the tunnel, its length is 2.01 m and δ0.03 mx= . Segment 2 has a length 3.00 m and δ =x 0.02 m. Segment 3 was the burner section of length 2.41 m and δ =x 0.01 m. Segment 4 has a length 2.82 m and δ =x 0.02 m. Seg-ment 5 is the downstream section of the tunnel, its length is 4.68m and δ =x 0.03 m. Non-uniform distribution of the mesh allows us to maintain a sufficient degree of accuracy in the solution. Width, W = 0.5 m, is meshed with δ =y 0.01 m and height, H = 0.25 m, is meshed withδ =z 0.01 m.
The first plane of the longitudinal domain was set to be the inlet of the ventilation flow and the last plane was set as naturally opened with no initial velocity boundary condition specified. The circular burner was simulated as a square burner with different dimensions suitably to each release rate. The side of the source varies from 0.08 to 0.26 m for 1.5 with heat release rate up to 30 kW. These fire sizes correspond to fires of approximately 2.5 – 50 MW in a reality. A propane gas burner was used to
simulate the fire source, for designating a fire to pre-scribe a Heat Release Rate Per Unit Area (HRRPUA) on a SURF line.
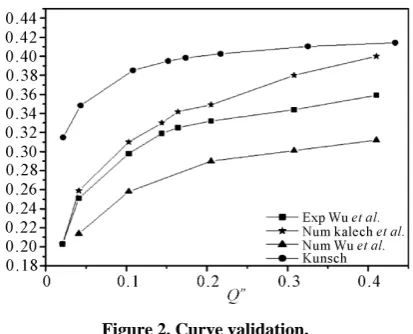
A Validation of Simulations against the experimental results available in the public literature by Wu et al. and the model of Kunsch in Figure 2. The critical velocity is plotted as a function of the heat release rate in dimen-sionless form. In our study the critical velocity taken as reference is that which with a back-layering does not exceed the height “H” of the tunnel to multiply by 2.25.
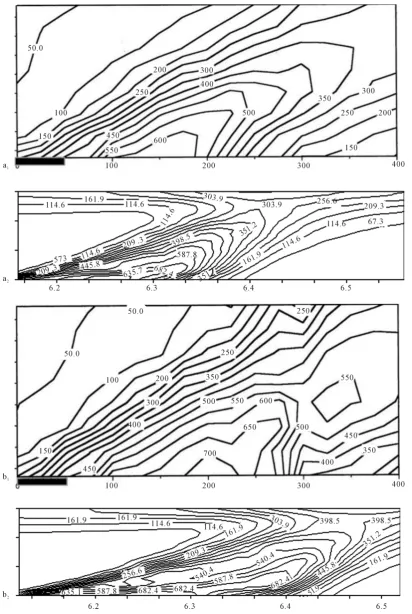
Figure 3 Shows that the isoclines of temperature. The comparison between numerical values and those of the experiment gives good agreement.
A good agreement was obtained with the simulated current values for the temperature and the critical value of the ventilation velocity.
3. Results and Discussion
The fire simulation is done by a plume. This problem is complex for the presence of the longitudinal air flow. First, the trajectory of the fluid is diverted downstream of the flow. The problem is with geometry and characteris-tic of the plume, the flow can take several forms. The important parameters are the angle of inclination of the plume and the balance between buoyancy and momen-tum in the plume. In this study, the geometric configura-tion as shown in Figure 4, is identical for all simulations
Table1.The models derived to calculate the critical velocity of ventilation.
Formulae Remark Source
1 3 .
0 0
c
p
g H Q U
T c A
ρ ⋅ ⋅ ⋅ ⋅ =
⋅ Thomas [29]
1 3 .
0 0 ,
c
p i c
g H Q U
T c A R
ρ ⋅ ⋅ ⋅
⋅ ⋅
= ⋅
Ri c, =4.5 Danziger&Kennedy [30]
1 .* 3
* .*
0.35 for 0.124
0.124
c
Q
U = Q <
* .*
0.35 for 0.124
c
U = Q >
* c c U U gH = . .*
1 2 1 2
0 0 p.
Q Q
T c g H A
ρ = ⋅ ⋅ ⋅ Oka&Atkinson [17] 1 ' 3 ' '
0.4 for 0.20
0.20
c
Q
U = Q≤
' '
0.40 for 0.20
c
U = Q>
' c c U U gH = '
1 2 2 5
0 0 p
Q Q
T c g H
ρ =
⋅ ⋅ ⋅ ⋅
4.
H= A P
Wu&Bakar [9]
*2 3 2 0
* *1 3
1 *2 3 0
0 1 1 6.13
a
c Q
U c Q
Q + =
+
(H/W) =1; c1= 1.44 and c2= 3.57 (H/W) =0.5; c1= 1.48 and c2= 3.11
* a a U U gH = * 0 5 2 1 Q Q
p g H γ γ =
−
[image:5.595.55.538.433.723.2]Figure 1. (a) Geometric configuration; (b) Boundary condi-tion and mesh distribucondi-tion.
Figure 2. Curve validation.
as it was previously defined in the validation, even for the mesh, the turbulence model and boundary conditions. In all cases by setting the velocity of longitudinal venti-lation and the heat release rate convected. The width “d” of opening equal to 0.04 m.
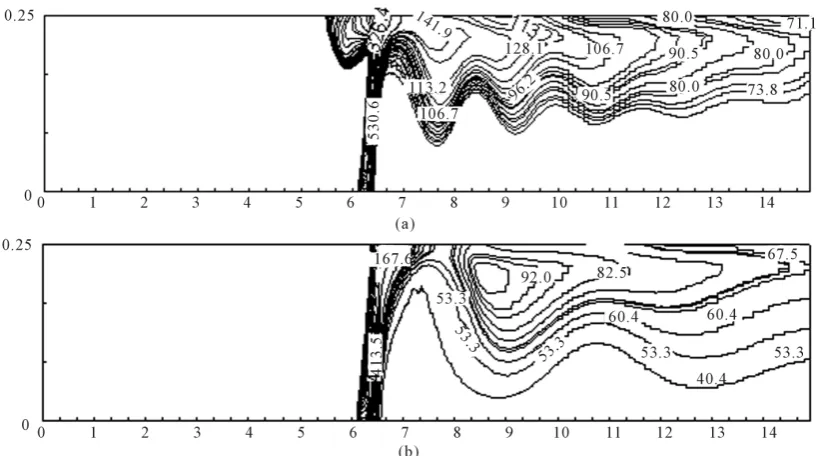
The longitudinal ventilation velocity had a large in-fluence, on the smoke temperature distributions, as shown in Figures 5 and 6. For these temperature fields in Figures 5(a) and 6(a), the temperature at 0.1 m away from the fire was higher upstream than downstream, and were nearer at 0.15 m position. At further away positions, they were much lower upstream than downstream.
This phenomenon should be due to their different physics embedded for upstream positions near the fire and far away. At the near fire position, the incoming lon-gitudinal ventilation velocity would act like a barrier, the heat would accumulate at these positions and the local temperature would be higher, while for the upstream positions some further away, beyond the barrier, the
smoke front upstream would shear with the oppositely coming longitudinal velocity, resulting in more air en-trainment and faster temperature decrease.
At velocity of ventilation equal to 0.62 m/s, the critical velocity of ventilation, in Figure 5(a) the temperature reached 700˚C at the source. In the upstream side of the source the temperature varies from 145˚C to 290˚C and in the downstream side of the source the temperature va-ries from 80˚C to 145˚C. In Figure 6(a), at the source the temperature reached 640˚C and in the downstream side of the source the temperature varies from 90˚C to 145˚C.
The highest temperature is below the ceiling and it degrades according to the length of the tunnel. For the mixed ventilation system the values of temperature are highs then values of longitudinal ventilation system.
There is a bigger jump temperature values depending on the height of the tunnel, for the mixed ventilation system as the longitudinal ventilation system, as shown in Figures 5(a) and 6(a), then there exists a layer of smoke largest below the ceiling for the mixed ventilation system. Hence we can deduce that the flow is stratified, at the critical velocity of longitudinal ventilation equal to 0.62 m/s, for the mixed ventilation system.
For high velocity of ventilation in Figures 5(b) and 6(b), the temperature in the upstream side of the tunnel is the ambient temperature. Downstream of the tunnel, the temperature is distributed over almost the entire height of the tunnel as the recorded values are 40˚C to 90˚C in the right before the opening and 40˚C to 160˚C in the left before the opening.
The temperature values are almost equal. The flow is homogeneous, there is a mixture between air ventilation and the smoke which is delayered (destratification) flow and reduces the temperature values relative to the longi-tudinal air flow at low velocity of ventilation.
With longitudinal ventilation system and at the critical velocity of ventilation, in the upstream side of the tunnel, the velocity of smoke becomes zero because all the quantity of pollutant is transported to the downstream tunnel. During this, with the ventilation system mixed (longitudinal-natural) a large amount of pollutants has been convected to the upstream portion of the tunnel for low velocity of ventilation. Has the opening to the left is a pressure difference between the inside of tunnel and the environment, it is an area of suction.
[image:6.595.69.276.309.476.2]Figure 4. Geometric configuration adopted for simulations.
Figure 5. Temperature contour at y = 0.25 plane or the mixed ventilation system (with opening) Q = 10.5 kW. (a) U= 0.62 m/s; (b) =1.1 m/s.
Figure 6. Temperature contour at y = 0.25 plane for the longitudinal ventilation system Q = 10.5 kW, (a) U = 0.62 m/s; (b) = 1.1 m/s.
[image:8.595.95.504.462.690.2]The vertical temperature distribution at the down-stream side of the tunnel is shown in Figure 7. The rec-orded values of temperature are close to average for the two ventilation systems.
In exit of tunnel at Section 14.92 m,twotemperature profiles almost similar.
In Section 10.3 m between the right opening and down the tunnel, for mixed ventilation system, the temperature equal to 20˚C in the floor and increases slowly until it reaches 25˚C at a height of 0.1m, then it increases pro-gresely until it reached 80˚C to 0.17 m and in the end it increases sharply to reach 130˚C below the ceiling. However, with the longitudinal ventilation system, it is expected that the temperature reached 45˚C at 0.05 m, 70˚C at 0.1 m and 0.15 m from it would be equal to 105˚C up to the ceiling. The vertical temperature profile for the longitudinal ventilation system does not admit an inflection point behavior the mixed ventilation system, compared to the mixed ventilation system, the tempera-ture increase is progressively along the vertical direction, i.e. the flow is homogeneous.
In Section 7.3 m , the temperature rise shows a steady and slow increase but experiences a sharp increase at an intermediate height H = 0.12 m for mixed ventilation system. Then the temperature increases progressively along the height of tunnel. In reality, thermal stratifica-tion still exists although it is very small, its effect is not negligible during all phases or a front separating the hot section and cold section exists in the tunnel, as it is al-ready presented in Figure 7. In reality such a front is unstable. The advance of the front is followed by spot-ting sudden rises in temperature as it passes.
It is very difficult to define the interface smoke-fresh air from continuous temperature profile especially for large velocity of ventilation. We note that the profile has an inflection point in its upper part. This inflection point corresponds to the maximum temperature gradient, can therefore be regarded as representing the boundary be-tween two layers of flow. The thermal stratification and the consequent flow patterns correlated well with the Froude number, for the case where we have used open-ing and for other case.
Buoyancy and the inertia force are the two dominant factors that affect the fire-induced thermal stratification. The fire-induced buoyancy trends to maintain the stabil-ity of stratification, while the forced ventilation-induced inertia force trends to mix the flows. Thus, the fire-induced stratification depends upon the magnitudes of these two competing mechanisms. Froude number was usually used to characterize the fire-induced hot layer which represents the ratio of inertia force to buoyancy force [9]:
1 2
avg r
cf
avg
V F
T gH T
=
∆
(11)
where ∆Tcf is the difference between the temperature near the ceiling and the temperature near the floor, Tava
is the average temperature in a section, Vava is the
av-erage flow velocity; g is the acceleration due to gravity; H is the height of the channel.
With: in avg
avg in in
avg in
T
V u u
T ρ
ρ
[image:9.595.378.455.87.141.2]= ≈
Figure 8plots the Froude number of hot layer versus the ventilation velocity, The Froude number who is used as indicating of stratification.
At Region Fr <1, the buoyant flow stratification is stable, where a distinct interface exists between the upper smoke layer and the lower air layer. The effect of buoyancy is more significant than the momentum forces in this case. Note also that for the temperature profiles we can see the point of inflection in the shape of the curve. The flow is more stably stratified because com-bined effect of momentum of heat input corresponds to very low Froude number.
At Region Fr ≥1, the buoyant flow stratification is insignificant but with interfacial instability. By increas-ing the ventilation velocity, the buoyant flow stratifica-tion becomes unstable, with a strong mixing between the buoyant flow and the air flow. Froude number as shown in Figure 8, for the same heat release rate converted equal to 10.5 kW, the Froude number is more important for the longitudinal ventilation system in all longitudinal sections.
Between the right opening and exit of the tunnel, in sections 10.3 m and 14.92 m, the flow is unstable for the velocity of ventilation roughly equal to 0.85m/s and it is completely destratified for velocities of ventilation supe-rior to last for the two ventilation systems.
In approaching of the tunnel exit, the difference be-tween the Froude number of longitudinal ventilation system and the Froude number of mixed ventilation sys-tem increases.
In Section 7.3 m, between the source and the right opening, and with a velocity of ventilation equal to 0.85 m/s, the Froude number between 0.8 and 0.9 for the mixed ventilation system (1) and equal to 1.35 for the longitudinal ventilation system (2).
(a)
(b)
(c)
Figure 7. The vertical temperature profiles at downstream of the tunnel, at (a) 7.3 m; (b) 10.3 m; (c) 14.92 m for 10.5 kW and U in = 0.85 m/s. (1) mixed ventilation system ;(2) longitudinal ventilation system.
Figure 8. Froude number versus the velocity of ventilation in tunnel fires at different sections.
Fr = 0.3 in section 7.3 m and Fr≈ 0.9in sections 10.3
mand 14.92 m, for the mixed ventilation system. For the longitudinal ventilation system, the flow is laminated just at the section 7.3 m, between the source and the right opening. Fr = 1 at the section 10.3 m i.e the flow is
un-stable and Fr = 1.15 at the exit of the tunnel here the
de-stratified flow.
This last interpretation on the stratification with U = 0.62 m/s shows the favors to use of the openings to the ceiling and their influence on the stratification of flow. The flow is much more stratified with mixed ventilation system especially using the critical velocity of ventilation of the longitudinal ventilation system.
The longitudinal velocity affects the thermal stratifica-tion especially:
Firstly, longitudinal velocity generally results in the decrease in the hot layer temperature and increase the longitudinal velocity of upper buoyant flow, by enhanc-ing the heat and mass exchange between the hot stratified layer and the lower cool layer.
Secondly, longitudinal velocity air flow increases the mixture between the upper hot layer and lower cool layer.
The characteristics of buoyant flow stratification de-pend upon the magnitudes of buoyancy of the smoke flow itself and the inertia force induced by longitudinal air flow.
Instability of stratification resulted in a strong mixing between the buoyant flow and the air flow, and thus a thickened buoyant smoke layer. It also resulted in the smoke flow being pulled down to the lower spaces of the channel. Under such a condition, the human evacuation could be threatened by the smoke. These factors are recommended to be taken into account in the design of ventilation strategy for a fire emergency in a channel-like construction.
For some types of tunnels, sharp tunnels, and while relying on an important criterion which is manifested by the temperature distribution and stratification, we can conclude that it is more efficient to use the ventilation system mixed longitudinal natural than the longitudinal ventilation system.
REFERENCES
[1] S. R. Lee and H. S. Ryou, “A Numerical Study on Smoke Movement in Longitudinal Ventilation Tunnel Fires for Different Aspect Ratio,” Building and Environment, Vol. 41, No. 6, 2006, pp. 719-725.
[image:10.595.72.272.85.493.2] [image:10.595.69.276.553.687.2]
[3] L. H. Hu, R. Huo, W. Peng, W. K. Chow and R. X. Yang, “On the Maximum Smoke Temperature under the Ceiling in Tunnel Fires,” Tunnelling and Underground Space Technology, Vol. 21, No. 6, 2006, pp. 650-655.
[4] L. H. Hu, R. Huo, H. B. Wang and R. X. Yang, “Expe- rimental and Numerical Studies on Longitudinal Smoke Temperature Distribution Upstream and Downstream from the Fire in a Road Tunnel,” Journal of fire sciences, Vol. 25, No. 1, 2007, pp. 23-43.
[5] S. M. Jojo and W. K. Chow, “Numerical Studies on Performance Evaluation of Tunnel Ventilation Safety Systems,” Tunnelling and Underground Space Techno- logy, Vol. 18, No. 5, 2003, pp. 435-52.
[6] J. Modic, “Fire Simulation in Road Tunnels,” Tunnelling and Underground Space Technology, Vol. 18, No. 5,
2003, pp. 525-530.
[7] M. Banjac and B. Nikolić, “Numerical Study of Smoke Flow Control in Tunnel Fires Using Ventilation Systems,” FME Transactions, Vol. 36, No. 1, 2008, pp. 145-150.
[8] O. Mégret and O. Vauquelin, “A Model to Evaluate Tunnel Fire Characteristics,” Fire Safety Journal, Vol. 34, No. 4, 2000, pp. 393-401.
[9] Y. Wu and M. Z. A. Bakar, “Control of Smoke Flow in Tunnel Fires Using Longitudinal Ventilation Systems—A Study of the Critical Velocity,” Fire Safety Journal, Vol. 35, No. 4, 2000, pp. 363-90.
[10] L. H. Hu, R. Huo, H. B. Wang, Y. Z. Li and R. X. Yang, “Experimental Studies on Fire-Induced Buoyant Smoke Temperature Distribution along Tunnel Ceiling,” Building and Environment, Vol. 42, No. 11, 2007, pp. 3905-
3915.
[11] O. Vauquelin, “Experimental Simulations of Fire-Induced Smoke Control in Tunnels Using an ‘Air-Helium Reduced Scale Model’: Principle, limitations, Results and Future,” Tunneling and Underground Space Technology, Vol. 23, 2008, pp. 171-178.
[12] O. Vauquelin, “Parametrical Study of the Back Flow Occurrence in Case of a Buoyant Release into a Rectangular Channel,” Experimental Thermal and Fluid Science, Vol. 29, 2005, pp. 725-731.
[13] C. C. Hwang and J. C. Edwards, “The Critical Ventilation Velocity in Tunnel Fires—A Computer Simulation,” Fire Safety Journal, Vol. 40, No. 3, 2005, pp. 213-244.
[14] J. S. Newma, “Experimental Evaluation of Fire-Induced Stratification,” Combust Flame, Vol. 57, No. 33, 1984, pp. 33-39.
[15] H. Kurioka, Y. Oka, H. Satoh and O. Sugawa, “Fire Properties in Near Field of Square Fire Source with Longitudinal Ventilation in Tunnels,” Fire Safety Journal, Vol. 38, No. 4, 2003, pp. 319-340.
[16] J. P. Kunsch, “Simple Model for Control of Fire Gases in a Ventilated Tunnel,” Fire Safety Journal, Vol. 37, No. 1,
2002, pp. 67-81.
[17] Y. Oka and G. T. Atkinson, “Control of Smoke Flow in Tunnel Fire,” Fire Safety Journal, Vol. 25, No. 4, 1995,
pp. 305-322.
[18] F. Chen, “Smoke Propagation in Road Tunnels,” Institute of Applied Mechanics, National Taiwan University, Taipei, Applied Mechanics Reviews, Vol. 53, No. 8, 2000,
p. 207
[19] G. B. Grant, S. F. Jagger, and C. J. Lea, “Fires in Tunnels,” Philosophical Transactions of the Royal Society—Theme Issue on Fire Dynamics, Vol. 356, No. 1748, 1998, pp. 2873-2906.
[20] G. B. Grant and D. Drysdale, “Estimating Heat Release Rates from Large-Scale Tunnel Fires,” Fire Safety Science,Vol. 5, 1995, pp. 1213-1224.
[21] S. F. Luchian and A. G. Bendelius, “West Virgina Memorial Tunnel Fire,” Test Program, Proceedings of the International Conference on Fires in Tunnels, Wokingham, October 1994.
[22] M. A. Delichatsios, “The Flow of Fire Gases under a Beamed Ceiling,” Combustion and Flame, Vol. 43, No. 1,
1981, pp. 1-10
[23] J. P. Kunsch, “Critical Velocity and Range of a Fire-Gas Plume in a Ventilated Tunnel,” Atmospheric Environment, Vol. 33, No. 1, 1999, pp. 13-24.
[24] K. McGrattan, “Fire Dynamics Simulator (Version 4) Technical Reference Guide,” NIST Special Publication 1018, March 2006.
[25] K. McGrattan and G. Forney, “Fire Dynamics Simulator (Version 4) User’s Guide,” NIST Special Publication 1019, March 2006.
[26] Y. F. Li and W. K. Chow, “Computational Fluid Dynamics Simulation of Fire-Induced Air Flow in a Large Space Building: Key Points to Note,” In: Proceedings of the ASME Heat Transfer/Fluids Engin-
eering Summer Conference 2004, HT/FED 2004,
Charlotte, 1 January 2004, pp. 1163-1169.
[27] W. Zhang, A. Hamer, M. Klassen, D. Carpenter and R. Roby, “Turbulence Statistics in a Fire Room Model by Large Eddy Simulation,” Fire Safety Journal, Vol. 37, No. 8, 2002, pp. 721-752.
[28] J. Smagorinsky, “General Circulation Experiments with Primitive Equations-I, the Basic Experiment,” Monthly Weather Review, Vol. 91, No. 3, 1963, pp. 99-105.
Passages Against an Air Flow,” Fire Research Note No. 723, Fire Research Station, Watford, UK, 1968.
[30] N. H. Danziger and W.D. Kennedy, “Longitudinal Ven- tilation Analysis for the Glenwood Canyon Tunnels,” In:
Proceedings of the 4th International Symposium
Aerodynamics and Ventilation of Vehicle Tunnels, York, March 1982, pp. 169-186.
Nomenclature
A tunnel cross-sectional area, m² Subscript
P tunnel perimeter, m Avg average
Cp specific heat, KJKg–1K–1 cf difference between ceiling and floor
Fr Froude number, dimensionless c critical
g acceleration of gravity, m·s–2 in tunnel inlet
H tunnel height, m 0 ambient
H hydraulic tunnel height, m ref reference
k thermal conductivity, Wm–1·K–1 x,y,z cartesian coordinates, m
P pressure, Pa 1 mixed ventilation system
Pr Prandtl number 2 longitudinal ventilation system
Sc Schmidt number
Cd proportionality constant
Cf empirical constant
Ck empirical constant
Cs Smagorinsky constant (LES)
Q heat release rate of the fire, KW
Q′′
dimensionless heat release rate defined for correlation of critical velocity by Wu and Barker
T temperature, ˚C ρ density, Kg·m–1
U ventilation velocity, m·s–1
U′′ dimensionless ventilation velocity V velocity,m·s–1
W tunnel width, m L tunnel length, m d opening length, m
, ,
x y z