ALL-SUBSET REGRESSION AS A MEANS FOR SELECTION OF SELF-REGULATED LEARNING PROCESSES MEASURED USING THINK ALOUD PROTOCOL DATA
Christopher A. Oswald
A thesis submitted to the faculty at the University of North Carolina at Chapel Hill in partial fulfillment of the requirements for the degree of Master of Arts in the Educational
Psychology, Measurement, and Evaluation in the Schools of Education.
Chapel Hill 2018
Approved by:
Jeffrey A. Greene Jill Hamm
Matt Bernacki
ii
©2019
Christopher A Oswald ALL RIGHTS RESERVED
ABSTRACT
Christopher A Oswald: All Subset Regression as a Means for Selection of Self-Regulated Learning Processes Measured Using Think Aloud Protocol Data
(Under the Direction of Jeffrey A. Greene)
During the 1990s computers were placed into most educational classrooms; however, they sat underused or not used at all. One reason for this is students lacked the skills to use computers effectively. One set of skills that can help students make use of computers is self- regulated learning. By using think aloud protocol analysis while students complete a task on the computer, a trace of their cognition, metacognition, and behavior can be created. Analyzing these traces, however, has proven difficult due to the high number of variables compared to the typical number of participants. A solution to dealing with this problem is to analyze all possible combinations of variables. In this thesis, I compared the results of two pre-existing variable reduction methods and Best All Subset Regression. It was found that Best All Subset Regression outperformed the existing methods, by fitting better models without diagnostic problems or extensive time demands. Best All Subset Regression also retained more information than the prior methods, so I suggest using it moving forward instead of the aggregation-based methods used previously.
iv
ACKNOWLEDGEMENTS
I have been blessed to have great mentors to guide my development into research design and quantitative methods. I would like to thank to Mary Nelson for providing me with a solid foundation of statistics and guiding me in my early days, showing me how to get involved in research and the faults in the common ways people analyze data. I would like to thank Shane Murphy for allowing me to gain experience with several different methodologies and giving me experiences that few undergraduate students are granted. I would like to thank William Ware for helping me to see the beautiful simplicity of the general linear model and its extensions. I would also like to thank Jill Hamm that helped me to better understand how large texts and proposals differ from articles. I will would like to thank Matt Bernacki for coming into the second half of this thesis on no notice. While many get one expert, I am honored to have two of the names in my field of study on this committee. Finally, without Jeff Greene’s immeasurable levels of guidance and support during my stay at UNC this thesis would not be possible. I came to UNC having research experience, but I am leaving a researcher in my own right.
v
TABLE OF CONTENTS
TABLE OF CONTENTS ... v
LIST OF APPENDICES ... ix
LIST OF FIGURES ... x
LIST OF TABLES ... xi
CHAPTER 1: INTRODUCTION ... 1
Self-regulated Learning ... 3
Problems with Measuring Self-Regulated Learning ... 4
Purpose of this Thesis ... 6
Research Question ... 8
CHAPTER TWO: LITERATURE REVIEW ... 9
Computer Based Learning Environments and their Challenges ... 9
Theoretical Models of Self-Regulated Learning... 11
The Winne and Hadwin Model of Self-Regulated Learning ... 14
Measurement Methods for Studying Self-Regulated Learning ... 19
Aptitude measures of self-regulated learning ... 19
Problems of attribute-based measures of self-regulated learning ... 20
Measuring Self-regulated as an Event with Think-Aloud Protocols. ... 22
Verbal analysis. ... 24
vi
Capturing think-aloud protocol data and transcription. ... 25
Segmentation... 25
Coding the protocols. ... 25
Data products. ... 27
Summary ... 29
Statistical Models for Self-Regulated Learning ... 30
Ordinary least squares regression ... 32
Theory-driven model (full aggregation) ... 34
Data-driven model (data-based aggregation) ... 36
All-subset regression ... 40
Summary ... 47
Research Question: ... 48
CHAPTER 3: METHODS ... 49
Participants ... 49
Materials ... 49
Computer-Based Learning Environment ... 50
The Learning Task ... 51
Learning Task Procedure ... 51
Scoring Knowledge Measures ... 53
Coding Micro-Level Self-Regulated Learning Processes... 54
Data Preparation... 54
Data Analysis ... 55
vii
Second-Pass Analyses ... 58
CHAPTER 4: RESULTS ... 59
Descriptive Statistics ... 59
Creation of the Data-Driven Models ... 82
Best All Subset Model ... 84
Model results. ... 86
Regression diagnostic analyses ... 88
Second-Pass Model ... 93
Summary ... 97
Conclusion ... 98
CHAPTER 5: DISCUSSION ... 99
Theoretical Implications ... 100
Analysis Implications... 103
Data Cleaning... 105
Limitations ... 106
The garden of forking paths. ... 106
Measurement issues ... 108
Analysis issues ... 108
Future Research ... 109
Modern data analysis. ... 109
Resampling methods. ... 111
viii
Data cleaning and robust methods. ... 111
Temporal and contextual nature of self-regulated learning. ... 112
Conclusion ... 113
REFERENCES ... 126
ix
LIST OF APPENDICES
APPENDIX 1: CODED PROTOCOL ... 114
APPENDIX 2: SELF-REGULATED LEARNING PROCESSES... 115
APPENDIX 3: BLANK PRETEST1 ... 119
APPENDIX 4: MENTAL MODELS... 122
x LIST OF FIGURES
Figure 1: Winne & Hadwin Model of Self-Regulation ... 17
Figure 2: Histograms of Knowledge Measures ... 62
Figure 3: Box Plot of Learning Measures. ... 64
Figure 4: Box Plots of Self-Regulated Learning Processes ... 65
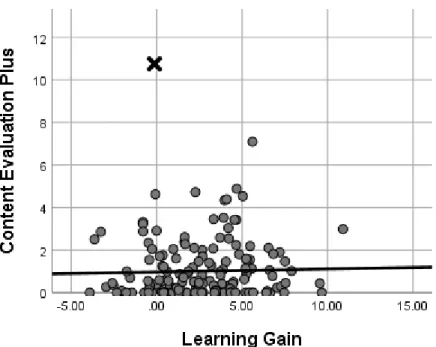
Figure 5: Scatterplot Content Evaluation Plus and Learning Gain ... 74
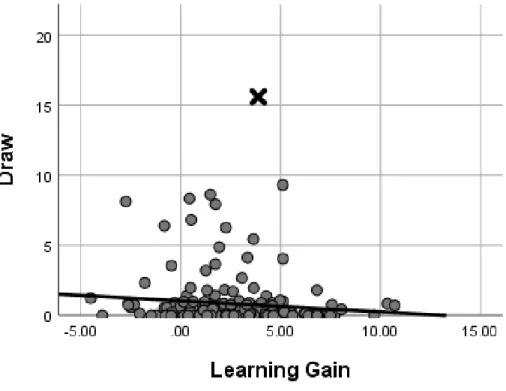
Figure 6: Scatterplot Content Evaluation Plus and Draw ... 75
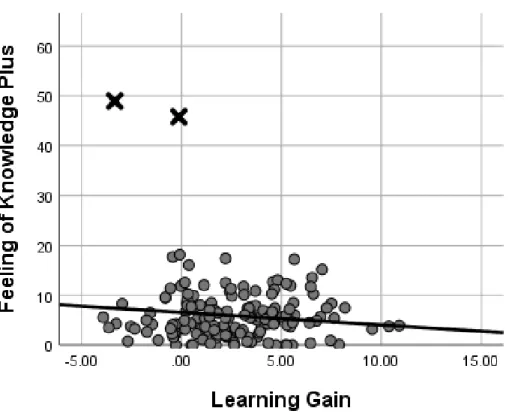
Figure 7: Scatterplot Content Evaluation Plus and Learning Gain ... 76
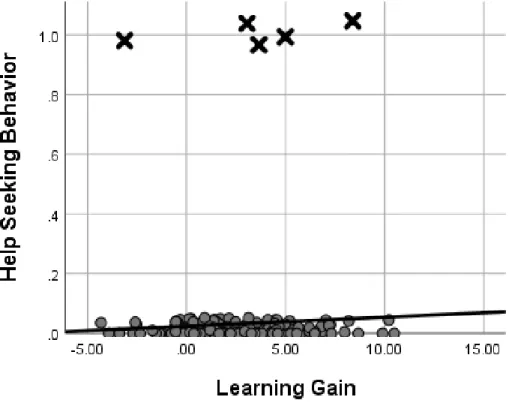
Figure 8: Scatterplot Help Seeking Behavior and Learning Gain ... 77
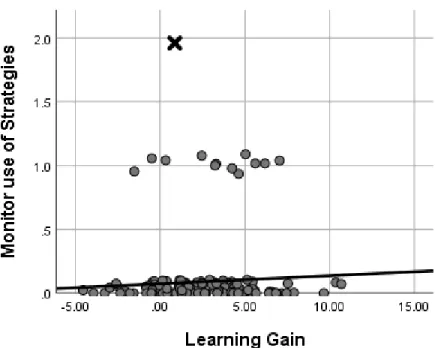
Figure 9: Scatterplot of Monitoring use of Strategies and Learning Gain ... 79
Figure 10: Scatterplot of Planning and Learning Gain ... 80
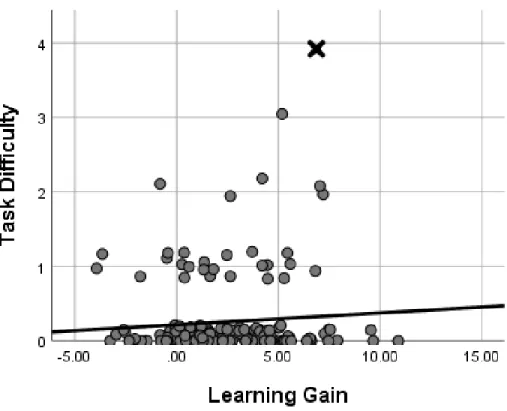
Figure 11: Scatterplot of Task Difficulty and Learning Gain ... 81
Figure 12: Boxplot of Residuals ... 89
Figure 13: Diagnostic Plots ... 91
xi LIST OF TABLES
Table 1: Descriptive Statistics ... 60
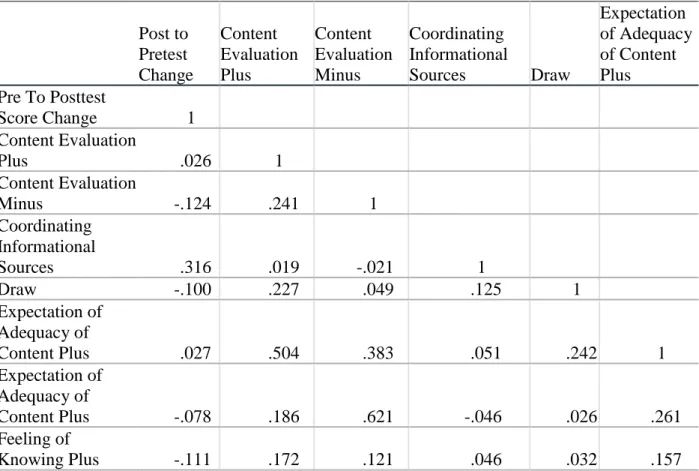
Table 2: Correlations... 68
Table 3: Data Driven Aggregation Variable Map ... 83
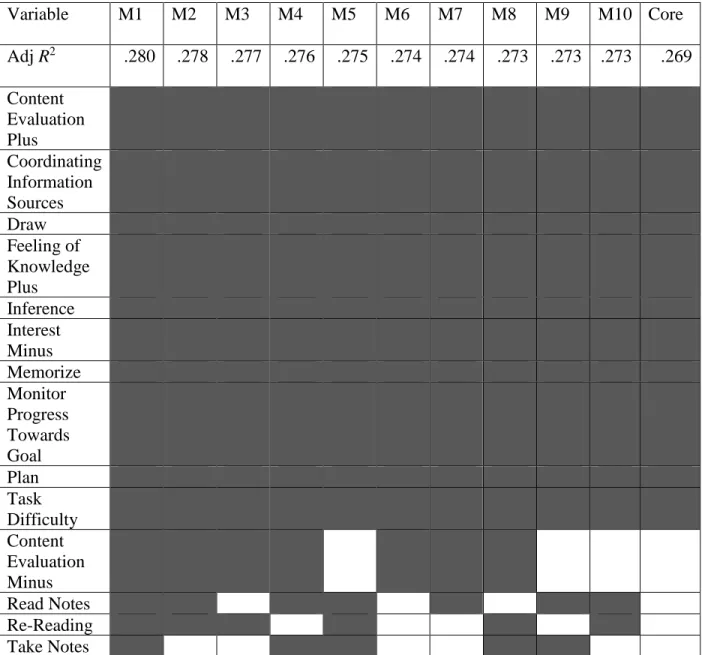
Table 4: Variable Inclusion Chart ... 84
Table 5: Betas for Best Subset Models ... 85
Table 6: Macro-level Model ... 86
Table 7: Diagnostic Tests... 90
Table 8: Variable Inclusion Chart ... 94
Table 9: Data Cleaned Model Results ... 95
1
CHAPTER 1: INTRODUCTION
The problem of variable selection is one of the most persistent and difficult problems in statistics (George, 2000; Ratner, 2010). In simple terms, variable selection is the process of separating meaningful information from extraneous information. In an educational framework, information is gathered about a great many things. For instance, information was gathered for 1,793 variables by the National Center for Education Statistics (2015) in the National
Assessment of Educational Progress survey to study the area of mathematic achievement by fourth graders in the United States. These variables included student factors such as gender or race, teacher factors such as years of teaching and attitudes, and other factors such as peer relationships or use of time outside of school. Variable selection when used with these data involves finding a small subset of predictor variables, also referred to as a regression model that correlates with mathematical achievement in test scores (Ratner, 2010). As more and more data are gathered, in part due to the rise of big data, separating the meaningful predictors from the predictors that are not useful is increasingly important. Within the context of education, variable selection is the process of separating the meaningful variables related to learning from other variables that were also collected. Once the separation is done, the meaningful variables can be examined in more detail, whereas the ones that were not found meaningful could be put to the side. One area where this is an important issue is the area of skills that children need to succeed in education and the modern world (Hattie, 2009).
With the subsequent rise of the “information superhighway” in the 1990’s (Becker, 2000), school reformers claimed that computers and computer-based learning environments
2
would revolutionize education (Sheingold, Hadley, & Thesiar Lieliillan, 1990). It was claimed that computers were naturally engaging and able to meet individual learners’ needs through multiple representations of information, such as passages of text, diagrams, videos, and interactive elements, within a learning environment (Cuban, 2001). Computers were already such a large part of the lives of students it was claimed that the modern student is a digital native (Prensky, 2001). These students, Prensky claimed, thrived on multitasking and could process several different sources of information at the same time with ease. This would cause the
students to seek out non-linear computer-based learning environments to get instant access to the information they wanted in the format they wanted the information in (Prensky, 2001). For instance, a student interested in the brain would prefer to go to a website, find a diagram of the brain, and then follow links to pages with more information on individual parts.
In the last decade researchers’ into computer-based instruction have found that digital natives are more mythical than real, however (Bennett, Maton, & Kervin, 2008; Selwyn, 2009).
Prensky (2001) predicted that the digital native would be able to use technology with ease, engage multiple sources and critically review their differences, and compare and contrast
arguments (Margaryan, Littlejohn, & Vojt, 2011). Subsequently, researchers found that, whereas digital natives could use familiar tools like word processing or email with ease, they struggled when using more advanced features of technology. For example, students tended to prefer more traditional, non-computer-based pedagogies and had trouble interacting with elements such as Blackboard or university-based computer interfaces (Margaryan, Littlejohn, & Vojt, 2011).
Researchers studying computer use in the classroom have found that not all computer use is effective at prompting learning. Scheiter et al. (2009) found that students who watched a realistic visualization of cellular mitosis had far worse scores than students given a schematic of
3
how mitosis worked. Darabi, Nelson, and Palanki (2007) found similar results where students who worked with a simulated water treatment experiencing malfunctions did not gain as much knowledge of the nature and cause of the malfunctions and how to best fix them when compared to controls groups who did not use the simulation. These negative findings demonstrate that in more complex computer-based learning environments, computers use by itself will not increase learning and may not lead to the planned learning outcomes.
Self-regulated Learning
Researchers, wanting to see the benefits of computers-based learning environments, began to rethink research about computers. Instead of assuming students would natively be able to work with computers, researchers instead asked what skills are needed to be most effective at learning with computers. One set of skills that researchers study as students learn with
computer-based learning environments is self-regulated learning (Pintrich, 2000).
Self-regulated learning can best be described as “an active, constructive process whereby learners set goals for their learning and then attempt to monitor, regulate, and control their cognition, motivation and behavior, guided and constrained by their goals and the contextual features in the environment” (Pintrich, 2000, p. 453). Several components stand out in this definition. First, learners that employ self-regulated learning skills are actively involved in their own knowledge construction. Second, they engage in goal-directed behavior that defines the task they are trying to complete. Next, they engage in metacognitive monitoring and
metacognitive control while learning. Flavell defined metacognition as “knowledge and
cognition about cognitive phenomena” (Flavell, 1979, p. 906). Metacognition is used to monitor and regulate motivational, cognitive, and behavioral strategies while problem solving,
monitoring their effect. Next, learning is guided by and constrained by the environment. For
4
example, knowledge that students use while learning is limited to the learning materials they have available for use during that learning task. Finally, students need to be motivated to engage in self-regulated learning (de Boer, Donker-Bergstra, & Kostons, 2012). Self-regulated learning use has been shown to influence student learning with a moderate effect size (Hattie, 2009).
Research has shown that self-regulated learning is particularly effective for learning in digital environments, where non-linear design and a depth of options can negatively affect student learning (Azevedo, Moos, Johnson & Chauncey, 2010; Greene & Azevedo, 2007).
Researchers have found that during learning tasks using digital environments, students’ self- regulated learning use is associated with better learning outcomes (Littlejohn, Hood, Milligan &
Mustain, 2016; Zimmerman, 2008). Furthermore, scaffolding (Devolder, van Braak & Tondeur (2012) or even prompting learners (Bannert & Reimann 2012; Bannert et al., 2015; Müller &
Seufert, 2018) to use self-regulated learning during online learning tasks has also been shown to increase student performance on learning tasks.
Problems with Measuring Self-Regulated Learning
Researchers demonstrated that one strength of the field of self-regulated learning is that it incorporates many areas (e.g., motivation, goal setting, self-evaluation) that positively relate to learning and achievement (Pintrich, 2000). However, as self-regulated learning theory draws from many different fields of study, it is often hard to break down and separate which self- regulated learning processes are important to learning during specific tasks (Boekaerts, 1996).
This leads to fragmentation (Zeidner, Boekaerts, & Pintrich, 2005), making comparing studies confusing as authors examine self-regulated learning through different theoretical lenses, each with their own labels, terminology, and construct definitions (Dent & Hoyle, 2015). Not only is this a problem, but the self-regulated learning processes used by learners may vary across
5
academic domains (Greene, Bolick, & Robertson, 2010; Moos & Miller, 2015; Wolters &
Pintrich, 1998), as well as vary from task to task (Lichtinger & Kaplan, 2015; McCardle &
Hadwin, 2015; Vandevelde et al., 2015).
One method that researchers use to study self-regulated learning processes is think-aloud protocols (Bannert, Reimann, & Sonnenberg, 2014; Greene, Robertson & Costa, 2011; Greene et
al., 2015; Moos & Miller, 2015; Schellings, van Hout-Wolters, Veenman, & Meijer, 2013;
Vandevelde et al., 2015). Think aloud protocols is methods of collecting data where students engage in a task while verbalizing their thoughts (Greene, Robertson, et al., 2011). This method allows researchers to document self-regulation processes as they occur (Greene, Dellinger, Tüysüzoğlu, & Costa, 2013). Empirical evidence shows that the results from think-aloud protocol analyses are more accurate measures of self-regulated learning than self-report survey measures, as survey methods often require learners to try to remember or judge how often they engage in certain actions after the fact or estimate how often they typically use certain strategies or engage in various actions (Veenman, 2007; Winne & Jamieson-Noel, 2003; Winne, Jamieson- Noel, & Muis, 2000). Without an existing high level of metacognition skills and ability, learners would not make accurate assessments of how often they did engage in actions.
The problem with think-aloud methods is two fold. First, it can take a great deal of time to conduct the experiment, transcribe what was spoken aloud, and perform the protocal analysis itself. The protocal analysis most used in self-regulated learning research involves a list of codes where each can be matched to verbalizations of students’ self-regulated learning use (Greene, Robertson, et al., 2011). These lists of codes can range from just coding at a macro-level for planning, motivation, or using strategies to a fine micro-level, where these macro-levels are subdivided into 50 or more codes (Greene et al., 2015) with no upper limit. This is complicated
6
further because self-regulated learning incorporates elements from so many different fields (Boekaerts, 1996), some of these studies involve measurements of more processes than there are participants, which leads to problems when it comes to analyzing the data (Greene et al., 2013;
2014). Traditional statistics assumes that there will be more subjects than predictors, but in some of these studies there are more predictor variables than there are subjects, making common methods of analysis difficult to employ (Hastie, Tibshirani, & Friedman, 2009).
Currently, two methods exist to try to deal with transforming the data from the protocol analysis into a version that researchers can analyze using traditional methods (Greene et al., 2013, 2015). The first is a method of full aggregation where researchers examine self-regulated learning on a theory-based macro-level. The second method is data-driven aggregation that involves finding the processes that most predict learning gains and those most predictive of learning losses and then combining them into new predictor variables that are a linear combination of the skills that compose them (e.g., Greene et al., 2015).
Purpose of this Thesis
In this thesis, I propose a new method for determining which self-regulated learning processes are most predictive of learning for a specific learning task. Whereas traditional regression methods fit data to a defined model, I will be employing all-subset regression to let the data define a model (Ratner, 2010). In the past, researchers considered this method too computationally heavy for use with datasets over 20 (Miller, 2002) to 40 variables (Hastie et al., 2009), but recent advances in statistical software have allowed this method to be employed without intensive computational or time resources (Yang, 2013). Researchers have attempted to determine, indirectly, a best subset of self-regulated learning processes that were predictive of learning by using data-driven aggregation that used predictors correlated with task performance
7
measures (Greene et al., 2014, 2015), but my proposed method should find the model with the best set of predictors, i.e., the predictors that maximize adjusted R2.
Potential Contributions
The two contributions of this study are in the areas of subset selection and model
assessment. Currently, researchers in this area focus on understanding the direct impact of a pre- defined model and use data driven models as a secondary method to estimate other models that may produce a better fitting model (Greene et al., 2015; Greene, Yu, & Copeland 2014). The goal of this study is to change this question to asking what is the best model that the data can produce. Researchers can use all subset regression to directly find the variable set with the greatest effect size.
Using best all subset regression is important for several reasons. First, researchers using this method can produce models that are useful in situations where there are more processes than participants (known as p > n). This is becoming more and more problematic in recent studies (Greene et al., 2014, 2015), so researchers need a method to pick which processes are useful as the process list grows, because it is not possible to calculate a full regression model in situations where p > n. Second, in statistical learning there are many methods to deal with the problem of subset selection, such as penalized regression, random forests, and multivariate adaptive
regression splines. However, they come with a tradeoff in that they are not as easy to understand in terms of how they get their solutions, or how to interpret their solutions (Hastie, Tibshirani &
Friedman, 2009). The best all subset regression method can provide a starting point to determine if the increase in complexity of interpretation is worth the improvements in model fit.
This method also allows for a way to compare the results of several studies. Researchers can use this method on several of the studies that have used the Azevedo and Greene and
8
colleagues’ method of think aloud protocol analysis (Azevedo et al., 2004; Azevedo & Cromley, 2004b; Greene & Azevedo, 2009; Greene et al., 2010), and then compare the results across studies. The learning task and knowledge measures are aligned across these studies, with each study using the same learning task about the human heart, and the same methods to assess learning. Despite some variation in the skills used, the skills in each study generalize back to the same areas of planning, monitoring, and strategy use, with most skills from the early studies being present in the later studies. So far, no attempts have been made to compare the results of these studies in a systematic manner, but this method should provide a uniform method to determine in each study which skills predict learning in that study, and the degree to which they do so, with all else held constant by examining the best models that can be created from each study and the beta weights of the skills selected. This benefit is, of course, limited to studies that use the same general methodology, learning task, knowledge measures and codebook, therefore researchers should exercise caution extending it beyond these studies.
Research Question
This thesis will examine the following research question:
1. Which variable selection method (full aggregation, data-driven aggregation, or best all subset regression) best fits the relationship between self-regulated learning and
knowledge gain in the examined dataset, defined as the one that maximizes adjusted R2.
9
CHAPTER TWO: LITERATURE REVIEW
Studying self-regulated learning use with computer-based learning environments requires a task and three models: a theoretical model, a measurement model, and a statistical model (Schraw, 2010). In this chapter, I briefly describe each model, beginning with a review of what computer-based learning environments are and how self-regulated learning skills could improve a learner’s ability to learn within a computer-based learning environment. Next, I present the theoretical models of self-regulated learning, with a focus on the Winne and Hadwin model of self-regulated learning as that is the theoretical model used for this study. Then, I discuss
measuring self-regulated learning processes, first modeling them as an attribute, as older theories have done (Pintrich, Smith, Garcia, & Mckeachie, 1993; Weinstein, Schulte, & Palmer, 1987), then as event, as the Winne and Hadwin Model of self-regulated learning does (Winne, 2010).
Following that discussion of the measurement model for this thesis, I describe the measurement protocol for this study, which employs data generated from think-aloud protocols (Chi, 1997;
Ericsson & Simon, 1980; Greene & Azevedo, 2010). Finally, I present the statistical model that I use in this thesis, all-subset regression, and demonstrate how it is an incrementally better method than the current models researchers use in analyses using the same theoretical and measurement models.
Computer Based Learning Environments and their Challenges
Computer based learning environments, such as hypermedia environments, offer an advantage over traditional classroom learners in that they can offer different sequences and modes for accessing information using multiple representations, such as texts, videos, and
10
interactive applications. Learners control the paths they take through computer-based learning environment by a series of text or image links that connect different sections of the learning environment. However, while the wide variety of options presented to learners may seem like a good thing, often the reality is that the lack of a linear structure in online learning environments hinders learning (Scheiter & Gerjets, 2007). As information becomes more complex or there is a lot of elements to interact with, students with poor metacognitive skills are not able to best use the learning material, as their working memory becomes overloaded (Scheiter & Gerjets, 2007).
When learning environments use different representations that lack integration, such as textual features and video features, the competition for learners’s working memory increases as they encounter more and more elements (Swezller & Sweller, 1994). This situation creates what Salomon (1998) called the “butterfly defect,” where learners click from link to link within a computer based learning environment, finding interesting but often irrelevant information (Kirschner & van Merriënboer, 2013).
Adding to the challenges associated with computer-based learning environments, students with low prior knowledge encounter more problems than students with high prior knowledge (Chen, Fan & Marcredie, 2006). Chen, Fan, and Marcredie (2006) found that students with high prior knowledge often used directed searches for the information they sought, examined the big picture the environment tried to present, and then moved more into the deep structures of a computer-based learning environment to find the best solution for a task. Novices, however, often followed links sequentially from the starting page, looked at the surface features of a page such as headings and bolded terms, examined the environment as pages of separate topics, and primarily sought to find any solution to their task. Such behaviors lead to worse learning outcomes than those used by students with high prior knowledge, and an incomplete
11
understanding of the material presenting in the task. What these students need most are skills that will help them deal with the cognitive demands of high information-learning environments, as well as tools to navigate through nonlinear systems. One set of skills that has been associated with better navigation in computer-based learning environments is self-regulated learning (Duffy
& Azevedo, 2015; Greene et al., 2015; Zhou & Winne, 2012).
Theoretical Models of Self-Regulated Learning
Given there are many conceptualizations and definitions of self-regulated learning (Boekaerts, 1996), a simple definition of the construct is as follows: “self-regulated learners are generally characterized as active, efficiently managing their own learning through monitoring and strategy use” (Greene & Azevedo, 2007a, p. 334). Zimmerman (2001) found that a common conceptualization of the construct is the degree to which learners are metacognitively,
motivationally, and behaviorally active in their own learning. He found three features that were key to self-regulated learning: first, self-regulated learners actively use metacognitive,
motivational, and behavioral strategies; second, they employ a feedback loop to monitor their use of strategies and react to this feedback; and third, self-regulated learners have the motivation to engage in self-regulatory activity. Taking these three features together, self-regulated learners set goals and select and employ self-regulated strategies to achieve these goals using feedback to guide them (Zimmerman, 2001, 2013).
One view on self-regulated learning is that it is the intersection between cognitive and metacognitive theory (Dinsmore & Zoellner, 2018). From cognitive theory comes strategy usage. Mayer defines cognitive strategies as “cognitive processes that the learner intentionally performs to influence learning and cognition” (2001, p. 86). These processes can be simple
12
things such as general learning methods, including taking notes, to comparing the different narratives presented in a historical task (Greene et al., 2015).
If strategy use is the how of self-regulated learning, metacognition is the when, where, and why to use these strategies. Metacognition research began with Flavell’s (1971) and
Brown’s (1977) studies into learners’ knowledge of cognition and regulation of cognition during learning. From this base, metacognition researchers quickly become focused on two major areas, metacognitive knowledge and regulation of metacognition (Veenman, van Hout-Wolters, &
Afflerbach, 2006). There are three areas of metacognitive knowledge often discussed. The first is declarative knowledge. This is knowledge about cognition as well as cognitive and
metacognitive strategies (Schraw & Dennison, 1994), as well as factual knowledge (Schraw, Crippen, & Hartley, 2006). Procedural knowledge is knowledge about how to do things (Schraw, 2006). In metacognition, the knowledge of how to implement strategies for breaking up and solving problems is called procedural knowledge (Pressley & Harris, 2006). Finally, conditional knowledge represents the when, where, and why of using procedural knowledge and
declarative knowledge (Schraw, 2006). Conditional knowledge is part of the broader knowledge construct of self-regulatory knowledge, which is composed of not only knowing when and where to apply strategies and declarative knowledge but also knowledge related to the regulation of metacognition, such as planning, monitoring, and evaluation (Mayer & Wittrock, 2006).
Another area of metacognition is metacognitive experiences. Flavell (1979) saw
metacognitive experiences as overlapping with metacognitive knowledge but still being distinct.
Efklides (2009) defined metacognitive experiences as “manifestations of online monitoring of cognition as the person comes across a task and processes the information related to it” (Efklides, 2009, p.78). These experiences include feelings of not understanding information presented as
13
well as when learners feel they have encountered information previously. These experiences can lead to strategy use as well as the creation and modification of goals. One of the most common metacognitive experiences that occurs in everyday life is the “tip of the tongue” state where a learner is sure that they have knowledge of something but cannot recall what it is (A. S. Brown, 1991). For educators, two of the most important metacognitive experiences are feelings of knowledge and judgments of learning (Schwartz, 1994). A feeling of knowing is the belief that a piece of information can be recalled from memory. These feelings occur before a learner tries to retrieve knowledge from memory. Judgments of learning are cognitive judgments that learners will remember what they have learned at a future point in time (Narens, Jameson, & Lee, 1994).
Learners can use these estimates to determine how effective their learning has been and whether they need to change or modify their strategies. Within the context of self-regulated learning, negative judgments of learning, in which a learner feels they do not understand what they just encountered, can prompt the learner to engage in adaptive metacognition and change their strategies for solving a task (Binbasaran Tuysuzoglu & Greene, 2015).
One area of self-regulated learning that is not so easy to pin down is motivation. While cognition and metacognition remain key parts of self-regulated learning theory, the role of motivation varies from model to model. In some models, motivation is infused throughout. This was the case with Pintrich’s model where the motivation factor interacts with contextual,
cognitive, and behavioral factors (Schunk, 2005). Boekaerts’ (1996) model of self-regulated learning separates out cognitive and motivational aspects in self-regulated learning into two distinct paths. Zimmerman’s (2013) model present motivation as belief or factors that occur in the forethought phase. These differences influence how researchers study motivation’s role in self-regulated learning (McDuffy & Azevedo, 2013), as well as different empirical conclusions
14
on the role it plays in each model. Whereas strategy use and metacognition are well defined concepts in self-regulated learning theory, motivation is less defined in terms of what it empirically means. Greene and Azevedo (2007) defined motivation in self-regulated learning theory as including goal orientation, self-efficacy, expectancy-value theory, self-determination theory, and interest whereas Boeakarts (1996) went further, classifying most of what Greene and Azevedo focused on into one area, motivational beliefs, and adding to them motivational
strategies and motivational self-regulation, noting that overlap and broad descriptions of motivation made studying the distinct effects of motivation extremely difficult.
The Winne and Hadwin Model of Self-Regulated Learning
The Winne and Hadwin (1998) model of self-regulated learning is based on information processing theory, and has been used by researchers to study self-regulated learning in computer- based learning environments (Duffy & Azevedo, 2015; Greene et al., 2015; Zhou & Winne, 2012). For this study, it will be the model used to produce the targets of measurement for analysis that define what skills modern learners need. The model consists of five aspects referred to as COPES, an acronym for conditions, operations, products, evaluations, and standards (Winne, 2001). Conditions are the resources and constraints the learner has to work within as they complete a task. These conditions include declarative, procedural, and
metacognitive knowledge and can include goal orientation, time constraints, background knowledge, and knowledge of tactics and strategies. Operations consist of the different cognitive and metacognitive strategies a learner employs during the task and include the procedural knowledge-based strategies that can range from primitive cognitive abilities to
complex multilevel strategies. Products are units of information generated by the operations and include plans for engaging in operations, such as changes to the learner’s knowledge or external
15
products such as notes or test answers. Evaluations are knowledge products produced by metacognitive monitoring that are used to compare standards to products of operations.
Evaluations include judgments made about learning, utility of tactics, efficacy, and attributions about products. Standards are the qualities that good products consist of, by which knowledge products are evaluated. Standards can be created by prior knowledge, such as past performance in graded tasks, and are influenced by effort and utility thresholds and motivational orientations (Winne, 2001).
The four phases of the Winne and Hadwin Model are (a) defining the task, (b) goal setting and planning, (c) enacting tactics, and (d) adapting metacognition (Winne, 2001). The phases are defined by the products they produce. During the task definition stage, students use their prior knowledge and the information that prompts the task to create a personal
understanding of the task. Cognitive conditions in this stage are beliefs the learner has and their metacognitive, procedural, and declarative knowledge about the task or similar tasks. These conditions are used in the second phase to define goals that will guide task completion. These goals are updated as the task goes on and new knowledge is constructed. In the third phase, learners enact strategies from their procedural knowledge and limited by the conditions to solve the task. Here, products are compared to the goals by evaluating the products and standards to see if the products have met the standards defined in Phase 2 to complete the goal. Internal feedback drives this stage, as metacognitive monitoring is used to determine if the methods used to complete the task are effective or not, and metacognitive control is used if the learner needs to change tactics. As the learner gains more knowledge about the task, they may go back to Phase 2 and redefine the goals. The final stage is adaptive metacognition. In this stage, the learner’s procedural and metacognitive knowledge may be used to allow the learner to change which
16
operations they use to solve a problem, re-conceptualize operations, or change their cognitive conditions by changing their beliefs or knowledge. These stages are not linear, and after the task begins the learner may moves between the first three phases freely (Winne, 2001). This model is presented visually in Figure 1.
17
Figure 1: Winne and Hadwin Model of Self-Regulation
Of the model’s four stages, it is the first three that are of interest to this study. These stages are (a) task definition, (b) planning, and (c) the enacting of tactics and strategies. The model also provides a framework for the targets of measurements. The COPES framework’s operations, products, and evaluations will be focused on for this study. While this model has a heavy information-processing focus, it shares many aspects of other cognitive models (Winne &
Perry, 2000; Zimmerman, Heart, & Mellins, 1989); metacognitive monitoring and control,
planning, evaluation, and active use of strategies are not unique to the Winne and Hadwin model.
Therefore, the use of this model is to be a guide to examine self-regulated learning from not just an information processing view but a general cognitive one as well.
Effectiveness of self-regulated learning. Researchers have demonstrated the effectiveness of self-regulated learning in several meta-analyses. Dignath, Buettner and Langfieldt (2008) found an overall mean effect size of g = .62 for self-regulated learning interventions on learning outcomes in primary educational tasks, and a follow-up meta-analysis by Dignath and Buettner (2008) found a similar result for the effects of self-regulated learning interventions on performance outcomes of d = .68 for primary school learners and d = .71 for secondary school learners. Donker, Boer, Konstons, Van Ewvik, and van der Werf (2014) found that across domains and grade levels effect size for self-regulated learning interventions was d = .66. Examining these results, the estimated range for the effectiveness of self-regulated learning interventions is between d = .62 and d = .71, which Cohen (1992) defined as a medium to large effect size. Hattie (2009) found in education the average effect size for any intervention was d = .4; therefore, interventions based on self-regulated learning are above average in terms of
effectiveness. The evidence shows that not only are self-regulated learning interventions effective, but they produce positive outcomes over numerous studies.
19
Measurement Methods for Studying Self-Regulated Learning
There have been many methods suggested to measure self-regulated learning, ranging from surveys and interviews to behavioral traces and direct observation (Winne & Perry, 2000).
This section starts with a brief review of self-regulated learning measurement methods, first as an aptitude, then as an event. Aptitude measures of self-regulated learning assume that self- regulated learning is a set of stable abilities or predispositions (Winne & Perry, 2000). For instance, a student may score high on a survey measuring motivation and planning, meaning in a future task they may be highly motivated and engage in many plans. However, researchers have started to move away from this assumption, as self-regulated learning has begun to be
reconceptualized as a dynamic, contextual system of events (Ben-Eliyahu & Bernacki, 2015).
Aptitude measures of self-regulated learning. During the late 1980s and early 1990s, researchers assessed self-regulated learning as an aptitude that was defined as a metacognitive, motivational, and behavioral construct (Zimmerman, 2008). The Learning and Strategies
Inventory or LASSI, (Weinstein et al., 1987) is an 80-item self-report inventory of strategies that students use during their studying that employs a 5-point Likert scale measuring how true the questions were of the students studying patterns. Subscales produced by this measure include concentration, selecting main ideas, information processing, motivation, attitude, anxiety, time management, study aids, self-testing, and test strategies (Zimmerman, 2008).
A second survey developed to measure self-regulated learning, and the most common way of measuring self-regulated learning as an aptitude in a computer-based learning
environment context (Saks & Leijen, 2014), is the Motivated Strategies for Learning
Questionnaire, or MLSQ, (Pintrich et al., 1993). This is an 81-item self-report survey that has students respond to questions on a 7-point Likert scale describing how true the questions are of
20
them. This measure has three main sections: a motivation scale, a cognitive scale, and a resource management scale. Subscales of the motivation scale include measures of intrinsic goal
orientation, extrinsic goal orientation, task value, control of learning beliefs, self-efficacy for learning and performance, and text anxiety. The learning strategies scale has measures of rehearsal, elaboration, organization, critical thinking, and metacognitive self-regulation. The resource management scale includes measures of time and study environment management, effort regulation, peer learning, and help seeking. Researchers have used this survey to study many different aspects of motivation and self-regulated learning in a variety of domains such as middle school physical education students, female engineering students, and gifted high school students. Researchers in different fields also have employed this survey, such as in research on course structure, cooperative learning, multimedia design, and video teleconferencing (Duncan
& Mckeachie, 2005 Ben-Eliyahu & Bernacki). The strongest aspect of this scale is that it is so widely employed: at the time of one study’s publication, Duncan and Mckeachie (2005) found on Google hundreds, if not thousands, of results for the use of this survey.
Researchers found these tools were effective at predicting achievement (Pintrich et al., 1993; Zimmerman & Bandura, 1994; Zimmerman & Martinez-Pons, 1986). A meta-analysis of studies using the MSLQ found that it did predict student achievement with a low to moderate effect size (Credé & Phillips, 2011). These studies using self-report data helped establish the field of self-regulated learning by first showing that there was a link between self-regulated learning and achievement, improved the construct formation of what is self-regulated learning, and identified areas for future study (Duncan & Mckeachie, 2005).
Problems of attribute-based measures of self-regulated learning. By the late 1990s, some doubts had arisen regarding the measurement of self-regulated learning as an aptitude. The
21
main critique of these methods was that they are not accurate (Winne, 2010; Winne & Perry, 2000), do not capture the conceptual nature of self-regulated learning (Greene, Robertson, &
Costa, 2011), and rely on retrospective recall of events (Veenman, 2011).
Winne and Jamieson-Noel (2003) argued that students’ accounts of their use of study tactics may not be accurate. They asked students to self-report strategy use while partaking in a computer task that also directly measured whether that strategy occurred using trace data, such as making a note, highlighting text, or reviewing information. The results showed that, on average, the correlation between the self-reports and students’ actions was extremely low. Some students reported using strategies they did not actually use. Students could not determine accurately whether the they took a note, copied text to a note, or highlighted text. The students’ self-report measures and actual event measures correlations ranged from r = .0 to r = .44. For taking notes, the relationship was r = .72; for copying text to a note, r = .67; and for highlighting, r = .54. For some areas, self-reports on strategy use were incorrect, and at best they were inaccurate,
overreporting most strategies and underreporting note taking (Winne & Jamieson-Noel, 2003).
This finding should not be unexpected. Students with poor metacognitive skills are expected to have trouble being able to accurately monitor their own actions; this raises serious questions about the validity of self-report measures.
Furthermore, these measures gather information after the fact, having students make judgments about how often they think that an event has occurred. However, memory is not perfect, and distortion can occur when researcher ask students what skills they employed and they remember engaging in actions they did not actually perform or that they later have no memory of (Nisbett & Wilson, 1977). Again, students with poor metacognitive skills may simply not know how often they engage in a behavior or certain types of cognitive processes, as
22
they do not actively monitor their own cognition or behavior. However, even students with good metacognitive skills may report memories that are not accurate accounts of a past event
(Veenman, 2011).
Researchers have also raised questions as to whether a one-time measurement can accurately access a learners self-regulated learning aptitude (Winne & Perry, 2000), as aptitude measures could differ over domains, across tasks, and even within a learning task due to the dynamic nature of self-regulated learning processing (Winne, 2010). For instance, a learner with high prior knowledge on a certain time-limited task may engage in a lot of metacognitive
monitoring early in the task to review what prior knowledge they have about the task. Then they may not use much monitoring over the rest of the task, as their early use of monitoring would enable them to set up a detailed plan for the completion of the task, along with the strategies they already know from prior knowledge will be effective. However, if this student was in a situation where they had low prior knowledge, they may initially focus on a plan, then engage in more metacognition as they monitor if that plan is effective. Strategy use will vary far more as the learner adapts to how well they believe their strategy is working. In these two situations, the learner will show two different aptitudes for self-regulated learning.
Measuring Self-regulated as an Event with Think-Aloud Protocols.
To deal with problems that arose from measuring self-regulated learning as an attribute, some researchers conceptualized self-regulated learning as a series of events that occur while students work on a task (Azevedo & Cromley, 2003; Azevedo, Cromley, & Seibert, 2004;
Greene, Robertson, & Costa, 2011; Winne & Perry, 2000). Whereas several methods were created to do this, including eye tracking, behavioral traces, computer log files, and discussion turns (Azevedo, 2014), one method that has been used often with computer-based learning
23
environments is think-aloud protocols (Azevedo, Moos, Johnson, & Chauncey, 2010; Greene, Costa, Robertson, Pan, & Deekens, 2010; Schraw, 2010; Zimmerman, 2008). A think-aloud protocol is a method of gathering data that consists of having a learner complete a task while verbalizing what they are thinking at the time (Greene, Robertson, & Costa, 2011). In a review of event-based measures of self-regulated learning, Schraw (2010) found that think-aloud protocols were the only method that measured effort, plans, strategy use, and monitoring. The sole factor think-aloud protocols were not able to measure was pre-study factors (Schraw, 2010).
While various trace elements like hyperlink choice, eye tracking, and palette choices could be used to measure some of the same cognitive processes as think-aloud protocols, these alone cannot measure the same breath of cognitive and metacognitive processes that a think-aloud protocol can.
The think-aloud methodology has emerged from an information-processing framework (Ericsson & Simon, 1993, 1980). During a think-aloud protocol, researchers ask learners to verbalize their thoughts and actions as they work on a task. These verbalizations are the internal speech that occurs during problem solving (Vygotsky, 1986). It is important when using this method to only capture the verbalizations and not ask for explanations. Learners can describe their cognitive processes, as the process of describing them will not alter them. However, attempting to explain them will alter them and increase cognitive load. In a review of literature, Ericsson and Simon (1993) found no evidence that thinking aloud decreases performance, although it may increase the task duration. More recent studies have demonstrated that a learner’s strategy use and metacognition do not change in quantity during a think-aloud task (Bannert & Mengelkamp, 2008; Veenman et al., 2006)
24
Verbal analysis. Measuring self-regulated learning using a think-aloud protocol requires two things, a task and a measurement model (i.e., method protocol), for turning what the learners say into usable data. There are many different methods of analyzing verbal data, but the
methodology used most commonly to measure self-regulated learning with a think-aloud protocol is based on Chi’s (1997) methodology of verbal analysis. With traditional think-aloud protocol analysis, often there is an ideal model for solving a problem, and the goal is to test that model. For example, Ericsson and Simon (1993) were interested in learning how people played chess to create a logical model of chess play that would become the foundation for a chess AI system. With verbal analysis, Chi’s focus was more exploratory, in that she wanted to see what learners’ models for problem solving and conceptual change were. In protocol analysis, the focus is on the sequence of events, whereas in verbal analysis sequence does not matter as much, as all utterances, regardless of position, reflect the underlying process use that is of interest to the researchers. Using this shift in focus allows researchers to apply a mixture of qualitative
methodology and quantitative statistical analysis to think-aloud protocols, whereas the traditional method presented by Ericsson and Simon focused on only measuring differences between a learner completing a task and an ideal solution. An example would be what chess piece does a player move, compared to the best logical move (Ericsson & Simon, 1993).
Azevedo and colleagues (Azevedo et al., 2002; Azevedo & Cromley, 2004b; Greene &
Azevedo, 2009; Greene, Robertson, & Costa, 2011) have developed a method of using think- aloud data for analysis of self-regulated learning while performing a computer based learning enviroment task, which consists of four key parts: capturing think-aloud verbalizations during a learning task along with video data of their actions, transcribing the data from audio of a
participant’s speech into a text document, segmenting the transcripts into codable units, and
25
applying meaningful labels to segments, if possible. A sample task that is used often in this research is for students to use a digital encyclopedia to learn about the human heart while thinking aloud (Azevedo & Cromley, 2004b; Greene & Azevedo, 2007b; Greene, Costa, et al., 2010).
Capturing think-aloud protocol data and transcription. Capturing think-aloud protocol is relatively straightforward in tasks using computer based learning enviroment.
Learners engaging in a task are recorded, generally with both audio and video devices (Azevedo
& Cromley, 2004b; Greene, Costa, et al., 2010; Hofer, 2004). Other measures of recording, such as eye tracking, screen-capture software, computer logs, or galvanic skin response sensors, can be employed concurrently (Azevedo, 2014). Following the task, the audio is transcribed to aid in the rest of the data preparation.
Segmentation. Segmentation is the process of breaking apart transcriptions into coding chunks. While it is possible to code an entire transcription as a whole, it is generally more useful in self-regulated learning research to break it into smaller chunks (Chi, 1997; Greene, Robertson,
& Costa, 2011). These segments can be based on units of time, pauses in speaking, navigation points in the enviroment, or other various breaking points. The protocol that is most commonly used in self-regulated learning research is breaking the contents of the verbalization into codable units (Ericsson & Simon, 1993). Greene et al. (2011) defined the size of this unit as “segments that contain the fewest number of words while still being interpretable as an indicator of a cognitive process, even outside of context” (p. 328). An example segmented protocol can be found in Appendix A.
Coding the protocols. Once the data are segmented, they can be coded. Codes can be either emergent from the data or determined a priori (Chi, 1997). Researchers have used
26
Azevedo’s codebook as starting point for the study of self-regulated learning within a computer- based learning environment using think-aloud methods (see Appendix B; Azevedo et al., 2002;
Azevedo & Cromley, 2004a). This list contains 35 codes, each representing a cognitive,
metacognitive, or behavior process, and has been employed directly or employed with additions in numerous studies (Azevedo, 2005; Azevedo & Cromley, 2004b; Greene et al., 2015, 2014;
Greene & Azevedo, 2009; Greene, Costa, et al., 2010; Moos & Miller, 2015). An example of a transcript coding using this system is listed in Appendix A. This coding system was created with the intent to capture aspects of self-regulated learning using Pintrich’s (2000), Winne and
Hadwin’s (1998), and Zimmerman’s (2002) prior work in self-regulated learning. Codes were made to capture aspects of self-regulated learning within four broad areas: planning, monitoring, strategy use, and task difficulty and demands (Azevedo & Cromley, 2004b). The original coding system comprised four broad areas, with a fifth one regarding interest added later (Greene
& Azevedo, 2009), the codes themselves are from all aspects of self-regulated learning theory, including knowledge activation, goal creation, metacognition, self-questioning, study skills, knowledge elaborations, coordinating information sources, controlling the environment, time management, and evaluation content. Whereas the original codes form the core of this coding system, codes are added, removed, or refined based on the task and on previous findings. The codebook has expanded to as many as 50 in later studies (Greene et al., 2015), and in some studies (Greene et al., 2014) a second set of codes to examine epistemic cognition was added as well, which brought the code count to over 80.
The code book has been refined by researchers as they complete new studies. The largest changes to coding came from the addition of valence to some of the metacognitive monitoring processes (Azevedo, 2009). Before the addition of valence, feelings of knowledge, judgments of
27
learning, and content evaluations were coded the same whether they were positive or negative experiences. For instance, a segment where a learner stated they found their current learning content useful was coded the same as one where the learner did not find the content useful.
Likewise, learners stating that they understood something they just read would have been coded the same as if the learner stated they did not understand what they just read. Positive and negative events, however, can often lead to different events following their occurrence. For instance, a learner who feels they did not understand what they just read may re-read the section, whereas one who feels they understood the content may self-test, summarize what they read, or move on to a new topic. Therefore, it seems important to add valence to certain micro-level codes in the coding scheme (Greene & Azevedo, 2009). With judgment of learning it was found that learners frequently changed their strategy use following negative judgments of learning (Binbasaran Tuysuzoglu & Greene, 2014).
Data products. The final product of this measurement protocol is a list of counts for what self-regulated learning events occurred while the learner completed a task. Researchers refer to these as micro-level codes. These micro-level codes have several properties. First as count variables they can never be negative. Second, count variables are usually distributed with Poisson or negative binominal distributions. In a Poisson distribution the mean of the
distribution is equal to its variance. If the variance is higher than the mean, then the variable is considered over-dispersed and may be better modeled using a negative binominal distribution (Cohen, Cohen, West & Aiken, 2003). Second, due to a limited sampling window, learners who do not use a process can fall into two groups. The first are those who would never use a certain process at all. For instance, a student may never take notes when they complete a task. The second group are students who would use a strategy if the task was longer but instead either did
28
not have time to use the strategy or used a different strategy instead. This creates a zero-inflated distribution, where the number of subjects not using a self-regulated learning process may be artificially inflated (Long, 2001). Examining data from a think-aloud protocol analysis using self-regulated learning data, Greene and colleagues (2011) found that the negative binominal distribution was the best distribution to model the data. They also found that no further benefit from gained in using a zero-inflated version of the negative binominal distribution. Similar analyses are necessary whenever researchers analyze TAP data. For an example of micro-level codes and the corresponding macro-level codes, see Appendix B.
Generally, also presented are the macro-level codes. Macro-level codes are linear combinations that represent a theoretical higher order that these codes come from. To create the macro-level codes, one would simply add up the micro-level codes within that macro-level code (Greene et al., 2013).
The macro-level variables are useful for several reasons. The micro-levels can show exactly what processes students used to complete tasks, but sometimes the exact process is not as important as the macro-level processes used (Greene & Azevedo, 2009). Individual differences in how learners complete a task depend on prior knowledge and internal and external conditions.
Small changes in these conditions could lead to one student taking notes, whereas another student making a verbal summary. Both are examples of strategy use, and whereas the individual process may not be predictive of learning, the use of either of the processes may.
Analyses at the macro-level can account for idiosyncratic differences in micro-level processing that can arise across individuals (Greene et al., 2013).
There are other benefits of using these macro-level codes. Models of self-regulated learning tend to deal in these theoretical higher order ideas and not more specific processes (i.e.,
29
planning, monitoring, and strategy use rather than reviewing subgoals, judgments of learning, and elaboration), so analyzing macro-level self-regulated learning processing can allow for better understanding of how the overall self-regulated learning model works in practice (Greene et al, 2013). Finally, these higher ordered variables reduce the amount of information presented, providing not only a more manageable set of processes, but one that results in a model that is better suited to quantitative analyses. Quantitative analysis requires, in general, more subjects than predictors, and in some studies, that is not possible, due to the high resource demands of gathering data from participants (i.e., capturing, transcribing, and coding think-aloud protocol data; Greene et al., 2014). There is also the benefit of working with more normalized data.
Despite the individual micro-level processes often being best modeled with some kind of count distribution, the sum of these variables often produces a variable with a normal distribution (Greene & Azevedo, 2009).
Summary. When measuring self-regulated learning as an event, think-aloud protocols employing the Azevedo, Greene, Moos, and colleagues’ methods and codes allow researchers to capture the cognitive, metacognitive, and behavioral aspects of self-regulated learning as a learner works through a task. Through the process of recording, transcribing, segmenting, and coding the data, the data transform from open-ended verbalizations from the learner that occur naturally as they engage with a task to counts of how often a learner has enacted particular processes. These processes can be modeled as count data and used for quantitative analysis and building statistical models, either modeled at the micro-level or specific skills, or the macro or broader theoretical skill level. Then these processes can be used to answer the question of what processes are needed by 21st century learners. One further step is required to answer this broad
30
question however. That is what subset of these skills best predict learning. For this, statistical models are required.
Statistical Models for Self-Regulated Learning
When the coding is finished, what is left is a count of the self-regulated learning processes used by learners. Then the issue is how to determine which self-regulated learning processes are indicators of learning and which are not. With 35 self-regulated learning processes, the chances of finding a significant relationship between any one of these and the learning outcome becomes 83.39% due to a very high inflation of the Type I error rate that comes with doing multiple hypothesis tests (Bender & Lange, 2001). If one were to use the conservative Bonferroni adjustment to limit the probability of a false positive result, the
corrected p value at which to test hypotheses would become p < .001 (Shaffer & Saffer, 1995).
Normally, when faced with a high rate of a Type I error, one can increase the power with a larger sample (Cohen, 1992). Using G*Power 3.1 (Faul, Erdfelder & Land, 2009) to determine the number of subjects needed to find a small and medium effect size with a multiple regression design, 35 predictors and a p < .05 significant level with a 95% statistical power to find a true effect, 1906 participants would be needed to find a small effect size (adjusted R2 = .1), 277 participants for a medium (adjusted R2 = .3) effect size and 135 for a large (adjusted R2 = .5).
This would mean, to find a model with an adjusted R2 of over .3, a medium effect size, one should have 277 participants, or one risks getting back a false negative result where the independent variables were not found to have a significant relationship with the dependent variables, but a true relationship did exist.
Sample sizes of 1900 and even 300 are unheard of in self-regulated learning research using a think aloud protocol due to how time intense it is to gather data from participants. With
31
an estimate of seven hours per participant needed to transform the raw data into data that are suitable for quantitative analysis (Greene et al, 2013), high sample studies are prohibitively expensive to run. Lack of statistical power coupled with a high false-positive rate when doing multiple comparisons has led to researchers finding other ways to make sense of the patterns of processes found using protocol analysis.
In the early studies, researchers used multiple chi squares to study learning outcomes. In Azevedo and Cromley (2004), Azevedo, Cromley, and Seibert (Azevedo & Cromley, 2004), and Greene and Azevedo (2005), these comparisons were done without correcting for multiple comparisons. Azevedo, Gurhrie, and Seibert (2004) grouped processes comparing individual processes within the higher order category they comprise, such as planning, using a two by four chi square design. Then to examine differences between two groups regarding specific methods of planning use, the researchers broke planning back down into the four parts that comprised it;
creating multiple goal plans, creating sub-goals, activating prior knowledge, or recycling the goal of the task into working memory.
Much of the recent work into statistically analyzing think-aloud protocol data for self- regulated learning has employed ordinary least squares (OLS) regression models (Azevedo, Moos, et al., 2010; Greene et al., 2015; Greene & Azevedo, 2007b, 2009; Greene, Costa, et al., 2010; Moos & Miller, 2015). These studies involved a pre-test/post-test format to measure the relationship between self-regulatory learning processing and knowledge gain. Knowledge gain was defined as either the change in pre-test to post-test scores or the post-test score with the pre- test included as an independent variable. Due to a low ratio of subjects to variables, creating a model consisting of all micro-levels processes is not practical, either from an analysis standpoint
32
or a utility one. When there are more predictors than cases, standard OLS regression no longer works as intended, as no singular solution will be found (Freedman, 2009).
Due to problems with the number of indicators increasing to sizes nearly equal to that or greater than the sample size of a study, variable reduction methods are needed. Two methods have been used: one which creates linear combinations of the micro-level processes into a larger grain size, and one that attempts to reduce the variables into a two subset of variables. One of these subsets is positively associated with learning gains and the other is negatively associated with learning gains. In the rest of this section these methods will be discussed, including an overview of other OLS regression methods to provide an overview on the current state of how this protocol has been and can be analyzed. This examination will conclude with an overview of an exhaustive search method that will find the micro-level variables that best predict learning using all-subset regression.
Ordinary least squares regression. Before moving futher into this discussion, there are some aspect of OLS regression that are worth noting. First, OLS is considered a BLUE solution.
BLUE stands for best linear unbiased estimator. Best means that the equation for a regression
model with the lowest distance between the regression line, or plane with three variables and hyperplane with four or more, and the data points will always be Y = bX + e. Y is the dependent variable of interest. X is a matrix of cases by variables. Modifying X is b, which is the
regression coeffienct for X. A one-unit increase in X, with all other things held constant, results in a b increase in Y. The final term, e, is a is a vector of unknown error for each case. Using the Gauss-Markov theorem, it can be demonstrated that this produces the model with the least amount of unexplained variance (Freedman, 2009). For a complete discussion on the Guass- Markov theorum, consult Faraday (2014). The next term in BLUE is linear. OLS regression
33
produces a linear solution, or one that finds a hyperplane that reduces the distance between the value for y at point x for all data points. The third term is unbiased. This means the estimates the model are the same as the parameters in the population The degree to which the population value and the sample estimates vary is the degree of bias that a system has. OLS methods of regression are extremely useful, as when the assumptions of regression are met, these estimates are considered to be equal to the population values. If bias exists in a regression model, then that model’s results will differ from the true values of the population. The last term is estimator.
This term means that, like most statistics, regression results are estimates of population values (Faraway, 2014).
While no two sources are in full agreement on what the assumptions of OLS regression are (Williams, Grajales & Kurkiewicz, 2013), there several issues that can come up in analyses that can cause problems with interreptations that are generally agreed upon and these include:
proper specification, normality of residuals, independence of residuals, homoscedasticity of variance, lack of perfect multicollinearity and outliers and influential cases (Berry 1993; Cohen, Cohen, Cohen, & Aiken, 2003, Gelman & Hill 2007; Faraday 2014; Field 2013; Thompson 2005) Specification means that the model has the proper predictor variables included and the relationship is being the predictor variables and the dependent variable is modeled properly. For a linear model, one assumes the data actually are best described using linear methods
(Thompson, 2005). The second issue is that the residuals, or distance between the regression line and each data point, are normally distributed (Thompson, 2005). Next, is that the residuals are independent. In some situations the residuals can be become correlated, properly known as autocorrelation. This is an issue primarily in time series designs. The next is homoscedasticity of variance, which is that the residual scores have equal variance for all values of the predictor