Spray Reagents
P. E. Wall, Merck Ltd, Poole, Dorset, UK Copyright^ 2000 Academic Press
Introduction
The detection of chromatographic zones on a de-veloped thin-layer plate usually relies on the absorp-tion or emission of electromagnetic radiaabsorp-tion in the visible or ultraviolet range. Some compounds are visibly coloured, others absorb UV light or exhibit Suorescence when excited by UV or visible light, but most require visualization using an appropriate spraying or dipping reagent. Due to the inert nature of the adsorbents commonly used in thin-layer chromatography (TLC) layers, chemical reactions can be carried out in situ without destroying the adsorbent or binder characteristics. Many such detec-tion reagents exist for TLC, and lists of formuladetec-tions have been collated in a number of publications. Like a number of other features of the TLC procedure, this highlights the versatility and uniqueness of thin-layer chromatography compared with other chromato-graphic techniques. Often, quite aggressive reagents such as hydrochloric acid or sulfuric acid can be used to detect separated analytesin situ. Such reagents are included along with iodine vapour or nitric acid va-pour as universal reagents that can be used to visual-ize a wide range of compounds of different types. Some of these can be termed destructive reagents, particularly those involving charring. Some reagents are much more speciRc for groups of compounds such as alcohols, aldehydes, ketones, esters or acids. These are termed group-speciRc reagents. With regard to speciRcity, this is about the limit of what is possible as no genuine substance-speciRc reagents exist. When no irreversible chemical reaction is used for detection on the chromatographic layer, the form of visualization is termed non-destructive. Included in non-destruc-tive techniques are visible and UV light, and some-times the use of iodine or ammonia vapour. The latter two reagents are included as in many cases the ‘reac-tion’ is reversible.
Often, separated compounds can be detected and visualized by a combination of the above techniques. A non-destructive technique may be used initially, followed by a universal reagent, and then Rnally a group-speciRc reagent to enhance selectivity and sensitivity. Often, for a particular analyte there may be several visualization reagents available, but usu-ally there is a noticeable difference in sensitivity of detection between them. Also stability may play an
important part in the selection of a suitable detection reagent. Some reagents have good stability over a number of weeks, however, there are those that must be made up fresh and used almost immediately. The visualized chromatographic zones may also dif-fer in stability. Some may fade quite quickly, whilst others, although remaining stable, become more difR -cult to visualize as the background darkens or is affected in some other way by the reagent. Fortunate-ly, the majority of reagents do give acceptably stable results. Sometimes dark or coloured backgrounds can be lightened by exposure of the chromatographic layer to acidic or alkaline vapours. However, all these effects will need to be taken into consideration so that the most effective visualization procedure is used.
After visualization, further analysis can be per-formed by in situ spectrodensitometric scanning in the absorbance, Suorescence quenching, or S uores-cence modes, in addition to removing some or all of the separated chromatographic zone for further analysis by infrared (IR), Raman, nuclear magnetic resonance (NMR), mass spectrometry (MS) or radio-graphy. Using these hyphenated techniques, more useful analytical data can be obtained. In fact, the stability of the layers and the detected chromophores often allow useful data to be collected even if the TLC plate had been developed some days or weeks previously.
Non-destructive Methods
Visible Spectrum
Some compounds are sufRciently coloured, for example natural and synthetic dyes, and nitro-phenols, to give an absorption in the visible part of the electromagnetic spectrum. However, it is the re-maining part of the visible radiation that is reSected and is seen by either the naked eye or light-detecting equipment. Prechromatographic derivatization can often be used to improve resolution of the analytes of interest, but also make them visible to the naked eye. One example of this is the formation of yellow dinitrophenylhydrazones of ascorbic acid and its homologues.
Ultraviolet Spectrum
UV-sensitive detectors, e.g. photomultipliers. Often exposure to UV light at short-wave radiation (254 nm) or long-wave radiation (366 nm) is all that is necessary for absorbing orSuorescing substances to be observed. Most manufacturers’ UV lamps and cabinets function at either or both of these wavelengths.
To aid absorbance, many commercial pre-coated TLC layers contain an inorganic phosphorescent indi-cator or an organic Suorescent indicator. Inorganic indicators used include uranyl acetate (yellow}green), manganese zinc silicate, zinc cadmium sulRde, zinc silicate (green) and tin strontium phosphate (blue). Nearly all silica gel pre-coated plates and sheets con-tain this type of indicator. Most indicators exhibit a bright green, yellow or blue phosphorescence when excited by UV light at 254 or 366 nm.
Detection by absorbance in these cases relies on the phosphorescence being quenched by the sample com-ponents. This process is known as Suorescence quenching because the phosphorescence is very short lived. Hence, the effect is best observed by continual exposure to UV light. In most cases, pink or violet spots/bands are observed for quenching on the green phosphorescent background, whereas grey}black spots/bands are usually seen on the blue background. In most applications, the inorganic indicators are quite stable with little or no elution from developing solvents, and remain unaffected by most dyeing re-agents and the temperatures used to effect reactions. Organic Suorescent indictors can also be used. Most of theseSuoresce in long-wavelength UV light (366 nm) and are coded F366or UV366by the
manufac-turer. Most cellulose pre-coated layers contain this type of indicator. Substances used include optical brighteners, hydroxypyrene sulfonates, Suorescein and rhodamine dyes. Some pre-coated plates are manufactured with both types of indicator present to give possible quenching by sample components at both wavelengths.
The process ofSuorescence quenching is caused by the electromagnetic radiation providing the energy to bring about an electronic transition from the ground state to an excited singlet state. As the excited elec-trons return to the ground state, they emit the energy at a longer wavelength, usually in the visible range. Phophorescence quenching is slightly different. Rather than returning directly to the ground state, the electrons enter an excited triplet state and then return from there to the ground state. As before, the energy is emitted at a longer wavelength. However, as the decay is longer the process is better described as phophorescence rather thanSuorescence.
Many analytes, however, either absorb insufR cient-ly or not at all by these techniques. In these instances suitable detection reagents are used to give coloured
spots/bandsin situ. If these are reversible reactions, then they can still be termed non-destructive tech-niques.
Reversible Reactions
Iodine Vapour
Iodine is a very useful universal reagent, but it should never be overlooked that some reactions with iodine are non-reversible (discussed later in Non-reversible Reactions). The use of iodine as vapour enables the detection of separated substances rapidly and eco-nomically beforeRnal characterization with a group-speciRc reagent. Where lipophilic zones are present on a silica gel layer, the iodine molecules will concen-trate in the substance zones giving brown chromato-graphic zones on a yellow background.
Preparation of the reagent simply involves putting a few iodine crystals in a dry chromatography cham-ber, replacing the lid and allowing the iodine vapour to Rll the tank for a few hours. The developed chromatogram is then introduced into the chamber and as soon as the chromatographic zones are recog-nized, the layer is removed and the results docu-mented. The adsorbed iodine can then be allowed to evaporate from the surface of the layer in a fume cupboard. The chromatogram can then be subjected to further reactions. If more permanent results of the iodine impregnation are required, then the chrom-atographic zones can be sprayed or dipped in a starch solution (0.5}1%) to give blue starch}iodine inclusion compounds.
Iodine detection works well on silica gel 60 and aluminium oxide layers. However, results are usually poor on reversed-phase layers as the lipophilicity of the layer does not differ appreciably from the sub-stance zones.
Iodine vapour reversible reactions occur with a wide range of organic lipophilic molecules, e.g. hy-drocarbons, fats, waxes, some fatty acids and esters, steroids, antioxidants, detergents, emulsiRers, anti-biotics and many miscellaneous pharmaceuticals.
Ammonia Vapour
elegantly by pouring ammonia solution into one com-partment of a twin trough developing tank and plac-ing the TLC plate in the dry compartment. With the lid in place the TLC plate is exposed to an almost even concentration of vapour. The process is revers-ible with time as the ammonia soon evaporates from the adsorbent surface.
Non-reversible Reactions
Destructive Techniques
Most post-chromatographic chemical reactions on the layer could be described as ‘destructive’ in that a chemical reaction has taken place and visualized compounds are no longer those that were applied as the sample. However, in order that a clear distinction can be seen between a truly destructive technique and a chemical derivatization or other chemical reaction, the destructive techniques described here will be lim-ited to charring and thermal activation.
Charring techniques Charring usually involves treatment of the developed chromatogram with sul-furic acid and then heating at temperatures of 100}1803C for 5}20 min. The reaction is fairly non-speciRc, detecting most substances that are organic in nature as carbon deposits. Hence, sulfuric acid can also be termed a ‘universal reagent’. Some-timesSuorescent chromatographic zones are produc-ed at temperatures below 1203C, but their intensities are very dependent on the time of heating. Most charring occurs at higher temperatures, typically 150}1803C.
Although sulfuric acid charring is a relatively easy technique, there are limitations. Overheating of manufactured pre-coated layers results in the whole layer turning grey or even black. The problem is that commercial binders in pre-coated layers will also char under extreme heat in the presence of sulfuric acid. Most sulfuric acid reagents for dipping and spraying commercial TLC plates consist of a 10}20% v/v solution in water/methanol. Charring reactions will also occur sometimes with other acids, e.g. phos-phoric acid. In conjunction with copper acetate, lipids can be detected by charring at 1803C.
A further point to bear in mind is the care that needs to be taken if charring techniques are used in conjunction with reversed-phase silica gel layers. Due to the carbon loading, excessive heating will cause a dark or even black background to appear.
Thermal activation techniques It has been observed that heating some substances to high temperatures on certain chromatographic adsorbents results in
chromatographic zones that are Suorescent under exposure to UV light. This process is known as thermochemical activation. The moderately polar stationary phase, a NH2-bonded silica gel layer, gives
the best results for this type of detection.
It has been postulated that under the catalytic inSuence of the surface of the silica gel bonded layer, functional groups are eliminated and aromatic ring systems develop, which are excited by long wavelength UV light at 366 nm. In general, com-pounds with heteroatoms (nitrogen, oxygen, sulfur and phosphorus) more readily undergo this reaction than pure hydrocarbons. Under the inSuence of the catalytic adsorbent surface, substances rich in -elec-trons are formed that conjugate to produce products that are Suorescent when appropriately excited. Changes in pH can alter the excitation and S uor-escing wavelengths.
The derivatives formed remain stable for weeks, and theSuorescence can frequently be intensiRed and stabilized by dipping the chromatogram in organic solvent solutions of Triton X100, liquid parafRn and polyethylene glycol. If the NH2-bonded layer
con-tains aSuorescent indicator (F254), then often
appreci-ableSuorescence quenching can occur under UV light at 254 nm. Sometimes compounds that only weakly Suoresce can exhibit strong Suorescent absorption (e.g. vanillic acid and homovanillic acid). Thermal activation works well for the detection of catechol-amines, fruit acids and some carbohydrates.
Chemical Reactions on the Layer
Most chemical reactions on the planar chromato-graphic layer are carried out after development of the chromatogram. This is described as post-chromato-graphic visualization and is particularly useful when the presence of ‘unknowns’ in the sample need to be detected. However, it is also possible, as will be shown later, to carry out a pre-chromatographic de-rivatization before chromatographic development and this can have signiRcant advantages. As post-chromatographic visualization is the major method of detection, it is this technique that will be given con-siderationRrst.
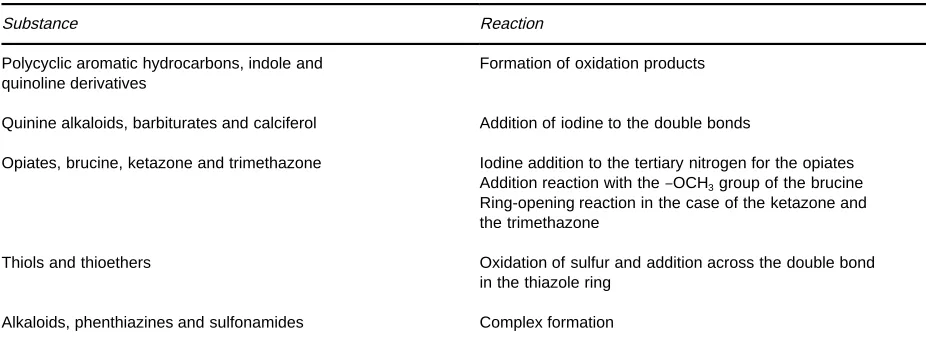
Table 1 Examples of iodine reactions on the TLC layer with a common range of organic substances
Substance Reaction
Polycyclic aromatic hydrocarbons, indole and quinoline derivatives
Formation of oxidation products
Quinine alkaloids, barbiturates and calciferol Addition of iodine to the double bonds
Opiates, brucine, ketazone and trimethazone Iodine addition to the tertiary nitrogen for the opiates
Addition reaction with the}OCH3group of the brucine
Ring-opening reaction in the case of the ketazone and the trimethazone
Thiols and thioethers Oxidation of sulfur and addition across the double bond
in the thiazole ring
Alkaloids, phenthiazines and sulfonamides Complex formation
The most used and dependable reagents are dis-cussed in detail below, however, this represents only a small fraction of the detection reagents available, and the literature should be consulted for a more comprehensive review. In choosing the best detection reagent, the following points should be borne in mind:
1. Sensitivity of detection.
2. Selectivity of the reagent for the analytes of inter-est.
3. Background effects, particularly where plates are to be scanned spectrophotometrically.
4. Stability of detection reagent.
5. Stability of the chromatogram after chemical or thermal treatment.
6. Ease of preparation of the spraying or dipping reagent.
7. Hazards associated with the use of particular de-tection reagent.
Universal chemical reagents
Iodine vapour/solution Iodine reacts chemically with unsaturated compounds, which is rarely revers-ible on silica gel layers. Also irreversrevers-ible oxidations, electrophilic substitutions, addition reactions, and the formation of charged transfer complexes have been observed. The so-called ‘iodine reaction’ is possibly an oxidation with the initial formation of a radical cation as shown in the following reaction equation:
R:#1
2I2PR# #I\
A number of possible reaction pathways can then occur. Table 1 lists some of the common reactions
that take place on the chromatographic layer with iodine. Iodine also possessesSuorescence quenching properties, hence, chromatographic zones that con-tain iodine will appear as dark zones on a silica gel layer containing aSuorescent indicator when viewed under UV light at 254 nm.
In the case of both reversible and non-reversible reactions with iodine vapour, the chromatographic zones can be ‘Rxed’ by further treatment with a 0.5}1.0% aqueous starch solution. The well-known deep blue iodine}starch complex is formed, which has good stability. As the reaction is very sensitive it is important to make sure that little iodine remains in the background, otherwise the whole background will be coloured blue!
The detection limits are usually a few micrograms of substance per chromatographic zone, but there are some cases where the detection is lower still (e.g. 200 ng glucose). Iodine may also be applied as a solu-tion and is usually prepared in an organic solvent, such as petroleum spirit, acetone, methanol, chloro-form or diethyl ether. A suitable dipping solution would be 250 mg iodine in 100 mL petroleum spirit. Such solutions have the advantage that, in some cases, the iodine is enriched to a greater extent in the chromatographic zones when dissolved in a lipophilic environment than a hydrophobic one. Hence, the sensitivity can be improved.
Ammonia vapour Ammonia vapour has a number of uses in chromatographic zone detection:
2. There are a number of instances where residual chemical detection reagent gives a background colour. Often exposure to ammonia vapour has the apparent effect of bleaching it from the layer. (An example of this is in the use of molybdophos-phoric acid reagent, where the background yellow colour is removed.) This effect increases sensitivity of detection.
3. Stabilization of some reactions on the layer is also possible with ammonia vapour. An instance of this is the blue colour of tryptamine after reaction with Gibb’s reagent.
Nitric acid vapour Most aromatic compounds can be nitrated with the fumes from fuming nitric acid. The reaction works best if the developed chrom-atogram is heated to about 1603C for 10 min and introduced whilst still hot into a chamber containing the nitric acid vapour. Generally the chromato-graphic zones are rendered yellow or brown in col-our. They also absorb in UV light at 270 nm. Some substances such as sugars, xanthine derivatives, tes-tosterone and ephedrine Suoresce yellow or blue when excited by long wavelength UV light after such treatment.
Group speciVc reagents Many reagents give speciRc reactions with certain organic chemical groups and are called group-speciRc reagents. In most cases, the reaction mechanism is clearly understood. As a gen-eral rule these reagents are very sensitive. It is these reagents that make up the major part of the detection reagent lists that are readily available in a large num-ber of TLC publications. The relative merits of a few of the major group-speciRc reagents are discussed below.
Oxidation/reduction reactions Often the most fre-quently used visualization techniques, oxidation/ re-duction reactions are group-speciRc depending on the particular reagent used. Some examples of oxidation reactions used in TLC are as follows: Emerson re-agent (4-aminoantipyrine}potassium hexacyanofer-rate [III]) for detection of arylamines and phenols; phosphomolybdic acid reagent for lipids and some sterioids; chlorine}o-toluidine reagent for vitamin B1,
B2, B6and triazines; chloramine T reagent for steroids
and purine derivatives; and chlorine}potassium iodide}starch reagent for amino, imino and amido groups, and triazine herbicides. Examples of reduc-tion reacreduc-tions include: tin(II) chloride} 4-dimethyl-aminobenzaldehyde reagent for the detection of aromatic nitrophenols; blue tetrazolium reagent for corticosteroids, Tillman’s reagent (2,6-dichloro-phenolindophenol) for organic acids including
vit-amin C; and silver nitrate}sodium hydroxide reagent for reducing sugars and sugar alcohols.
Hydrazone formation The reagent mainly em-ployed for hydrazone formation is 2,4-dinitrophenyl-hydrazine in acidic solution, which provides a speciRc reagent for carbonyl compounds (aldehydes, ketones and carbohydrates). Yellow or orange}yellow hy-drazones, or osazones in the case of carbohydrates, are formed on the chromatogram. Ascorbic acid and dehydroascorbic acid also respond to this reagent. The sensitivity limit is of the order of 10 ng per chromatographic zone.
Dansylation Dansyl chloride and other derivatives are used to produceSuorescent dansyl derivatives of amino acids, primary and secondary amines, fatty acids and phenols. The dansylation of fatty acids is indirect as the acid amides must be formedRrst. This conversion is readily achieved with the reagent di-cyclohexylcarbodiimide. In the next step, dansyl cadaverine or dansyl piperidine is used to formS uor-escent derivatives of the amides. The detection limit is 1}2 ng fatty acids.
Diazotization Azo dyes are strongly coloured and can be produced on the TLC layer by reduction to primary aryl amines, diazotization and coupling with phenols. Conversely, phenols can be detected by reac-tion with sulfanilic acid in the presence of sodium nitrite (Pauly’s reagent). The coloured zones formed by such reactions are often stable for a period of months.
A few named reagents exist that rely upon a diazotization reaction to detect speciRc groups of compounds. Two well-known ones are the Brat-ton}Marshall reagent and Pauly’s reagent. The Brat-ton}Marshall reagent consists of two spray solutions: theRrst, is sodium nitrite in acid to effect the diazotiz-ation; and the second is a mainly ethanolic solution of N-(1-naphthyl)ethylenediamine dihydrochloride. This reagent is used speciRcally to visualize primary aromatic amines, sulfonamides and urea, and carba-mate herbicides. Pauly’s reagent is used to visualize phenols, amines, some carboxylic acids and imidazole derivatives.
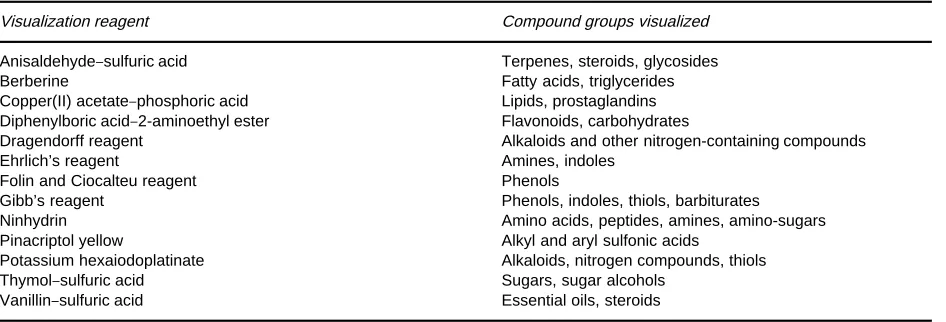
Table 2 Popular visualization reagents for TLC
Visualization reagent Compound groups visualized
Anisaldehyde}sulfuric acid Terpenes, steroids, glycosides
Berberine Fatty acids, triglycerides
Copper(II) acetate}phosphoric acid Lipids, prostaglandins
Diphenylboric acid}2-aminoethyl ester Flavonoids, carbohydrates
Dragendorff reagent Alkaloids and other nitrogen-containing compounds
Ehrlich’s reagent Amines, indoles
Folin and Ciocalteu reagent Phenols
Gibb’s reagent Phenols, indoles, thiols, barbiturates
Ninhydrin Amino acids, peptides, amines, amino-sugars
Pinacriptol yellow Alkyl and aryl sulfonic acids
Potassium hexaiodoplatinate Alkaloids, nitrogen compounds, thiols
Thymol}sulfuric acid Sugars, sugar alcohols
Vanillin}sulfuric acid Essential oils, steroids
for compounds that contain oxygen and nitrogen. Examples of this type of chemistry are the biuret reaction with proteins (resulting in the formation of a reddish-violet complex) and the reaction of the Cu2#ion with aromatic ethanolamines (to form
blue-coloured chelates). In addition there is the formation of reddish-violet colours of phenolic compounds with the Fe3#ion.
Schiff’s base reaction The Schiff’s base reaction is a group-speciRc reaction for aldehydes. The reaction usually occurs under basic conditions with aromatic amines to form a Schiff’s base. Aniline is normally used to form a coloured anil or Schiff’s base with an aldehyde. Carbohydrates can be visualized with 4-aminobenzoic acid with the formation of col-oured andSuorescent Schiff’s bases. A similar reac-tion mechanism occurs with 2-aminobiphenyl for aldehyde detection. One of the most sensitive reagents for reducing sugar visualization, the aniline phthalate reagent, is also a Schiff’s base reaction. The limit of sensitivity is 10g per chromatographic zone.
Other reactions There are a number of less well-used reactions such as halogenation with bromine or chlorine vapour, esteriRcation of alcohols, hydrolysis reactions, and the formation of charge transfer com-plexes. Many other popular reagents do notRt into the above categories, yet they do constitute a major part of visualization reagent lists. For some of these, the reaction mechanism has not been fully elucidated. Table 2lists a selection of visualization reagents to-gether with the classes of compounds visualized.
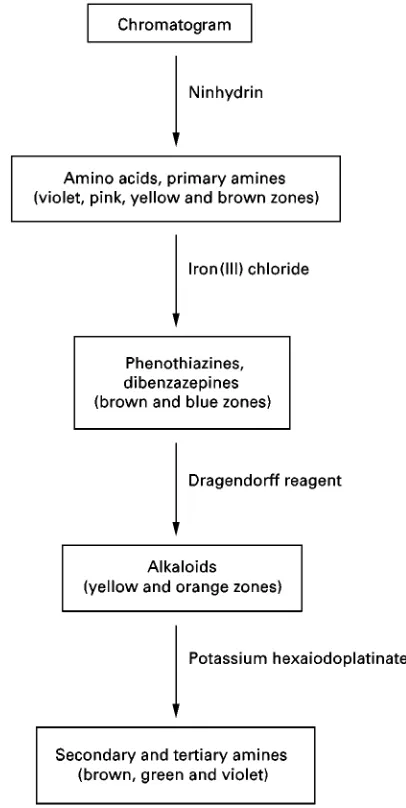
Sequencing reactions If it is known that particular functional groups may be present in the separated chromatographic zones, then reactions can be
ex-ploited more speciRcally, not necessarily to give direct identiRcation, but to increase the evidence of the presence or absence of particular analytes. Here, speciRc reagent sequences can be used to give a wealth of evidence visually. Sequencing reactions are particularly useful where a number of differing functional group compounds are present on a chrom-atogram. An example illustrating the use of four well-known detection reagents is shown inFigure 1. Where excess of one reagent has been used that may then interfere with the next reagent in the se-quence, washing or ‘destaining’ steps will be neces-sary. Rinsing troughs in the form of dipping chambers can be used. Such sequential reactions are always carried out either to prepare a substance for a colour reaction that will follow later or to increase the amount of information that is obtained by exploiting a combination of different independent reactions. Therefore, information is provided that could not be obtained using a single reagent step.
Figure 1 A typical visualization sequence for a TLC chromato-gram. The sequence enables the identification of a number of different groups of nitrogen function organic compounds.
An example of such an analytical procedure is the determination of vitamin C in fruit juices. Although it is possible to apply the fruit juices directly to the TLC/HPTLC layer, develop the plate in a suitable solvent mixture, and then use a detection reagent to locate the vitamin C, a more precise and better resolu-tion of the vitamin C can be achieved by derivatizing the sample Rrst with 2,4-dinitrophenylhydrazine to form hydrazones with the keto groups ('C"O) present. The sample applied to the plate is then ob-servable by its yellow colour. Using an appropriate solvent mixture for development, the yellow chromatographic zones can be visually observed as they separate and become resolved from each other. An even more elegant and simple way to achieve prechromatographic derivatization is to carry out the reaction on the layer. At the point where the sample is
to be applied on the chromatographic layer, the de-rivatization reagents can also be applied. Either the sample can be applied to the layerRrst, followed by the derivatization reagent shortly afterwards, or it can be done in the reverse order. The advantage of applying the derivatization reagentRrst is that a com-plete track across the width of the adsorbent layer can be applied, resulting in complete reaction with the sample when it is dosed, usually as bands, on top of the derivatization reagent. After appropriate drying and reaction time, development of the chromatogram can proceed using a solvent mixture that takes into consideration the polarity of the newly formed compounds.
It is also possible to carry out such ‘functional chromatography’ within the framework of 2-dimen-sional separations. TheRrst ascending development is carried out in the usual way with underivatized sample. Before the second development, the separ-ation track is subjected to treatment with a detection reagent speciRc to the functional group present in the substances (e.g. acids can be esteriRed, alcohols can be oxidized to ketones or aldehydes, carbonyls can be reduced to alcohols, carbonyls can form hydrazones or semicarbazones). The second development then follows in the usual way at 903to the Rrst.
Spraying Versus Dipping
Reagents can be applied to TLC/HPTLC plates either by dipping or spraying. The advantages and disad-vantages of these approaches are considered below.
Spray Devices
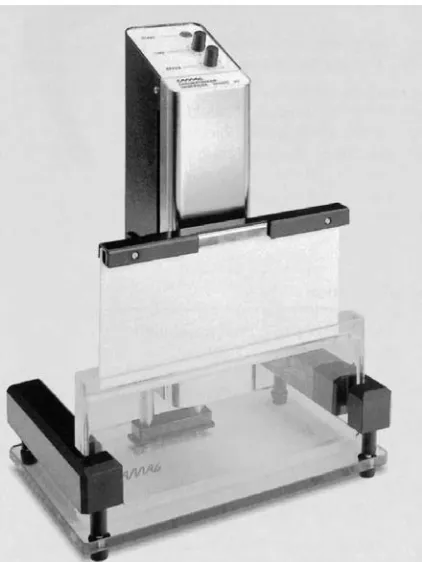
Figure 2 (See Colour Plate 33) An electropneumatically operated spray system for TLC. (Reproduced with the permission of Merck Ltd., UK.)
capillary (0.8 mm) is designed for spraying alcoholic or other low-viscosity solutions, whereas the larger dia-meter capillary (1.25 mm) is used for more viscous reagents like sulfuric acid. It can, of course, also be used to spray low viscosity reagents at higher rates.
Immersion Devices
In the last few years, dipping or immersion devices for TLC and HPTLC plates have been gaining in popu-larity. There are obviously beneRts with regards to the handling of harmful, irritant or toxic chemicals, but also the uptake of reagent on to the chromato-graphic layer can be better controlled by immersion. Chambers for immersion devices need to be as narrow as possible to limit the amount of reagent required, but not so narrow that the chromatographic layer is damaged by contact with the vessel. Manual dipping can be employed, but it is important that the chromatogram is fully dipped and the motion of dip-ping is done in one constant motion, otherwise ‘tide’ or ‘contour’-like marks will appear on the layer. These will usually interfere with any further spectro-densitometric evaluation.
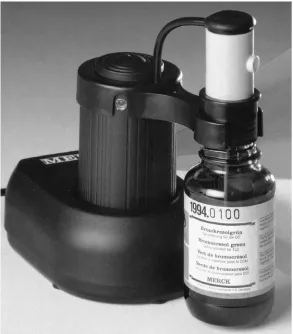
For good reproducibility and reliable constant up-take of reagent into the chromatographic layer, auto-mated immersion devices are essential (an example is shown inFigure 3). These allow precise control of the time of immersion and the rate of dipping, which is essential for good reproducible results.
Future Prospects
The last decade has seen a move away from the use of spray reagents to immersion devices. This trend will inevitably continue as the hazards associated with the spraying of chemical reagents, many of which contain harmful substances, can be avoided by dipping. The greater control over the visualization process that dipping affords is also something that will be encour-aged as the whole TLC technique becomes more standardized. Although many chemical reagents are already available, it is likely that new group-speciRc reagents will be discovered, often replacing those that contain toxic chemicals.
Figure 3 A commercial immersion device for automatic dipping of TLC chromatograms in visualization reagents. (Reproduced with the permission of CAMAG, Switzerland.)
limited number of protocols are presently available. The visualization of the many different types of com-pounds present in herbal products may well drive the research required.
Pre-derivatization of sample on the TLC plate is proving to be a technique that often results in excel-lent resolution of analytes of interest. It is to be expected that further protocols will be developed in this area on the basis of reaction sequences that may already be available.
Tables showing the detection of compounds on TLC plates following chromatographic development can be found in appendix 17 on page 4801.
See Colour Plate 33.
See also: II/Chromatography: Liquid: Derivatization. Chromatography: Thin-Layer (Planar): Densitometry and Image Analysis; Instrumentation; Mass Spectrometry. III/Thin-Layer Chromatography-Vibration Spectro-scopy. Appendix 2/Thin-Layer (Planar) Chromato-graphy: Detection.
Further Reading
Jork H, Funk W, Fischer W and Wimmer H (1989, 1994) Thin-layer Chromatography, Reagents and Detection Methods, vols 1a and 1b. Weinheim: VCH.
Stahl E (ed.) (1969)Thin-layer Chromatography:A Lab-oratory Handbook, 2nd edn. Berlin: Springer-Verlag. Stahl E (ed.) (1973)Drug Analysis by Chromatography and
Microscopy. Michigan: Ann Arbor Science.
Touchstone JC (1992)Practice in Thin Layer Chromatog-raphy, 3rd edn. New York: Wiley-Interscience. Wager H and Bladt S (1996)Plant Drug Analysis:A Thin
Layer Chromatography Atlas, 2nd edn. Berlin: Springer-Verlag.
Theory of Thin-Layer (Planar) Chromatography
A.Siouffi, Faculte& des Sciences de St-Je&roLme, Marseille, France
G.Guiochon, University of Tennessee, Knoxville, TN, USA
Copyright^ 2000 Academic Press
Introduction
Thin-layer chromatography (TLC) is a simple tech-nique, many runs can be performed at the same time on a single plate, no detection problems occur pro-vided a suitable reagent is used and moreover all solutes are detected. The main drawback is that a good detecting device designed for quantitative work is as expensive as a complete HPLC apparatus. The observed decline of TLC is mainly due to the belief that efRciency is poor. To perpetuate that idea,
qualitative data are obtained when no care is taken to carry out experiments! The advent of nanoplates coated withRne particles has given a renewed interest in the technique as excellent separations have been reported. By analogy to HPLC (high performance liquid chromatography) the acronym HPTLC (high performance thin-layer chromatography) appeared in the literature. Unfortunately different claims of per-formance have been published and some misunder-standing between pro and anti HPTLC camps have arisen, leading to fruitless discussions.