Brain Tumor Segmentation using SLIC Superpixels and
Optimized Thresholding Algorithm
Prince Ebenezer Adjei
Department of Computer EngineeringKwame Nkrumah University of Science and Technology
Henry Nunoo-Mensah
Department of Computer EngineeringKwame Nkrumah University of Science and Technology
Richard Junior Amedzrovi Agbesi
Department of Computer EngineeringKwame Nkrumah University of Science and Technology
Joyce Raissa Yaho Ndjanzoue
Department of Computer EngineeringKwame Nkrumah University of Science and Technology
ABSTRACT
This paper deals with the implementation of a simple algorithm for automatic brain tumor segmentation. Brain tumor is commonly di-agnosed by Computer tomography and Magnetic Resonance Imag-ing in clinical treatment. The paper uses Simple Linear Iterative Clustering (SLIC) to segment brain images according to their spa-tial and color proximities. The ratio of the mean and variance of the image pixels are determined in order to obtain an optimum thresh-old value. Region merging after threshthresh-olding was carried out. The final output image was an image with tumor sections circled out. The segmentation adheres to boundaries and the procedure is fast and reproducible.
Keywords
SLIC, brain tumour, region merging, image thresholding
1. INTRODUCTION
A tumor is a mass of tissue that is formed by an accumulation of abnormal cells. The term tumor’ is used in a generic sense in this work, as the nomenclature for tumors is vast. Brain tumors are typically classified by their morphology [1]. Tumors in the brain manifest themselves as irregular shapes that are detectable on brain scans as illustrated by Figure 1. To aid in diagnosis and treatment of these tumors, imaging techniques (i.e., Computer To-mography (CT) and Magnetic Resonance Imaging (MRI)) are em-ployed to confirm intracranial abnormalities and recommend fur-ther investigation, characterize the tumor and determine the grade, and finally for follow-up sessions to monitor effect of treatment. Brain tumors are characterized by headaches that do not respond to usual headache remedies, seizures, difficulties in speech, abnor-malities in vision, problems with memory, balance and others. Gen-erally, brain tumors are considered dangerous. [1] Limited access to resources, especially in rural settings coupled with high cost of accessing healthcare may lead to delayed diagnoses and hence a bad prognosis for patients with brain tumors. Again, this means that the few specialized medical practitioners in large hospitals are prone to tiredness and fatigue, resulting from increased pressure on scanty resources. This increases the risk of wrong diagnosis about the presence and extent of potential tumors in the manual
analysis of brain scans. Treatment of brain tumors rely heavily on its identification, characterization, classification and grading. Tu-mors can be treated well without any adverse effect on the body in its early stages. Without accurate identification and diagnosis, treatment becomes a problem. An automated extraction of poten-tial tumors from brain scans is thus desirable and plausible. Much research and implementation have gone into tumor segmentation using the general image segmentation techniques which include K-means clustering [2], [3], Fuzzy C K-means clustering and watershed methods [4] [5] and artificial neural networks and machine learn-ing techniques [6, 7]. Other techniques like histogram based meth-ods [8] and region based methmeth-ods (region splitting, growing and merging) [9] have also been exploited. These methods are hindered by the lack of adherence to boundaries, compactness and flexibil-ity. Generally, segmentation algorithms are plagued with the chal-lenge of lack of adherence to boundaries, and this is known to be a cause of failure for most automated and semi-automated image classification systems [10]. Tumors naturally, have irregular shape and can be spatially located anywhere in the brain, which makes it a challenging task to segment them accurately enough for clin-ical purposes. In recent times, research has shown much success with super-pixels after its introduction in [11]. Superpixels is a pro-gression of image blocks comprising of pixels with comparative components like color, texture, brightness, etc. Simple Linear Itera-tive Clustering compared to the other existing super-pixel models is considered the best [12]. Soltaninejadet al. proposed an automated brain tumor detection and segmentation using superpixel-based ex-tremely randomized trees in FLAIR MRI. A number of novel image features including intensity based, Gabor textons, fractal analysis and curvatures are calculated from each superpixel within the en-tire brain area in FLAIR MRI to ensure a robust classification [15]. In this paper, a simple SLIC based algorithm that uses threshold-ing and region mergthreshold-ing to segment brain tumor images is proposed. The output image circles the tumor section and the image is com-pact and adheres to boundaries.
2. PROPOSED METHODOLOGY
complicated. Figure 2 outlines the proposed approach for segment-ing 2D tumor MRI scan images, and exploits the superior segmen-tation qualities of SLIC.
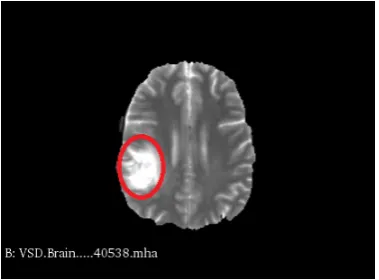
Fig. 1: MRI Brain Scan showing brain tumor.
[image:2.595.109.238.368.580.2]A simple yet effective technique of optimizing the selection of threshold value for thresholding is introduced. The technique is quite different from the conventional Otsu thresholding approach.
Fig. 2: General outline for proposed approach.
2.1 Conversion of Images from 3D to 2D
Images obtained from the BRATS clinical dataset were 3D images. The first preprocessing step was the conversion of these 3D images to 2D images using 3D slicer. Segmentation was done on the 2D images using MATLAB.
2.1.1 Description of BRATS. The BRATS 2013 and 2015 anno-tated clinical training dataset consist of a multi contrast brain tu-mor MR scans. The ground truths of the brain tutu-mor images are provided by a trained human expert. [18, 19] For each patient data, T1,T2,F LAIRand Ground truths MR images are available. All of the images used to evaluate the work are obtained from T1c MRI protocol.
2.1.2 Description of 3D Slicer. 3D slicer is a software platform for the analysis (including registration and interactive segmenta-tion) and visualization (including volume rendering) of medical images for research in image guided therapy. The interactive vi-sualization capabilities of 3D slicer include the ability to display arbitrarily oriented image slices, build surface models from image labels, and hardware accelerated volume rendering. Slicer’s capa-bilities include;
—Handling DICOM images and reading or writing a variety of other formats
—Manual editing
—Fusion and co-registering of data using rigid and non-rigid algo-rithms
—Automatic image segmentation
—Tracking of devices for image-guided procedures
2.2 Simple Linear Iterative Clustering (SLIC)
Simple Linear Iterative Clustering was proposed by [12]. It is an adaptation of K means for the creation of supixels. SLIC per-forms a local clustering of pixels in the 5-D space defined by the L, A, B values of CIELAB color space and thex−ypixel coordi-nates. It is a gradient ascent based technique considered faster than any existing method [12].
Super-pixels are grouped according to spatial and color proximi-ties of the pixels. An advantage of the SLIC technique is its good boundary adherence, which results in an improved performance of a segmentation algorithm.
Equations (1) - (4) summarizes the SLIC algorithm
dc=
q
(Lj−Li)2+ (ai−aj)2+ (bi−bj)2 (1)
ds=
q
(yj−yi)2+ (xj−xi)2 (2)
S=
r N
k (3)
D=dc+ds
Sm (4)
Wheredsis the spatial proximity,xandyrepresents the pixel posi-tion,Nis the number of pixels andkis the number of superpixels. Ddecides the closest center for every pixel,dcis the color proxim-ity andmallows us to weigh the relative importance between color similarity and spatial proximity.
Algorithm 1:Pseudocode for SLIC FnFunctionend
(/* Pseudocode for SLIC */)SLIC() Initialize cluster centersCk= [lk,ak,bk,xk,yk]Tby sampling pixels at regular grid stepsS;
Perturb cluster centers in ann∗nneighborhood, to the lowest gradient position ;
repeat
foreach cluster centerCkdo
Assign the best matching pixels from a2S∗2Ssquare neighborhood around the cluster center according to the distance measureD;
end
Compute new cluster centers and residual error E (L1 distance between previous centers and recomputed centers) ;
until(E≤threshold); Enforce connectivity;
it will be easy to cause error in boundary segmentation. Ifkis too large, there is no difference between superpixel segmentation and the original method.K= 300gives an optimum tumor detection. All the examples in the work usedk= 300.
mis a parameter to weigh the relative importance between color similarity and spatial proximity. Whenmis large, spatial proximity is more important and the resulting superpixels are compact. When mis small, the resulting superpixels adhere more tightly to image boundaries, but have less irregular size and shape. The value form is set to10in the work.
2.3 Thresholding
Image thresholding is a popular and generally effective method for image segmentation. The key to a good image thresholding opera-tion is the selecopera-tion of an optimum threshold value. The mean and variance are statistical measures that characterize images. To deter-mine an optimum threshold on a case by case basis for each given image, The ratio of the mean and variance were computed. The value of the ratio determines the optimum threshold to choose for each image.
2.4 Region Merging
Region merging is the last step. Region merging operations elim-inate false boundaries and spurious regions by merging adjacent regions based on the gray value of these regions. Region merging is preformed to merge the tumor sections circled together as one region. It is achieved by joining adjacent regions that belong to the tumor section.
3. EXPERIMENTAL RESULTS AND DISCUSSION
The BRATS 2013 and 2015 clinical dataset are used to evaluate the robustness of the method. 90 High Grade Glioma (HGG) and Low Grade Glioma(LGG) and60normal images are used to find how sensitive and specific the method is. The sensitivity, speci-ficity, misclassification rate, false positive rate and precision are shown in table 1. A comparison of the proposed method in this paper on BRATS 2013 and 2015 dataset is compared with other good methods shown in Table??. The proposed method was com-pared with Tusionet al. which was the winner of on-site BRATS 2013 challenge, Reza and Iftekharuddin which was the best result for the training set of BRATS multiprotocol dataset (although this
Algorithm 2:Pseudocode for Thresholding FnFunctionend
(/* Pseudocode for Thresholding */)Thresholding() Initialize original image x;
Initialize label image y; Calculate the mean of x; Calculate the variance of x;
if(2.31≤ m
v ≤2.01||1.7≤ m
v ≤2)then Set threshold T = 195;
end
if(2.06≤ m
v ≤2.09999then set threshold T = 210;
else
set threshold T = 200;
end
if(mean of the pixel intensity of region<T)then
Region is not tumor affected;
else
Region is tumor affected;
end
[image:3.595.300.556.73.296.2]paper only used T1c protocol) and Soltaninejadet al. automated brain tumour and segmentation using superpixel-based extremely randomized trees. The method described in this paper achieved a sensitivity of 0.89 which is very close to0.92sensitivity of Reza and Iftekharuddin [17].
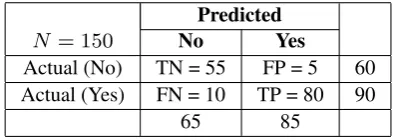
Table 1. : Performance of proposed algorithm with BRATS dataset
Predicted
N
= 150
No
Yes
Actual (No)
TN = 55
FP = 5
60
Actual (Yes)
FN = 10
TP = 80
90
65
85
N is the number of images used in testing, True Negatives(TN) rep-resents those predicted as no, and actually have no tumor present. True Positive(TP) represents the predicted yes (tumor present), and actually have tumor present. False Negative(FN) represents the pre-dicted no, but actually do have the disease. (Also known as a Type II error). False Positive(FP) represents the predicted yes, but actu-ally do not have the disease. (Also known as Type I error).
Table 2. : Performance of proposed algorithm with BRATS dataset
Accuracy
0.9
Misclassification
0.1
Sensitivity
0.89
False positive rate
0.083
[image:3.595.337.534.393.463.2]Table 3. : Comparison with other related methods using BRATS dataset
Method Description Comment Sensitivity Tustion et
al[16]
Random forests (ANTs/ANTsR package
Best MICCAI 2013 on site
0.87
Reza and Iftekharud-din [17]
Random forests + tex-ture featex-tures
Best training MICCAI 2013
0.92
Soltaninejad et al.[15]
ERT + supervoxels Training MIC-CAI 2012
0.088
Proposed Method
Superpixels + Thresh-olding
Testing on BRATS 2013 and 2015
0.89
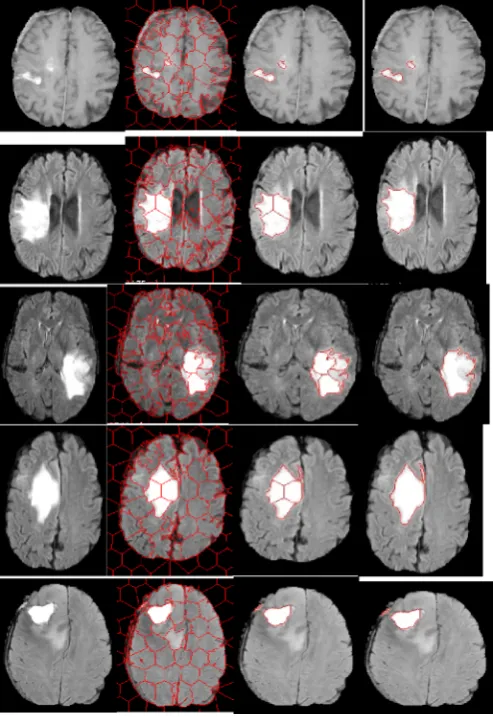
Fig. 3: Images of segmented tumor from brain scans from BRATS 2015 database.L-RInput images, Image after SLIC operation, Threshold and Region Merging, Final determining of tumor
The algorithm was implemented using MATLAB 2017 software. A number of images from the BRATS 2015 database were anal-ysed. Figure??shows the results of the proposed segmentation al-gorithm. The results are satisfactory, as tumor sections are correctly segmented. The method ensures that the segmentation adheres to boundaries and is compact.
4. CONCLUSION AND FUTURE WORK
In this paper, a SLIC based approach to segmenting tumors in brain scans is proposed for computer aided diagnostic functions. The proposed procedure utilizes a simple, yet innovative technique of identifying the optimum threshold value; this is in order to thresh-old the images after utilizing SLIC. This is achieved by using the mean and variance of pixel values of the digital images. Prelim-inary results from using images from the BRATS 2015 database show that tumors segmented adhere to boundaries, and is compact. In the future, work will be directed towards using more data from other databases to further validate the proposed approach. Explo-rations will be made on the use of improved SLIC based algorithms including IMSLIC [14]. Finally, attention will also be paid to ex-tending the work to 3D images scans.
5. REFERENCES
[1] Elke Hattingen, Ulrich Pilatus, Brain Tumor Imaging, Springer, 2016.
[2] Al-Azzawi,Nemir Ahmed, and MohannadKadhimSabir, ”A superior achievement of brain tumor detection using segmen-tation based on ftransform,” in In Computer Networks and Information Security (WSCNIS), World Symposium , 2015 . [3] Mathur, Neha, Pankaj Dadheech, and Mukesh Kumar Gupta,
”The Kmeans Clustering Based Fuzzy Edge Detection Tech-nique on MRI Images,” in Advances in Computing and Com-munications (ICACC), Fifth International Conference, 2015. [4] Banday, Shoaib Amin, and Ajaz Hussain Mir, ”Statistical
tex-tural feature and deformable model based MR brain tumor segmentation,” in Advances in Computing, Communications and Informatics (ICACCI), , 2016.
[5] El-Khamy, Said E., Rowayda A. Sadek, and Mohamed A. El-Khoreby, ”An efficient brain mass detection with adaptive clustered based fuzzy C-mean and thresholding,” in In Signal and Image Processing Applications (ICSIPA), , 2015 . [6] Vidyarthi, Ankit, and Namita Mittal, ”Brain tumor
segmenta-tion approaches: Review, analysis and anticipated solusegmenta-tions in machine learning,” in In Systems Conference (NSC), , 2015. [7] Abdullah, Hdeel N., and Mustafa A. Habtr, ”Brain Tumor
Ex-traction Approach in MRI Images Based on Soft Computing Techniques,” in Intelligent Networks and Intelligent Systems (ICINIS), 8th International Conference, 2015.
[8] Sandabad, Sara, Yassine Sayd Tahri, Achraf Benba, and Ahmed Hammouch, ”New tumor detection method using Nl- means filter and histogram study,” in Complex Systems (WCCS), Third World Conference , 2015 .
[9] Hachemi, B., S. Oudjemia, F. Alim, S. Seddiki, F. Talbi, and M. Abdelaziz., ”Cerebral abnormalities detection by region-growing segmentation and KNN classification,” in In Innova-tive Computing Technology (INTECH), 2015 Fifth Interna-tional Conference on, 2015.
[11] X. Ren and J. Malik., ”Learning a classification model for segmentation.,” in IEEE Conference on Computer Vision (CVPR), 2003.
[12] Radhakrishna Achanta, Appu Shaji, Kevin Smith, Aurelien Lucchi, Pascal Fua, and Sabine Ssstrunk, ”SLIC Superpix-els Compared to State-of-the-art Superpixel Methods,” IEEE Transactions on Pattern Analysis and Machine Intelligence num. , vol. vol. 34, no. 11, pp. p. 2274 - 2282, May 2012. [13] Menze et al, ”The Multimodal Brain TumorImage
Segmen-tation Benchmark (BRATS),” IEEE Transaction on Medical Imaging, 2015.
[14] Yong-Jin Liu, Cheng-Chi Yu, Min-Jing Yu, Ying He, ”Mani-fold SLIC: A fast method to compute content-sensitivie su-perpixels,” in Conference on Computer Vision and Pattern Recognition, 2016.
[15] Mohammadreza Soltaninejad et al.,Automated brain tumor detection and segmentation using superpixel-based extremely randomized trees in FLAIR MRI, February 2017, Volume 12, Issue 2, pp 183-203, International Journal of Computer As-sisted Radiology and Surgery
[16] Tustison N, Wintermark M, Durst C, Avants B (2013) ANTs andarboles. In: Proceedings of NCI-MICCAI BRATS, pp 4750
[17] Reza S, Iftekharuddin KM (2013) Multi-class abnormal braintissue segmentation using texture features. In: Proceed-ings of NCI- MICCAI BRATS, pp 3842
[18] Menze BH, Jakab A, Bauer S, Kalpathy-Cramer J, Farahani K,Kirby J, Burren Y, Porz N, Slotboom J, Wiest R, Lanczi L, Gerstner E, Weber MA, Arbel T, Avants BB, Ayache N, Buendia P, Collins DL, Cordier N, Corso JJ, Criminisi A, Das T, Delingette H, Demiralp , Durst CR, Dojat M, Doyle S, Festa J, Forbes F, Geremia E, Glocker B, Golland P, Guo X, Hamamci A, Iftekharuddin KM, Jena R, John NM, Konukoglu E, Lashkari D, Mariz JA, Meier R, Pereira S, Precup D, Price SJ, Raviv TR, Reza SMS, Ryan M, Sarikaya D, Schwartz L, Shin HC, Shotton J, Silva CA, Sousa N, Sub-banna NK, Szekely G, Taylor TJ, Thomas OM, Tustison NJ, UnalG,VasseurF,WintermarkM,YeDH,ZhaoL,ZhaoB,ZikicD, Prastawa M, Reyes M, Leemput KV (2015) The mul-timodal brain tumor image segmentation benchmark (BRATS). IEEE Trans Med Imaging 34:19932024. doi:10.1109/TMI.2014.2377694