19
A Neuroph Approach for Classifying Ecoli Data
Ejiofor C. I.
Department of Computer Science, University of Port Harcourt,
Port Harcourt. Nigeria
Okon E. Uko
Department of Computer Science, University of Port Harcourt,
Port Harcourt. Nigeria
ABSTRACT
Classification methods are used in handling classification problems, which usually exist when entities or objects needs to be assigned predefined groups or classes, perhaps based on attributes, parameters and values. This research paper provides a simplified description of neuroph classification using Ecoli data. The data were structured into training and testing datasets. The neuroph neural network architecture caters for 34 neurons: twelve input neurons (12), seventeen (17) hidden neurons and five (5) output neurons. The training accommodated approximately 185 iterations with a cumulative error of 6.8544 and an average error of 0.0367. The Total Mean Square Error (TMSE) obtained from testing the trained data gave an approximate value of 2.7372. This minima error showed the optimality in training and classification using Ecoli data.
General Terms
Neural network, artificial neural network, artificial intelligence, neurons
Keywords
Neuroph, Classification, Ecoli.
1.
INTRODUCTION
Classification; an ordered set of related entities is applied in grouping data based on similarities or attributes [6]. This concept is an integral functionality of human existence facilitating appropriate decision making from the perspective of shared attributes (descriptors). Classification identifies exhibited parameters displayed or possessed by these entities (objects) [7]. Classifications are designed with classification problems in perspective which usually existing when entities or objects need to assigned predefined groups or classes, perhaps based on attributes, parameters and values [2]. The success of classifying any entities, depends, largely and efficiently on the associated attributes internally and externally exhibited [10]. This attributes identify the existences and functionalities of the object been classified. Classification is a sub domain of clustering problems which may classify both inanimate and animate entities ([1];[2]).
The medical field has explored entity classification in addressing medical problems due to the abundance of medical data and its similarities [4]. Medical Classification or Medical is an offshoot of clustering or classification. MC is a transformation process in which medical descriptors or attributes of medical diagnoses and procedures are categorized into entities with unique attributes [4]. The classification of various disease agents (viral, bacterial or pathogenic) has gradually evolved within the medical fields. Notable among this agent is Escherichia coli (E-coli) which have contributed to the propagation of diarrhea and other infectious disease caused by these bacteria. E-coli are bacteria found in the environment, foods, and intestines of people and animals. E. coli are a large and diverse group of bacteria [9]. Although some strain are harmless enhancing body functionalities, some strain of E-coli
causes sick such as diarrhea, kidney failure, urinary tract infections, respiratory illness, pneumonia, and even death. These problems are most likely to occur in children and in adults with weak immune systems [5]. Symptoms of infection include: nausea or vomiting, severe abdominal cramps, watery or very bloody diarrhea, fatigue and fever [9].
Notably, the classification of medical entities are handled using simulator: Matric Laboratory (MATLAB), Neuroph, Simulink, Mapslim, Mathematica, Netslim, ProLB, SimEvent, TRNSYS, PSF Lab, VisSim, Vortex, VisualSim Architect, NI Muttisim ([11]; [8])
Neuroph has been repeatedly applied in classifying neural network based entities with varied parameters and associated classes. Neuroph is a lightweight Java neural network framework used in developing neural network architectures. It consists of well designed, open source Java Library with small number of basic classes’ corresponding to neural network concept. Neuroph simplify the development of neural networks by providing Java neural network library and GUI tool that supports creating, training and saving neural networks [11].
Consequently, it is the intent of this research to employ Neuroph as a computer simulator in classifying E.coli data
2.
NEUROPH ARCHITECTURE
Neural networks are artificial intelligence (machine learning technology) suitable for ill-defined problems, such as recognition, prediction, classification, and control [12]. Neural are perhaps suitable for implementation using Neuroph.
Neuroph is a Java Neural Network development environment built with close integration with NetBean Platform and Neuroph Framework [12]. It is customized as an Integrated Development Environment (IDE) for neural network simulation [10]. It is an interactive Java framework that provides classes for building neural network. In addition to providing easy-to-use neural network wizards and tools, Neuroph also integrates basic Java development modules from the NetBeans IDE, enabling developers to create, test, and deploy various Java components based on neural networks in the same environment [10].
Neuroph contains well designed, open source Java Library with small number of classes which corresponds to basic NN concept. It also provides Java neural Library and GUI tools that support creating, training and saving Neural networks [10].
3.
NEUROPH SIMULATION
The simulation of E.coli experimental data using Neuroph simulator provide necessary simulation steps, creating a neuroph architecture with experimental data transformed through normalization, training and testing. The simulation steps includes: preparation of training data, creating a neuroph project, creating a training set, creating a neural network, training the network and testing the network.
International Journal of Computer Applications (0975 – 8887) Volume 179 – No.24, March 2018
20 involves a preprocessing paradigm where experimental data are
kept with a constrained boundary. The preparation/normalization/preprocessor formula is found on equation 1. The value M is the standard normalized value for variable V in the Ith row is calculated as:
[image:2.595.64.533.238.515.2]
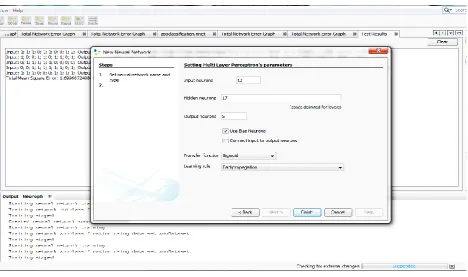
Figure 1 portrays the neuroph project. The second step involves creating a new Neuroph project succeeding data standardization, which involves placing the data in a .csv file ready for training set. It also involves setting up the number of input, hidden neuron and expected output. It also involves setting up the transfer function and leaning rule Figure 1 portrays the neuroph project with a total of twelve (12) inputs, seventeen (17) hidden neuron and five (output). It also portrays a transfer function of sigmoid membership and a back propagation as a learning paradigm.
Fig. 1: Neuroph Initiation project
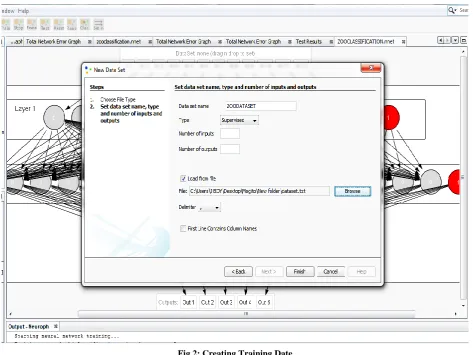
The third step involves creating the simulation training set, which involves preferring a suitable training data name with associated input parameters identified. The step also involves choosing the learning and classification paradigm. For this
21
Fig 2: Creating Training Date
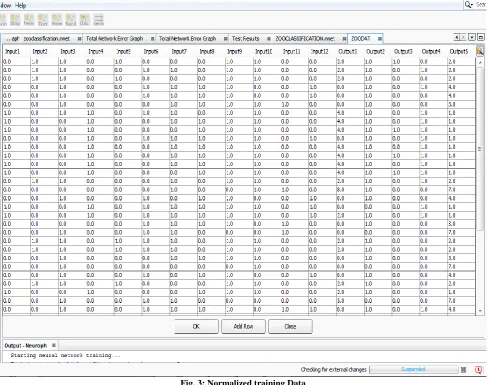
Figure 3, portrays these normalized, scaled data between a value range of 0 -1. It also shows clearly a total of twelve (12)
International Journal of Computer Applications (0975 – 8887) Volume 179 – No.24, March 2018
[image:4.595.54.543.73.458.2]22
Fig. 3: Normalized training Data
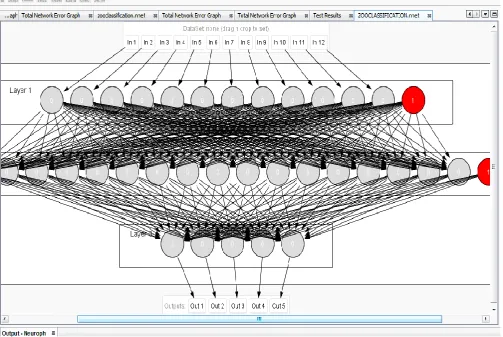
The fourth Step involves creating Neural Network Architecture using an appropriate number of neurons inclusive of hidden neurons. Since this phase is not universal across board, identifying appropriate number of neurons input, hidden and output will prevent the training structure for converging toward
23
Fig. 4: Neuroph Neural Network Architecture
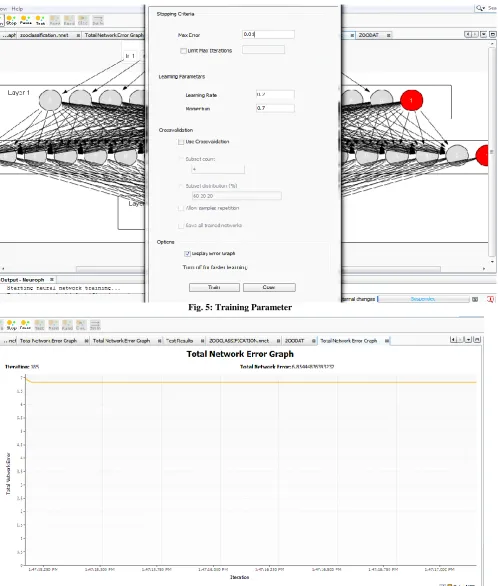
The fifth Step involves training the network using the created training and normalized data. This point involves setting the learning parameter, the maximum error, learning rate and the momentum. This research identifies a maximum error of 0.01, learning rate 0.2 and momentum 0.7, the iteration count is 4 and
International Journal of Computer Applications (0975 – 8887) Volume 179 – No.24, March 2018
[image:6.595.57.556.68.655.2]24
Fig. 5: Training Parameter
Fig. 6: Neuroph Training Error
4.
NEUROPH TESTING
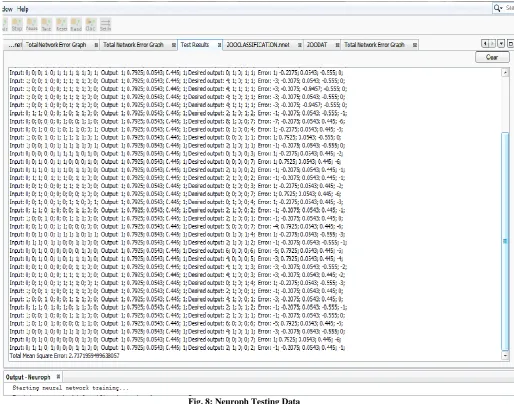
The Neuroph training identifies training input and compared actual output with desired output. Succeeding network testing,
25
Fig. 8: Neuroph Testing Data
From the training data above comprise approximately about 50 training cases with 12 input and five expected output…………Total Mean Square Error: 2.7371959499638057~2.74
5.
RESULT DISCUSSION
The application of Neuroph for the classification of E-coli data has been implemented. This approach purely focuses on machine learning using a Java-based integrated platform Neuroph. It imbed 34 neurons with 17 neurons used internally and 17 used externally (input and output). The iteration combine produced a summation of 6.8544 errors and an average error of 0.0367. Testing the training data, a testing error of 2.73719 was obtained.
6.
CONCLUSION
This research paper has applied Neuroph to the classification of E-coli data. The neural network based architecture provides five (05) outputs from twelve (12) inputs using seventeen (17). The training was optimal with an iteration of one hundred and eight five (185) and summation error of about 6.0. This training data shows the usefulness and versatility of Neuroph in providing optimal classification.
7.
REFERENCES
[1] Ahmad, L. D. 2007, A method to compute distance between two categorical values of same attribute in
unsupervised learning for categorical data set. Pattern Recognit. Lett. 28(1), 110–118.
[2] Anemone R. L. 2011, Race and biological diversity in humans, Race and Human Diversity: A Bio-cultural Approach. Upper Saddle River, NJ: Prentice Hall. 1–10. ISBN 0-131-83876-8.
[3] Ankerst, M. M. Breunig, H.P. Kriegel, J. Sander 1999, Optics: ordering points to identify the clustering structure, in ACM SIGMOD International Conference on Management of Data.
[4] Bilgisayar M. B. 2011, Classification of medical documents according to diseases, retrieved from: http://ieeexplore.ieee.org/document/7130164/.
[5] Centre for Disease and Control and Prevention; CDC 2017, Escherichia coli, retrieved online from http://cdc.com, October, 2017/
[6] Central Statistical Office CSO, 2014, what is
Classification, retrieved
http://www.cso.ie/en/methods/Classification/a//whatisaclas sification/
International Journal of Computer Applications (0975 – 8887) Volume 179 – No.24, March 2018
26 Sciences (ELS). John Wiley & Sons, Ltd: Chichester
[8] Karl J. Å., 2001, Control of Complex Systems, Springer.
[9] MedlinePlus 2017, “E.Coli Infection”, retrieved from https://medlineplus.gov/ ecoliinfections.html.
[10]Paul N. Finlay 2011, A classification of success factors for decision support systems, The Journal of Strategic Information Systems, 7(1), 53-70. Retrieved from https://www.predictiveanalyticstoday.com/neuroph/
[11] Sinha, R.; Liang, V.C.; Paredis, C. J. J.; Khosla, P.K. 2001."Modeling and Simulation Methods for Design of Engineering Systems", Journal of Computing and Information Science in Engineering. 1: 84–91. doi:10.1115/1.1344877. retrieved from http://neuroph.sourceforge.net/sample_projects.html
[12] Zoran S. 2011, Neural Networks on the NetBeans
Platform, retrieved from
http://www.oracle.com/technetwork/articles/java/nbneural-317387.html