RESEARCH ARTICLE
APPLICATION OF SEQUENTIAL MANN-KENDALL TEST FOR DETECTION OF APPROXIMATE
SIGNIFICANT CHANGE POINT IN SURFACE AIR TEMPERATURE FOR KOLKATA WEATHER
OBSERVATORY, WEST BENGAL, INDIA
1
Dipak Bisai,
2Soumendu Chatterjee,
3*Ansar Khan and
4Nilay Kanti Barman
1Department of Geography, Egra S.S.B. College, Egra, India
2Department of Geography, Presidency University, Kolkata, India
3Department of Geography and Environment Management, Vidyasagar University, Midnapore, India
4Department of Geography, Hijli College, Kharagpur, India
ARTICLE INFO ABSTRACT
Large potential and scientific studies have been carried out up to date to detect and locate climate changes and trends in different parts of the world by examine and analyze various climate key factors such as; air temperature, rainfall records humidity concentration etc. Some of these studies deal with measurements of temperature time series for specific meteorological stations due to the importance of its long records of fluctuating temperature data, location and reliability. Pursuance on the recent studies, that have shown that the Earth’s surface air temperature has increased by 0.6˚C to 0.8˚C during the 20th century, along with the regional abrupt changes of lower atmospheric temperature. This environmental situation has drawn great interest to climate researchers leading to several studies on climate trend detection at various scales. This paper examines the long term modification of lower atmospheric temperature time series in Kolkata observatory. Time series of lower atmospheric temperature data for the period considering from 1941-2010 for Kolkata weather observation station was collected from the Indian Meteorological Department (IMD, Alipur). Fluctuations of trend and detection of abrupt change point of mean monthly temperature time series were examined. The nonparametric Mann-Kendall test was employed to detect trends and change points of the mean monthly temperature. Statistically approximate significant (p≤0.05) abrupt changes and trends have been detected. The plots of forward sequential values u t( )i and backward sequential values u t( )i
intersect each others, than it has indicated change points in considered data set. According to this statistical test for Kolkata observatory, in 1986, 1973 and 1999, 1970, 1975, 1993, 1999, and 1958 are showing the significant potential change point in the temperature time series for March, April, May, June, July, November, December respectively.
Copyright © 2014 Dipak Bisai et al.This is an open access article distributed under the Creative Commons Attribution License, which permits unrestricted use, distribution, and reproduction in any medium, provided the original work is properly cited.
INTRODUCTION
Climate change and global warming are recognized worldwide as the most significant environmental dilemma the planet is experiencing today (Pachauri et al., 2007; Solomon et al., 2007; Parry et al., 2007; Metz et al., 2007). Several studies of long-term temperature time series have been done on a hemispherical and global scale (Broham et al., 2006; Jones and Moberg, 2001; Soon et al., 2000). Temperatures in lower troposphere have increased between 0.13˚C and 0.22˚C per
decade since 1979, according to satellite temperature measurements (Vinnikov and Grody, 2003). Some other studies have been carried out at regional scale and have indicated that significant trend changes in observed temperature have occurred during the second half of the 20th
*Corresponding author: Ansar Khan
Department of Geography and Environment Management, Vidyasagar University, Midnapore, India
century and that the increasing has persisted in Europe (Arnell, 2009; Aesawy and Hasanean, 1998; Mikdat, ?), in North America (Hinggis et al., 2002; Easterling et al., 1999; Lettenmaier et al., 1994) etc. During the last 100 years China has experienced a warming by 0.79˚C at the rate of 0.08˚C per decade (Ren et al., 2002; Qian and Linx, 2005; Wang, 2003). Large volume of literatures has been produced on surface air temperature variations that include research works to confirm global warming by use of variety of methods (Balling et al., 1990; Easterling et al., 2000; Easterling and Horton, 1997; Safari, 2012). It has been argued that daily minimum temperature exhibits more associations with global warming phenomenon rather than daily maximum temperature (Easterling and Horton, 1997). To some extent, other factors such as variations in solar radiation at regional scale and land-use are also considered to be among the caland-uses of the observed global warming. From every view points, the atmospheric temperature is the key factor to change the climatic effect in
ISSN: 0975-833X
International Journal of Current Research
Vol. 6, Issue, 02, pp.5319-5324, February,2014
INTERNATIONAL JOURNAL OF CURRENT RESEARCH
Article History:
Received 20th
November, 2013 Received in revised form 17th
December, 2013 Accepted 15th January, 2014 Published online 28th February,2014
Key words:
Sequential Mann-Kendall Test statistic; Temperature Trend;
local or regional scale. However, the trend analysis and change point detection for any meteorological parameter owe to active lines of investigation that seeks to identify the climate change in a particular region. Though some studies have been done on climate change in different regional parts of India whole of the sub-continent, the lack of reliable surface observational climate data still constitute a foremost gap affecting the detection capacity of impacts resulting from long-term climate change. The key sources of errors in the detection of abrupt changes in climate data primarily consist of change of location of the observatory; changes of instrument; change in observational times; missing data and methods applied for calculating daily means and increase in urbanized and industrialized areas. The in homogeneities in climate data series can bring inaccuracies and make possible misinterpretations of the investigated of climate change, if any, over a region when analysis is done involving time series of climate parameters. So, it is earnestly necessary to examine the nature of trends and related change points in atmospheric temperature time series data by proper and authentic statistical method which is capable of indicating the abnormalities in a time series most reliably. In this paper we have applied sequential Mann-Kendall test (Seq-MK) statistic to estimate the qualitative change in the trend of atmospheric temperature, if any. It appears, therefore, the considered serviceable data set indicates a minimum of one and maximum of six change points over the period from 1941 to 2010.Though, all the detected change points are not statistically significant, but few of them are statistically significant and considered as potential change points at chosen level of significance.
Study Area
Kolkata (22˚35'N and 88˚30'E) the largest agglomeration in
West Bengal, India. It is also the capital city of West Bengal, in British colonial period; it was once the capital of India. As such, it has witnessed a rapid growth of population. It is the 7th populated metropolitan city in India according to the 2011 census. River Hoogly is flowing along the western margin of this metropolitan area. The area under urban cover and population has increased throughout its long history since the early colonial period. Following India’s independence in 1947, Kolkata which was once the centre of modern education, science, culture, and politics in India witnessed several decades of relative economic stagnation. Since the early 2000s, an economic rejuvenation has led to its accelerated growth. Kolkata, spreads roughly north–south along the east bank of the Hooghly River. Its sits within the lower Ganges Delta of eastern India; the city's elevation is 1.5 to 9 m (5 to 30 ft). Much of the city was originally a wetland that was reclaimed over the decades to accommodate a burgeoning population. The remaining undeveloped areas, known as the East Kolkata Wetlands, were designated as a "wetland of international importance" by the Ramsar Convention (1975). The Kolkata
metropolitan area spreads over
1,886.67 km2 (728.45 sq mi) and comprises 3 municipal corporations (including Kolkata Municipal Corporation), 39 local municipalities and 24 panchayat samitis, as of 2011.Kolkata is subject to a tropical wet-and-dry climate that is designated Aw under the Köppen’s climate classification scheme. The annual mean temperature is 26.8˚C (80.2˚F); monthly mean temperatures range between 19 to 30 ˚C (66 to
86 ˚F). Summers (March–June) are hot and moderately humid, with temperatures in the low 30˚C. During dry spells, maximum temperatures often exceed 40 ˚C (104˚F) in May and June. Winter lasts for only about two months, with seasonal low temperature range to 9 to 11˚C (48 to 52˚F) in December and January. May is the hottest month, with daily temperature ranging from 27 to 37˚C (81 to 99˚F); January, the coldest month, has temperatures varying from 12 to 23˚C (54 to 73˚F). The highest recorded temperature is 43.9˚C (111.0˚F), and the lowest is 5˚C (41˚F), as measured of the Alipur weather observation station. During April–June, the city experiences heavy rains or dusty squalls followed by thunderstorms or hailstorms, bringing cooling relief from the consisting humidity. These thunderstorms are convective in nature, and are known locally as kal baisakhi, or "Nor'westers" in English.
MATERIALS AND METHODS
This analysis was made based upon atmospheric temperature data collected from Indian Meteorological Department (IMD) Kolkata (Alipur) recorded at Kolkata weather observation station for the period from 1941 to 2010. Mean monthly maximum and mean monthly minimum temperature for each of the months over the 70 years has been considered. Month-wise mean maximum and mean minimum temperatures are averaged to get mean monthly temperature year-wise. Finally, the monthly average data-sets were employed for statistical analysis. In order to identify discontinuities and detection of change point thereby. Sequential Mann-Kendall (Seq.MK) test statistic is applied. It is a valid method for detecting change point in a time series as suggested by many investigators.
Sequential Mann-Kendall Test Statistic
The Sequential version of Mann-Kendall test statistic (Sneyres, 1990) on time series xidetects recognized event or change points in long- term time series. The Sequential Mann-Kendall test is computed using ranked values, yiof the original values
in analysis (x x x1, 2, 3,,xn), The magnitudes of yi (i1, 2, 3,..., )n are compared withyj, (j1, 2,3,...,i1). For
each comparison, the cases where yi yj are counted and
denoted byni. A statistic tican therefore be defined as:
1 i i i j t n
(1)The distribution of test statistic tihas a mean as
( 1) ( )
4 i
i i
E t (2)
and variance as
( 1)( 2 5 )
( )
7 2 i
i i i
The sequential values of a reduced or standardized variable, called statistic ( )u ti is calculated for each of the test statistic variable ti as follows:
[ ( ) ( ) var( ) i i i i
t E t
u t
t
(4)
While the forward sequential statistic, ( )u ti is estimated using the original time series (x x x1, 2, 3,,xn),values of the backward sequential statistic,u t( )i are estimated in the same manner but starting from end of the series. In estimating ( )u t i the time series is resorted so that last value of the original time series comes first (x x x1, 2, 3,,xn). The sequential version of Mann-Kendall test statistic allows detection of approximate beginning of a developing trend. When ( )u ti and u t( )i curves are plotted, the intersection of the curves u t( )i and u t( )i locates approximate potential trend turning point. If intersection of ( )u ti and u t( )i occur beyond 1.96 (5% level) of the standardized statistic, a detectable change at that point in the time series can be inferred. Moreover, if at least one value of the reduced variable is greater than a chosen level of significance of Gaussian distribution the null hypothesis (H0: Sample under investigation shows no beginning of a new trend) is rejected.
RESULTS AND DISCUSSION
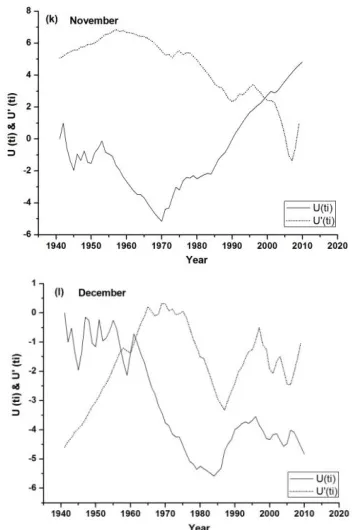
The results of Sequential Mann-Kendall test statistic for monthly average temperature data set of Kolkata station clearly detects the statistically significant change points in yearly trend of monthly temperature. Yearly plots of ( )u ti and
( )i
u t values for each of the months of a year have been shown in Fig. 1. In case of the month of January, an apparently decreasing trend from 1971 to 2010 is observed where the change point is also detected in 1971. Though the curves intersect each other in 1971, but it cannot be recognized as a significant turning point due to a probability value much higher than the accepted level of significance (p≤0.05). The
( )i
u t and u t( )i curves both exhibit a continuously decreasing
trend till 2010. For the month of February, ( )u ti and u t( )i plots (Fig-1b) show an increasing trend till 1959 and 1982 respectively, and a decreasing trend between 1960 and 2010, and 1982 and 2010. Though less significant, 1972 can be identified as a turning point in the temperature trend of February.
It is interesting to note that the change point has been detected almost at the middle of the period in consideration. ( )u ti and
( )i
u t plots for the month of March (Fig-1c) intersect each others for several times signifying no recognizable trend in the time series. Among these change points, 1986 is the significant turning point according to considered confidence limit (p ≤
0.05). The value of reduced variable at this point is 3.380. The forward and backward sequential values are in increasing trend during the periods from 1941 to 1971 and 1946 to 1970 respectively. During this period of increasing trend both the lines intersect each other twice to indicate two change points,
of which one 1968 is statistically significant. Afterward, forward and backward sequential curves have indicated a continuously decreasing trend with two insignificant change points in 2006 and 2007. Sequential Mann-Kendall plots for April temperature has been given in Fig-1d. It shows that, the
( )i
u t and u t( )i curves are converging since 1941.Until they intersect each other at 1955 where from a increasing trend has started. A statistically significant change had occurred in 1973 with a value of the reduced variable of 4.0355. Hence, for the April data set a significant turning point has been detected in 1973 since when temperature has shown a declining trend. The
( )i
u t plot also helps to understand that April temperature at Kolkata has increased since 1955 till 1970 and afterward it has declined till 2000. The ( )u ti and u t( )i curves make a divergent trend from 2001.
( )i
u t and u t( )i plots for the month of May (Fig-1e) display three points of intersection at 1942, 1970 and 1995. According to the chosen confidence level, only 1970 is the statistically significant change point. The sequential values of the forward and backward curves have decreased till 1958 and 1961, respectively. After that both the curves intersect each other in above said years. The value of u t( )i in 1970 is 2.785.After 1970 temperature has significantly declined. Then they have shown increasing divergence till 2010. Overall trend of the month of May is not significant. June (Fig-1f) indicates a less significant trend turning point by the end of the 5th decade of the last century. During the period in consideration the temperature time series for June has indicated three change points. Among them 1975 is the statistically significant at the chosen level of significance. The reduced value of this intersection point is 2.785. The temperature trend characteristics for the month of June is similar like the month of May.
Table 1. Change points Detection by Sequential Mann-Kendall
Test for Kolkata Observatory (Values significant at p≤0.05*)
Conclusion
Long term temperature time series of mean monthly temperature has been compiled and analysed. The study reveals that mean monthly temperatures for most of the months have increased from different time points within the considered time period. The remarkable observation of this analysis is that, the winter temperature is gradually increasing and the winter spell has become shorter. The months of March, April, May, June, July, November and December are statistically significant trend turning points over the year. It is important to note that these months except November and December falls within the pre-monsoon and monsoon season. The increase of average temperature may have significant bearing on the functionality of the monsoon weather system
over this area. Hence, findings of the present study will invite initiatives for further investigation on effect of increase of mean monthly temperature during monsoon season and also helps to understand the modifying patterns of rainfall.
REFERENCES
IPCC, “Climate Change 2007: Synthesis Report,” In: R. K. Pachauri and A. Reisinger, Eds., Contribution of Working Groups I, II and III to the Fourth Assessment Report of the Intergovernmental Panel on Climate Change (IPCC), Cambridge University Press, Cambridge, 2007.
IPCC, “Climate Change 2007: The Physical Science Basis,” In: S. Solomon, D. Qin, M. Manning, Z. Chen, M. Marquis, K. B. Averyt, M. Tignor and H. L. Miller, Eds.,
Contribution of Working Group I to the Fourth Assess- ment Report of the Intergovernmental Panel on Climate
Change (IPCC), Cambridge University Press, Cambridge,
2007.
IPCC, “Climate Change 2007: Impacts, Adaptation and Vulnerability,” In: M. L. Parry, O. F. Canziani, J. P. Palutikof, P. J. van der Linden and C. E. Hanson, Eds.,
Contribution of Working Group II to the Fourth Assess- ment Report of the Intergovernmental Panel on Climate Change (IPCC), Cambridge University Press, Cambridge, 2007.
IPCC, “Climate Change 2007: Mitigation of Climate Change,” In: B. Metz, O. R. Davidson, P. R. Bosch, R. Dave and L. A. Meyer, Eds., Contribution of Working Group III to the Fourth Assessment Report of the Inter-governmental Panel on Climate Change (IPCC), Cam-bridge University Press, Cambridge, 2007.
Broham, P., J.J. Kennedy, I. Harris, S.F.B. Tett and P.D.Jones, “Uncertainity Estimates in Regional and Global Observed Temperature Changes: A new data base from 1850,”
Journal of Geophysical Research, vol.111, 2006, D12106,
doi: 10,1029/2005JD006548.
Jones, P.D. and A. Moberg, ”Hemispheric and Large scale surface Air Temperature Variations: An Extensive Revision and Update to 2001,” Journal of Climate, Vol: 16, 2003, pp. 206-223. Doi: 10.1175/1520-0442(2003) 016<0206:HALSSA>2.0.CO:2
Soon, W., S. Baliunas, E.S. Posmentier and P. Okeke,” variations of Solar Coronal hole Area and Terrestrial Lower Atmospheric Air Temperature from 1979 to Mid-1998: Astronomical Forcing of Change in earth’s Climate,”New Astron, vol. 4, No. 8, 2000,pp. 563-579. Vinnikov, K. Y. and N. C. Grody, “Global Warming Trend of
Mean Troposphere Temperature Observed by Satellites,”
Science, Vol. 302, No. 5643, 2003, pp. 269- 272.
doi:10.1126/science.1087910
Arnell, N. W. “The Effect of Climate Change on Hydro-logical Regimes in Europe: A Continental Per-Spective,”
Global Environmental Change, Vol. 9, No. 1, 1999, pp.
5-23.
Aesawy, A. M. and H. M. Hasanean, “Annual and Sea-sonal Climatic Analysis of Surface Air Temperature Variations at Six Southern Mediterranean Observatories,” Theoretical
and Applied Climatology, Vol. 61, 1998, pp. 55-68.
[image:5.612.64.295.395.544.2]doi:10.1007/s007040050051
Figure 1. Abrupt change in Average monthly temperature as derived
from Sequential Mann-Kendal test statistic, u t( )i forward sequential
Mikdat, K. “Trends in Surface Air Temperature data over Turkey,” International Journal of Climatology, Vol. 17 Hinggis, R. W., A. Leetmaa and V. E. Kousky “ Relationships
between Climate Variability and Winter Tem-perature Extreme in the United States,” Journal of Cli-mate, Vol. 15, 2002, pp. 1555-1572.
Easterling, D. R., H. F. Diaz, A. V. Douglas, W. D. Hogg, K. E. Kunkel, J. C. Rogers and J. F. Wilkinson, “Long- Term Observations for Monitoring Extremes in the Am- ericas,”
Climatic Change, Vol. 42, 1999, pp. 285-308.
Lettenmaier, D. P., E. F. Wood and J. R. Wallis, “Hydro- Climatological Trends in the Continental United States 1948-1988,” Journal of Climate, Vol. 7, 1994, pp. 586- 607.
Ren, L.L., W .Zhang. C.H. Li, M.R. Wang, Impacts of Human Activity on River Runoff in the Northern area of China J. Hydrol.2002,261; 204-217.
Qian W, Linx, 2005. Regional trends in recent Precipitation indices in China, Meteorology and Atmospheric Physics 90: 193-207.
Wang, X.L., 2003: Comments on “Detection of undocumented change points: A revision of the two phase regression model.” J. Climate, 16, 3383-3385.
Balling R.C. Skindlow J A, Philips DA. 1990. The Impacts of Increasing Summer mean temperature on Extreme maximum and minimum temperature in Phoenix, Arizona, Journal of Climate 3: 1491-1494.
Easterling, DR. Evans LG, Groisman P.Y. Karl TR, Kunkel KE, Ambenze,P,2000, Observed variability in trends in extreme climate events: A brief review, Bulletin of American Meteorological Society 3: 417-425.
Easterling DR, Horton B.1997. Maximum and minimum temperature trends for the globe.science 227:364-367. Safari, B. Trend analysis of mean annual temperature in
Rwanda during last Fifty Two years, Journal of Environmental Protection, 2012,3,538-551,doi:10.4236/ jep.2012.36065.
Sneyres, R, 1990, Technical note no. 143 on the statistical Analysis of Time Series of Observation, World Meteorological Organisation, Geneva, Switzerland.