Original citation:
Erni-Cassola, Gabriel, Gibson, Matthew I., Thompson, Richard C. and Christie-Oleza, Joseph Alexander. (2017) Lost, but found with Nile red ; a novel method to detect and quantify small microplastics (20 µm–1 mm) in environmental samples. Environmental Science & Technology.
Permanent WRAP URL:
http://wrap.warwick.ac.uk/94731
Copyright and reuse:
The Warwick Research Archive Portal (WRAP) makes this work by researchers of the University of Warwick available open access under the following conditions. Copyright © and all moral rights to the version of the paper presented here belong to the individual author(s) and/or other copyright owners. To the extent reasonable and practicable the material made available in WRAP has been checked for eligibility before being made available.
Copies of full items can be used for personal research or study, educational, or not-for profit purposes without prior permission or charge. Provided that the authors, title and full bibliographic details are credited, a hyperlink and/or URL is given for the original metadata page and the content is not changed in any way.
Publisher’s statement:
“This document is the Accepted Manuscript version of a Published Work that appeared in final form in Environmental Science & Technology copyright © American Chemical Society after peer review and technical editing by the publisher.
To access the final edited and published work
http://pubs.acs.org/page/policy/articlesonrequest/index.html .”
A note on versions:
The version presented here may differ from the published version or, version of record, if you wish to cite this item you are advised to consult the publisher’s version. Please see the ‘permanent WRAP URL above for details on accessing the published version and note that access may require a subscription.
Lost, but found with Nile red; a novel method to detect and quantify
1small microplastics (20 µm–1 mm) in environmental samples
2Gabriel Erni-Cassola1*, Matthew I. Gibson2,3, Richard C. Thompson4, Joseph A.
Christie-3
Oleza1*
4
5
1
School of Life Sciences, University of Warwick, Coventry CV4 7AL, UK.
6
2
Department of Chemistry, University of Warwick, Coventry CV4 7AL, UK.
7
3
Warwick Medical School, University of Warwick, Coventry CV4 7AL, UK.
8
4
School of Biological and Marine Sciences, Plymouth University, Plymouth PL4 8AA, UK.
9
10
*corresponding authors at: School of Life Sciences, University of Warwick, Coventry CV4
11
7AL, UK.
12
[email protected] / [email protected] and
J.Christie-13
14
Abstract 16
Marine plastic debris is a global environmental problem. Surveys have shown that plastic
17
particles <5 mm in size, known as microplastics, are significantly more abundant in surface
18
seawater and on shorelines than larger plastic particles. Nevertheless, quantification of
19
microplastics in the environment is hampered by a lack of adequate high throughput methods
20
to distinguish and quantify smaller size fractions (<1 mm), and this has probably resulted in
21
an underestimation of actual microplastic concentrations. Here we present a protocol that
22
allows high throughput detection and automated quantification of small microplastic particles
23
(20–1000 µm) using the dye Nile red, fluorescence microscopy and image analysis software.
24
This protocol has proven highly effective in the quantification of small polyethylene,
25
polypropylene, polystyrene and nylon 6 particles, which frequently occur in the water
26
column. Our preliminary results from sea surface tows show a power-law increase of small
27
microplastics (i.e. <1 mm) with decreasing particle size. Hence, our data helps to resolve
28
speculation on the ‘apparent’ loss of this fraction from surface waters. We consider that this
29
method presents a step change in the ability to detect small microplastics by substituting the
30
subjectivity of human visual sorting with a sensitive and semi-automated procedure.
31
Introduction 33
It has been estimated that mismanagement of plastic waste resulted in up to 12.7
34
million tonnes of plastic entering the ocean in 2010 alone.1 In the environment, plastics
35
accumulate due to their recalcitrant nature, contaminating sediments and surface seawaters on
36
a global scale.2,3 In aquatic systems, polymer types with lower density than seawater have a
37
higher transportability (via rivers4 into marine coastal areas and oceanic gyres)5 than higher
38
density polymers, which tend to settle out.6–8 Lower density plastics, such as polypropylene
39
(PP), polyethylene (PE) and certain forms of polystyrene (PS) are frequently used as
40
packaging materials9 and hence, have a very short service life prior to disposal. These types of
41
plastic are also more commonly found in environmental surveys.10,11
42
Eriksen et al.12 estimated that about 5.25 trillion plastic fragments are currently
43
floating on the ocean’s surface. Extensive sampling of surface seawater and comparison
44
across all size classes (>200 µm) has shown that plastic particles <5 mm are significantly
45
more abundant than larger particles.5,12,13 These plastic fragments (<5 mm) have been termed
46
microplastics.14,15 Marine microplastics are composed of two main types: (1) primary
47
microplastics that stem directly from the source, such as microbeads contained in cosmetics,
48
or fibres released during washing of synthetic garments,16 and (2) secondary microplastics
49
that are generated through macroplastic fragmentation, a break down process influenced by
50
UV-irradiation, high temperatures and mechanical shear forces.17,18 Morét-Ferguson et al.19,
51
found that the average size of buoyant plastic particles in the Northern Atlantic and Caribbean
52
had halved in size from an average 10 mm in the 1990s to 5 mm in the 2000s. The decrease in
53
average size of plastic marine debris is of concern because the smaller synthetic polymers are
54
ingested by relatively more organisms at the base of the marine food web.3 Recent studies
55
suggest that ingested particles can be transferred between trophic levels20,21 and transport
56
persistent organic pollutants.22 The possible environmental effects of microplastics has led to
57
growing public and media attention as well as policy measures to reduce inputs, such as
58
banning the use of plastic microbeads in personal care products.23 Besides these concerns and
59
abatement measures, monitoring of marine litter is currently required in the EU under the
Marine Strategy Framework Directive (MSFD)24 and it is therefore essential to have reliable,
61
reproducible, rapid and inexpensive methods for quantification and monitoring of
62
microplastic contamination in the environment.
63
Current methodology for quantification of environmental microplastic contamination
64
is hampered by a lack of methods that are both sensitive and allow high throughput
65
quantification. Commonly applied methods separate synthetic microparticles from
non-66
synthetic materials via density separation and floatation techniques, before visually sorting
67
the particles and finally confirming their identity with spectroscopy.25 The data generated can
68
result in an underestimate of small microplastics because of the visual step in the process.26
69
Alternative, faster and less expensive protocols are of particular importance for routine
70
monitoring of plastic contamination by regulatory bodies and the need for developing new
71
methods has been clearly identified as a policy priority (MSFD).24 Here, we adopt the
72
sampling criteria proposed by the EU technical subgroup on marine litter,24 who recommend
73
two categories: large microplastics ranging from 5 mm–1 mm in size (visually recognizable)
74
and small microplastics ranging from 1 mm–20 µm for which reliable quantification is still
75
challenging.
76
In this study, we present the application of a fluorescence-based protocol using Nile
77
red to detect and quantify small microplastics in environmental samples. This method is
78
inexpensive, employs readily available equipment and can be semi-automated for high
79
throughput sample analysis. The method requires a sample purification step, fluorescence
80
microscopy (green fluorescence protein settings) and free image analysis software.
Materials and Methods 82
83
Microplastic staining and quantification protocol validation using commercial synthetic
84
polymers
85
86
Nile red had been suggested as a tool to fluorescently label microplastics18,27, and its use was
87
later demonstrated.28,29 The dye is commonly dissolved in acetone,30 but here methanol was
88
chosen because common plastics are resistant to it. The fluorescence of Nile red is influenced
89
by its concentration, which lies optimally between 0.1 and 2 µg mL-1,30 and higher
90
concentrations lead to quenching.30 Accordingly, the working solution for this study was
91
prepared by dissolving Nile red (technical grade, N3013, Sigma-Aldrich) in methanol to a
92
concentration of 1µg mL-1.
93
Staining efficacy and automated particle detection was tested on nine different
94
polymer types: PE (powder, ~40–48 µm, Sigma-Aldrich), poly(ethylene terephthalate) (PET,
95
powder, ≤300 µm, GoodFellow), PVC (powder, ~80–148 µm, Sigma-Aldrich), nylon 6
96
(pellets,~1 mm, Sigma-Aldrich), PP (pellets, ~7 mm, Sigma-Aldrich), PS (pellets, ~5 mm,
97
Sigma-Aldrich), PC (fragment from panel, ~10 mm), polyurethane (PUR, pellets, ~3 mm,
98
Sigma-Aldrich), and black tire rubber (fragment from bicycle tire, 7×4 mm). Nylon 6
99
microplastics were prepared by heating the pellets and pulling them apart to produce thin
100
fibres, which then were cut to microparticles (~63–91 µm) under a dissection microscope. PP
101
pellets as well as black rubber were ground in liquid nitrogen with mortar and pestle to obtain
102
small microplastic fragments (PP: ~20–130 µm, black rubber: ~57–171 µm). PS and PC
103
microparticles were obtained by sanding the pellets with a metal file and further cutting the
104
obtained particles with a scalpel under a dissection microscope to the final sizes (PS: ~24–196
105
µm, PC: ~94–169 µm). PUR pellets were directly cut to size under a dissection microscope
106
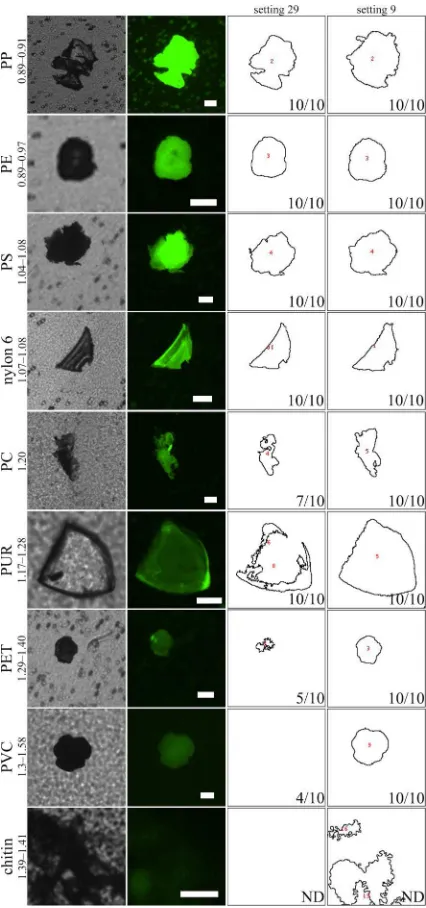
(~71–154 µm). Sizes of all microparticles produced in the laboratory were calculated from the
107
square root of particle area, which was measured in ImageJ using brightfield microscope
108
images. Ten particles of each polymer type were placed on separate clean PC track-etched
filter membranes (PCTE, 25 mm diameter, 10 µm pore size, Whatman) to evaluate the
110
efficiency of detection of our protocol. PCTE filters are optimal for two reasons: (1) their
111
hydrophilic surface avoids Nile red background fluorescence and (2) translucent properties
112
when exposed to methanol allow brightfield microscopy in addition to fluorescence
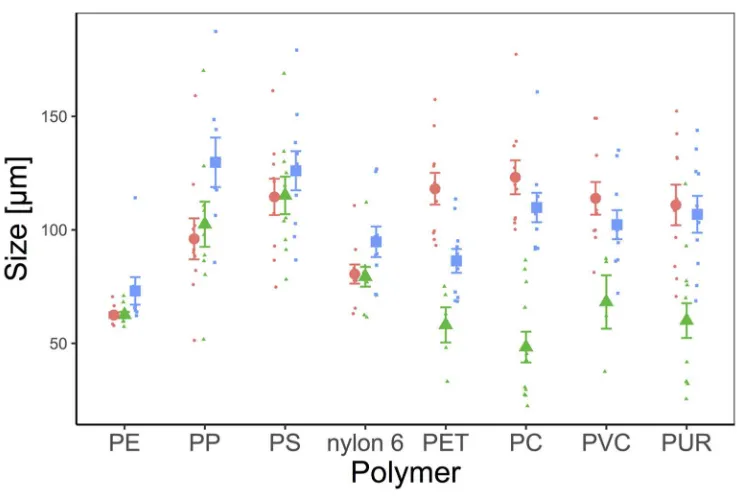
113
microscopy. About 2–3 drops of Nile red solution were carefully added to cover each filter.
114
Filters were placed on standard microscope slides, covered with cover slips and fixed with
115
tape to avoid movement of the sample. The samples were then maintained for 10 minutes at
116
60 °C in the dark.
117
Microscopic imaging was performed using a light microscope (Nikon Eclipse Ti)
118
equipped with a widefield camera (Andor Zyla sCMOS) and a LED for fluorescence. We
119
tested the fluorescence of the nine different polymers stained with Nile red on PCTE filters in
120
green (excitation/emission 460/525 nm) and red (565/630 nm). Green fluorescence was
121
chosen over red fluorescence because (1) synthetic polymers either fluoresced better in green
122
(fig. S1 a-d) or fluorescence did not differ significantly (fig. S1 e), (2) natural contaminants
123
fluoresced in red but not in green after hydrogen peroxide (H2O2) digestion (fig. S2, discussed
124
below) and (3) background signal from the filter membrane was lower. Three types of whole
125
filter images were obtained for each polymer type: red and green fluorescence, as well as
126
brightfield, all at a magnification of 10×. Exposure time for fluorescence was 30ms at 30%
127
LED strength.
128
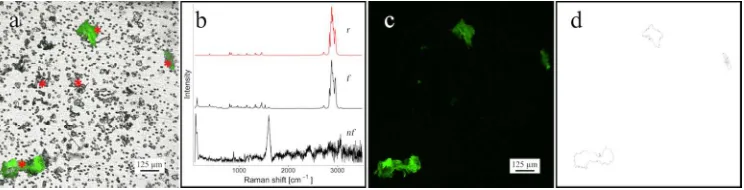
Automated particle recognition and quantification based on the fluorescent images
129
was performed in ImageJ (v1.50i). A macro was written to perform the following tasks: (1)
130
set the scale, (2) substract the background using a rolling ball radius of 1500 pixels, (3)
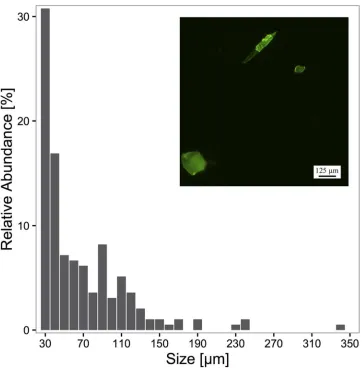
131
convert images to 8bit, (4) adjust black and white thresholds using 29 and 175 as the lower
132
and higher values of pixel brightness, and finally (5) quantify particles based on area (400 – ∞
133
µm2). The size detection limit was set to 400 µm2 to ensure that pores from the filter
134
membrane (diameter = 10 µm) did not interfere in particle measurements.
135
136
Validation of the pre-staining digestion protocol
138
To prevent overestimation of synthetic particles in environmental samples, it is of critical
139
importance that biogenic materials, such as lipids, chitin or wood lignin, which fluoresce
140
when stained with Nile red (fig. S2 a, c), are eliminated or cease to fluoresce when stained.
141
While digestion with nitric acid proved highly efficient at removing biogenic matter, its
142
application is limited due to pH-sensitive polymers, such as PS particles, which melt together,
143
or Nylon fibres, which are lost during the process.31 A chemical alternative is given with
144
H2O2 treatments, against which common synthetic polymers are resistant. 31,32
Hence,
145
digestion of biogenic material was performed as previously described by Claessens et al. with
146
slight modifications.31 Briefly, 20 ml of 30% H2O2 was added to 250 mL Erlenmeyer flasks
147
containing the filtered samples on PCTE filters, which were then kept at 60 °C for 1 h
148
followed by a prolonged 7 h step at 100 °C. Following the digestion, PCTE filters were
149
thoroughly rinsed with Milli-Q water and then removed. The remaining solution was filtered
150
through a new PCTE filter rinsing all particles from the flask and filtering device with
Milli-151
Q water. The new PCTE filter containing all collected material was stored in Petri dishes until
152
Nile red analysis.
153
The effect of the H2O2 digestion protocol on natural polymers was tested with the two
154
most commonly occurring natural polymers: chitin (powder, Sigma-Aldrich) and wood lignin
155
(below 1 mm in size; kindly provided by Prof. Tim Bugg and prepared according to
156
literature).33
157
158
Validation of the fluorescent-staining protocol with environmental samples
159
160
Net tow and beach sand samples were obtained in June 2016 to test our fluorescent-labelling
161
method with environmental samples. Tow samples were collected from within Plymouth
162
Sound, UK. Five consecutive trawls of 15 min were undertaken with a manta net (0.50 m by
163
0.15 m mouth, 300 µm mesh) at a ship speed of 4 knots. After each tow, the collected
164
material was transferred into a container by rinsing the net and cod end with seawater. In the
laboratory, all material was pre-filtered through a 1 mm metallic mesh to eliminate large
166
debris. Retained debris was thoroughly washed with Milli-Q water to extract all small
167
microplastics. Retained debris was visually examined for plastic debris (fig. S3). The flow
168
through containing plastic particles <1 mm was vacuum filtered through PCTE filters (47 mm
169
diameter, 10 µm pore size, Whatman). All filters were placed into a 250 mL flask.
170
Sediment samples were collected from a beach at Bigbury (UK, 50°16´53N,
171
3°53´42W) by transferring the top 1 cm layer of five 30 x 30 cm2 plots with a metallic spoon
172
into 500 mL glass bottles. Microplastics were extracted from sand samples according to the
173
density-separation/floatation protocol described in Nuelle et al.34 using NaCl (26% w/v)
174
instead of NaI. The collected supernatant was vacuum filtered through PCTE filters, which
175
were placed in a 250 mL flask. Flasks containing the PCTE filters from net tows and beach
176
sand samples were stored at 60 °C during 24 h for desiccation. The H2O2 digestion, staining
177
and imaging was performed as described above.
178
Micro-Raman spectroscopy was used to verify the identity of the fluorescing and
179
non-fluorescing particles found on the filters in order to ascertain the specificity of Nile red to
180
only stain particles of synthetic origin. In total, 23 fields (23 × 1.8 mm2) from 6 different filter
181
sections (4 sediment samples, 2 water samples) were imaged as described above. Raman
182
spectra were acquired using an inVia Raman microscope (Renishaw). Raman shifted spectra
183
were recorded using a 442 nm excitation laser in a range of 100 to 3500 waves cm-1 and 10 s
184
exposure time accumulating 20 scans. Particles were bleached during 5 min prior to spectrum
185
acquisition as Nile red fluorescence interfered with the Raman signal. The baselines of
186
Raman spectra were corrected in R (v3.2.3)35 using the peak detection method from the
187
baseline package36 and then normalized.
188
To control for procedural contamination, Milli-Q water was processed in equal
189
conditions as described above for environmental samples. To avoid lab contamination, lab
190
coats were worn during all procedures, slides were washed with acetone, other glassware and
191
filtering devices were thoroughly rinsed with Milli-Q water, pristine plasticware was used
192
(see supplied protocol regarding required precautions during sample handling, such as
avoiding low quality pipette tips; fig S4), and Nile red staining solution was freshly filtered
194
through 0.2 µm filters.
195
196
Data analysis
197
198
Automated quantification of fluorescing particles from tow and blank samples was performed
199
in ImageJ using the macro described above. For each sample type, green fluorescence images
200
(109 total) were randomly taken from 5 different filters. Two power-law models were fitted to
201
the particle size distribution with poweRlaw37 in R. Different xmin values were used to
202
estimate the scaling factor: either (1) the smallest particle present in the dataset or (2) an
203
estimate at which the probability distributions of the particle size distribution and the best-fit
204
power-law were most similar above xmin.38 The latter discards particles below the estimated
205
xmin for which the power-law model is not valid. Testing for other distributions capable of
206
explaining our data was done in accordance with Clauset et al.38 Plotting was performed in R
207
using the package ggplot2.39
208
A detailed protocol and the code for the macro to semi-automatically quantify
209
fluorescent microplastics in ImageJ are available as supplementary materials.
Results 211
212
Validation of the automated Nile red protocol using commercially available plastics
213
Fluorescence assisted counting. Polymers PE, PP, PS, nylon 6, PC, PET, PVC and PUR
214
fluoresced in green after staining with Nile red (fig. 1) demonstrating the utility of Nile red to
215
detect and quantify small microplastics. Tire rubber did not fluoresce (fig. S1 f). Visual
216
quantification can be performed directly under a microscope, but the implementation of a
217
macro to automate counts allows high throughput counting as well as rapid measurement of
218
the plastic particles. Here, fluorescence based automated detection of microplastics on PCTE
219
membranes was 100 % for 4 polymer types (i.e. PE, PP, PS and nylon 6) as all 10 particles of
220
each respective polymer were detected with ImageJ using 29 as the lower threshold for pixel
221
brightness (fig. 1). The other 4 polymers (PUR, PC, PVC and PET) fluoresced weaker and a
222
lower threshold value for pixel brightness (i.e. 9) was required to automatically detect all 10
223
particles (fig. 1).
224
As fluorescence intensity varied with polymer type and thickness, the original setting
225
for the pixel brightness threshold (i.e. 29) in our macro for ImageJ was optimized to capture
226
all particles with strong fluorescence (i.e. PE, PP, PS and nylon 6), and to represent particle
227
size accurately, using brightfield images as size references (figs. 1 & 2). As stated above,
228
100% detection of PUR, PC, PET, and PVC was achieved by lowering the threshold value for
229
pixel brightness. However, the adoption of the lower threshold (1) overestimated the size of
230
more strongly fluorescing particles (i.e. PE, PP, PS and nylon 6 in fig. 2), (2) counted strongly
231
fluorescent particles in very close proximity as one unique particle, and (3) so increased the
232
risk of false positives (i.e. chitin in fig. 1; discussed below).
233
234
Implementation of the fluorescent-staining protocol to environmental samples
235
236
Digestion of biogenic material. Wood lignin fluoresces green and red when stained with Nile
237
red (fig. S2 a). However, particles of this natural polymer, which are below 1 mm in size,
were completely eliminated after applying a 7-hour H2O2 digestion protocol (fig. S2 b). As
239
with wood lignin, chitin also fluoresces in green and red when stained with Nile red (fig S2
240
c), but was not completely removed during the 7 hour H2O2 treatment. Interestingly, after
241
digestion, chitin showed a strong decrease in green fluorescence intensity (but not red
242
fluorescence; fig. S2 d), possibly due to reduced hydrophobicity in response to oxidation. To
243
test whether chitin would interfere with the detection and quantification of synthetic polymers
244
in the green spectrum, we performed our protocol on a mix of chitin and PE. A stark
245
distinction between PE particles and chitin was observed (fig S2 e–g) as the weak
246
fluorescence given by chitin did not interfere when using our highly stringent macro settings
247
(pixel brightness of 29), but chitin is detected to some extent when the settings are brought
248
down (pixel brightness 9). This result highlights two issues that need to be considered when
249
using this protocol: (1) Nile red strongly fluoresces under the GFP settings when staining
250
highly hydrophobic plastics (such as PE, PP, PS) and, hence, green fluorescence should be
251
used to eliminate background and inclusion of natural contaminants; and (2) reducing the
252
sensitivity for the detection of less hydrophobic plastics (e.g. PC, PVC, PUR and PET) can
253
come with a risk of including the detection of particles of natural origin.
254
255
Detection and quantification of microplastics in environmental samples. Here we isolated
256
microplastics from environmental samples (i.e. beach sediment and sea surface) with
257
saturated NaCl solutions and, hence, expected to extract plastics with densities ≤1.2 g/cm3
258
(e.g. PE, PP, PS and nylon 6). We applied our Nile red staining protocol to discriminate small
259
microplastic particles from other materials based on fluorescence (fig. 3) as well as to
260
quantify and measure them. The automated ImageJ quantification of microplastics from the
261
sea surface samples using stringent settings resulted in a total of 199 fluorescent particles,
262
ranging between 20 – 338 µm in size (i.e. particle size was obtained from the square root of
263
the area measured for each individual particle; fig. 4). Neither of the power-law models
264
describing the data could be dismissed (px.min = 20.02 = 0.72 and px.min = 101.76 = 0.85). The particle
265
size distribution followed a power-law more closely for particles >101 µm, than if all data
were used, i.e. the smallest particle size = 20 µm (see table S1 for statistical details). The
267
calculated scaling factors were 2.13 for xmin = 20.02 and 4.42 for xmin = 101.76.
268
Only one fluorescent particle was detected in our negative controls (i.e. processed
269
Milli-Q water) demonstrating that laboratory contamination was minimal. It is of uttermost
270
importance to include controls in order to assess the contamination acquired during the
271
processing of samples.
272
For this protocol to be effectively applied to environmental samples we realise it is
273
critical that only plastic particles should fluoresce and, hence, be quantified with the
semi-274
automated process. Consequently, we scanned via Raman spectroscopy a total of 60
275
fluorescing and non-fluorescing particles and found that all of the fluorescing particles (n =
276
37) were of synthetic origin, while all non-fluorescing particles (n = 23) gave non-plastic
277
Raman signatures (e.g. fig. 3). The environmental samples predominantly contained PP-type
278
polymers (83.8%), although PE was also found (16.2%). The Raman spectra of the PP and PE
279
particles contained slight variations in peak structure (fig. S5), which can occur in
280
commercial polymer materials due to the inclusion of additional compounds and pigments or
281
as a consequence of environmental weathering.40
Discussion 283
284
We present a fast, reliable and cost-effective method for detecting, quantifying and
285
determining the size of small PE-, PP-, PS- and nylon 6 type microplastics (20 µm – 1 mm)
286
commonly present in sea surface samples.10,11,41 This method uses the lipophilic dye Nile red
287
to fluorescently label plastics and requires fluorescence microscopy to capture images at
288
magnification 10× prior to automated, image-based quantification in ImageJ using a macro
289
(both protocol and macro are provided as supplementary information) enabling high
290
throughput image analysis. Specific protocols for collecting and extracting microplastics from
291
the environment were not in the scope of this work.
292
During the preparation of this manuscript, two studies were published28,42 that
293
reasserted our findings, demonstrating the effectiveness of Nile red to fluorescently label
294
different types of commercially available synthetic polymers, such as the ones employed here,
295
all of which fluoresce in the green spectrum (black rubber was not used in these previous
296
studies and we show here that it does not fluoresce). Indeed, similarly to us, Shim et al.28
297
concluded that green-yellow fluorescence (excitation/emission 450–490/515–565 nm)
298
provided better particle recognition than red or blue fluorescence. Using a different light and
299
filter set-up, Maes et al.42 reported good fluorescence at longer wavelengths ranging from
300
yellow to orange, depending on the polymer type. Such findings agree with previous reports
301
about the behaviour of Nile red, which favours detection of strongly hydrophobic samples at
302
short excitation/emission wavelengths (450–500/≤580 nm) compared to more neutral lipids,
303
which should ideally be visualised at longer excitation wavelengths (i.e. red, 515–560/≥590
304
nm).30 For example, given that PE and PP are more hydrophobic than PET,43 it is expected
305
that the former will fluoresce more intensely at shorter wavelengths (i.e. green), while their
306
fluorescence at longer wavelengths remains weak or even absent as we show in figure S1. We
307
are therefore confident that the Nile red protocol we propose here is effective in detecting
308
strongly hydrophobic plastics such as PE, PP, PS and nylon 6 through the use of GFP settings
309
(green fluorescence), while preventing detection of contaminants, that would fluoresce at
longer wavelengths. We acknowledge the protocol’s limitations for the less hydrophobic
311
polymers PC, PUR, PET and PVC, which constituted about 25% of the European plastic
312
demand in 2015.9 These limitations can to some extent be overcome as suggested in the
313
results section by increasing the sensitivity of the method (fig. 1), but this comes at a risk of
314
overestimating the size of strongly fluorescent polymers (fig. 2) as well as incurring the
315
possibility of false positives, such as chitin. It is also worth highlighting that all polymer types
316
that fluoresced weakly in our study when stained with Nile red (PC, PUR, PET, PVC) are
317
denser (≥1.2 g/cm3) than the polymers that fluoresced more strongly (PE, PP, PS, nylon 6,
318
<1.08 g/cm3). Hence, the latter can be extracted using a saturated NaCl solution as done in
319
this study, while denser polymers would require a higher density salt solution (e.g. NaI).
320
The successful application of a Nile red protocol to environmental samples relies on
321
the efficient removal of biogenic particles that could be detected as false positives. As we
322
show here, abundant natural polymers such as chitin and wood lignin fluoresced when stained
323
with Nile red (fig. S2 a, c). Shim et al.28 remained cautious on applying Nile red to quantify
324
microplastics in environmental samples due to the risk of co-staining undigested biogenic
325
material. We speculate that the problem they encountered resided in the weak digestion
326
treatment they applied on their beach samples (i.e.soaking the filters with 35% H2O2), which
327
resulted in biogenic debris such as an amphipod carapace and plant parts still being present.
328
In turn, Shim et al.28 reported less such contamination for the neuston net samples, which
329
were digested with the more aggressive Fenton reagent (including heating to 75°C). Hence, a
330
harsh digestion protocol such as the one we used here and which was previously suggested by
331
Claessens et al.31, is required to prevent co-staining of natural organic polymers and
332
confidently quantify Nile red-stained microplastics in environmental samples. Common
333
plastics such as PE, PP, PS, PET and nylon 6 are resistant to H2O2, as demonstrated by Tagg
334
et al.32 during a 7-day exposure experiment, where no significant chemical changes were
335
detected via FTIR, as opposed to alterations observed elsewhere that were induced by
336
solvents such as acids and bases (e.g. HCl or NaOH).34,44 In addition to the H2O2 digestion, we
337
propose to include a 1 mm mesh-size sieving step prior to the digestion to prevent the
inclusion of larger, hard-to-digest natural contaminants, such as amphipods or pieces of
339
wood. If required, enzymatic digestion protocols could be implemented to digest biota-rich
340
environmental samples.4,44 Indeed, sample purification may further be optimized by
341
combining digestion procedures with a density separation protocol, such as presented by
342
Maes et al.42 Nevertheless, our results show how the 30% H2O2 digestion step used here was
343
effective at preventing detection of small natural polymers (below 1 mm in size); wood lignin
344
was completely degraded and chitin was no longer was detectable in ImageJ using green
345
fluorescence images (fig S2). Furthermore, we successfully proved that all of the fluorescing
346
particles from environmental samples assessed with micro-Raman spectroscopy (n = 37) were
347
identified as synthetic plastic materials, whereas no non-fluorescing particles scanned (n =
348
23) showed a synthetic polymer signature.
349
Other semi-automatable methods to detect and quantify small microplastics in
350
environmental samples were recently developed:32,45,46
351
Chemical mapping via micro-FTIR was shown useful to detect and identify small
352
microplastics directly on filters when combined with FPA detectors;32,45 FPA detectors can
353
record several thousand spectra simultaneously and plastics are then identified based on
354
characteristic bands that are shared by synthetic polymers. However, access to such
355
specialised pieces of equipment is not always possible, and the time required to image a
356
whole filter membrane (10.75 h for a 25 mm diameter filter)45 is significantly higher than
357
when using the method in the present study i.e. 20 min.
358
A second semi-automatable approach used to detect small microplastics from
359
environmental samples combined Micro-Raman spectroscopy with particle finding
360
software.46 The software provides geographical positions of the particles on a slide, and the
361
particles are then scanned individually via a motorised stage. However, Frère et al.46 did not
362
apply this technique directly to the sample filter (such as in this study and others32,45). Instead,
363
particles were visually pre-selected under a dissection microscope and then transferred onto a
364
gold-coated microscope slide. It is therefore not yet clear whether this technique is also
365
applicable to quantify small microplastics without potentially introducing visual bias.
While our Nile red staining method does not provide the chemical identity of the
367
detected plastic particles (as achieved via FTIR and Raman), we present it as a sensitive,
cost-368
effective and unbiased way of quantifying and measuring small PE, PP, PS and Nylon 6
369
particles in environmental sample preparations to acquire large datasets with high statistical
370
value. Ultimately, a fraction of pinpointed plastic particles should be identified via
micro-371
Raman spectroscopy to obtain information on the diversity of polymer types within a sample.
372
Moreover, despite having tested the most common potential natural contaminants, we
373
advocate the use of micro-Raman spectroscopy on subsamples until full reliability of the
374
method presented here has been evaluated.
375
Micro-Raman spectroscopy of plastic particles detected with Nile red showed that PP
376
microparticles were more prevalent (83.8%) in our environmental samples than PE (16.2%).
377
This is notable as PE is the most commonly produced polymer type47 and literature highlights
378
PE as the most abundant polymer on sea surfaces.48 A recent study, however, found that this
379
is only the case for large microplastics (>1 mm), as the smaller analysed size fraction (0.335 –
380
1 mm) was dominated by PP (42%) rather than PE (26%).46 Furthermore, the authors reported
381
a lack of PS in size classes below <2 mm,46 which resembles our findings. Curiously, PS was
382
present in the fraction retained by the 1 mm sieve (fig. S3) but not found among particles
383
assessed with Raman. Several non-exclusive hypotheses may explain these findings. For
384
instance, fragmentation behaviours may differ with polymer type and shape. Particles have
385
also been observed to adhere to organic matter, such as marine snow, and sink.49,50 It is
386
unclear, however, why small PE particles would more likely be incorporated into marine
387
snow than PP particles, and further research is required to shed light on this interesting
388
phenomenon.
389
Plastics in the environment are known to progressively fragment into smaller
390
particles.2 Based on the fragmentation pattern of three dimensional objects, it could be
391
expected that the abundance of microplastic particles increases following a power-law with a
392
factor of 3 as size decreases.5 Contrary to this assumption, Cózar et al.5 reported an intriguing
393
loss in abundance of small microplastics after carrying out a global survey of sea surface
marine plastic debris. The expected correlation between size and fragment abundance was
395
observed down to a particle size of 2 mm but, surprisingly, the abundance of microplastics
396
sharply decreased for particles below 1 mm in size. This supported speculation regarding the
397
substantial ‘missing’ fraction of marine plastic debris initiated in 2004,14 and recently
398
reviewed by Eriksen et al.51 We believe that the extremely low incidence of small
399
microplastics reported by Cózar et al.5 may partly be ascribed to the methods employed in
400
identifying and selecting particles, which were based on visual sorting under a dissecting
401
microscope. In fact, in a study whose findings mirrored our own, Enders et al.52 showed that
402
small microplastics were indeed present in surface waters with increasing abundance as size
403
decreased, and obtained a scaling factor of 1.96 for the size range of 10 – 110 µm, close to
404
one obtained in this study (i.e. scaling factor of 2.13). Further research is nevertheless
405
required, as very little is known about the fragmentation pattern and particle behaviour of
406
different polymer types in the marine environment.53
407
Here we suggest the use of a highly sensitive Nile red fluorescent staining method for
408
identifying the smaller size range of lower density microplastics (<1 mm) commonly present
409
in sea surface samples (i.e. PE, PP, PS and nylon 6). We acknowledge its limitations, but do
410
not exclude its application, for less hydrophobic polymer types, a separation that coincides
411
with higher polymer densities (>1.2 g/cm3; fig. 1). Using this time- and cost-effective
412
protocol to quantify and measure small microplastics allowed us to confirm that small
413
microplastics are increasingly abundant with decreasing particle size in sea surface samples
414
(fig. 4). This method therefore addresses the quantification uncertainties and provides an
415
effective tool for rapid quantification of small microplastics by substituting the visual
416
selection and quantification process with an automated process.
417
418
Supporting Information 419
Five figures (green and red fluorescence, Nile red stained natural polymers, microplastics >1
420
mm, contamination control, example Raman spectra of microplastics from environmental
samples), one table with statistical details, a sample preparation protocol and the code for the
422
ImageJ script used to quantify fluorescent microplastic particles; all as noted in the text
423
Acknowledgements 426
This work was supported by the NERC Independent Research Fellowship NE/K009044/1.
427
The microscope facility was provided by WISB, which is a BBSRC/EPSRC Synthetic
428
Biology Research Centre (grant ref.: BB/M017982/1) funded under the UK Research
429
Councils' Synthetic Biology for Growth programme. Gabriel Erni Cassola was supported by a
430
NERC CENTA PhD studentship. We thank skipper Richard Ticehurst (Plymouth University)
431
for his help and expertise during field work. Special thanks go to Vinko Zadjelovic and
432
Robyn Wright for providing input throughout the study. The authors declare no conflict of
433
interest.
434 435
Author contributions 436
G.E.C., J.C.-O. and M.I.G. conceived the study. G.E.C. designed and conducted the
437
experimental work. R.C.T. provided expertise and advice on fieldwork, microplastic
438
identification and gave access to the facilities. G.E.C. and J.C.-O. analysed the data and wrote
439
the paper. M.I.G. and R.C.T. provided their expertise and reviewed the manuscript.
References 441
(1) Jambeck, J. R.; Geyer, R.; Wilcox, C.; Siegler, T. R.; Perryman, M.; Andrady, A.;
442
Narayan, R.; Law, K. L. Plastic waste inputs from land into ocean. Science (80-. ).
443
2015, 347 (6223), 768–771.
444
(2) Barnes, D. K. A.; Galgani, F.; Thompson, R. C.; Barlaz, M. Accumulation and
445
fragmentation of plastic debris in global environments. Phil. Trans. R. Soc. B2009,
446
364, 1985–1998.
447
(3) Wright, S. L.; Thompson, R. C.; Galloway, T. S. The physical impacts of
448
microplastics on marine organisms: A review. Environ. Pollut.2013, 178, 483–492.
449
(4) Mani, T.; Hauk, A.; Walter, U.; Burkhardt-Holm, P. Microplastics profile along the
450
Rhine River. Sci. Rep.2015, 5, 17988.
451
(5) Cózar, A.; Echevarría, F.; González-Gordillo, J. I.; Irigoien, X.; Ubeda, B.;
452
Hernández-León, S.; Palma, A. T.; Navarro, S.; García-de-Lomas, J.; Ruiz, A.; et al.
453
Plastic debris in the open ocean. PNAS2014, 111, 10239–10244.
454
(6) Woodall, L. C.; Sanchez-Vidal, A.; Canals, M.; Paterson, G. L. J.; Coppock, R.;
455
Sleight, V.; Calafat, A.; Rogers, A. D.; Narayanaswamy, B. E.; Thompson, R. C. The
456
deep sea is a major sink for microplastic debris. R. Soc. Open Sci.2014, 1 (4), 140317.
457
(7) Claessens, M.; Meester, S. De; Landuyt, L. Van; Clerck, K. De; Janssen, C. R.
458
Occurrence and distribution of microplastics in marine sediments along the Belgian
459
coast. Mar. Pollut. Bull.2011, 62 (10), 2199–2204.
460
(8) Pedrotti, M. L.; Petit, S.; Elineau, A.; Bruzaud, S.; Crebassa, J.-C.; Dumontet, B.;
461
Martí, E.; Gorsky, G.; Cózar, A. Changes in the Floating Plastic Pollution of the
462
Mediterranean Sea in Relation to the Distance to Land. PLoS One2016, 11 (8),
463
e0161581.
464
(9) PlasticsEurope. Plastic - the facts 2016. Brussels2016.
465
(10) Suaria, G.; Avio, C. G.; Mineo, A.; Lattin, G. L.; Magaldi, M. G.; Belmonte, G.;
466
Moore, C. J.; Regoli, F.; Aliani, S. The Mediterranean Plastic Soup: synthetic
467
polymers in Mediterranean surface waters. Sci. Rep.2016, 6, 37551.
468
(11) Gajšt, T.; Bizjak, T.; Palatinus, A.; Liubartseva, S.; Kržan, A. Sea surface
469
microplastics in Slovenian part of the Northern Adriatic. Mar. Pollut. Bull.2016, 113,
470
392–399.
471
(12) Eriksen, M.; Lebreton, L. C. M.; Carson, H. S.; Thiel, M.; Moore, C. J.; Borerro, J. C.;
472
Galgani, F.; Ryan, P. G.; Reisser, J. Plastic Pollution in the World’s Oceans: More
473
than 5 Trillion Plastic Pieces Weighing over 250,000 Tons Afloat at Sea. PLoS One
474
2014, 9 (12), e111913.
475
(13) Cózar, A.; Sanz-Martín, M.; Martí, E.; González-Gordillo, J. I.; Ubeda, B.; Gálvez, J.
476
Á.; Irigoien, X.; Duarte, C. M. Plastic Accumulation in the Mediterranean Sea. PLoS
477
One2015, 10 (4), e0121762.
478
(14) Thompson, R. C.; Olsen, Y.; Mitchell, R. P.; Davis, A.; Rowland, S. J.; John, A. W.
479
G.; McGonigle, D.; Russell, A. E. Lost at sea: where is all the plastic? Science (80-. ).
480
2004, 304 (5672), 838.
481
(15) Moore, C. J. Synthetic polymers in the marine environment: A rapidly increasing,
482
long-term threat. Environ. Res.2008, 108, 131–139.
483
(16) Browne, M. A.; Crump, P.; Niven, S. J.; Teuten, E.; Tonkin, A.; Galloway, T.;
484
Thompson, R. Accumulation of microplastic on shorelines woldwide: Sources and
485
sinks. Environ. Sci. Technol.2011, 45 (21), 9175–9179.
486
(17) Corcoran, P. L.; Biesinger, M. C.; Grifi, M. Plastics and beaches: A degrading
487
relationship. Mar. Pollut. Bull.2009, 58 (1), 80–84.
488
(18) Andrady, A. L. Microplastics in the marine environment. Mar. Pollut. Bull.2011, 62
489
(8), 1596–1605.
490
(19) Morét-Ferguson, S.; Lavender, K.; Proskurowski, G.; Murphy, E. K.; Peacock, E. E.;
491
Reddy, C. M. The size, mass, and composition of plastic debris in the western North
492
Atlantic Ocean. Mar. Pollut. Bull.2010, 60, 1873–1878.
493
(20) Setälä, O.; Fleming-Lehtinen, V.; Lehtiniemi, M. Ingestion and transfer of
494
microplastics in the planktonic food web. Environ. Pollut.2014, 185, 77–83.
(21) Watts, A. J. R.; Lewis, C.; Goodhead, R. M.; Beckett, S. J.; Moger, J.; Tyler, C. R.;
496
Galloway, T. S. Uptake and Retention of Microplastics by the Shore Crab Carcinus
497
maenas. Environ. Sci. Technol.2014, 48 (15), 8823–8830.
498
(22) Teuten, E. L.; Saquing, J. M.; Knappe, D. R. U.; Barlaz, M. A.; Jonsson, S.; Björn, A.;
499
Rowland, S. J.; Thompson, R. C.; Galloway, T. S.; Yamashita, R.; et al. Transport and
500
release of chemicals from plastics to the environment and to wildlife. Philos. Trans. R.
501
Soc. B2009, 364, 2027–2045.
502
(23) Rochman, C. M.; Kross, S. M.; Armstrong, J. B.; Bogan, M. T.; Darling, E. S.; Green,
503
S. J.; Smyth, A. R.; Veríssimo, D. Scientific Evidence Supports a Ban on Microbeads.
504
Environ. Sci. Technol.2015, 49 (18), 10759–10761.
505
(24) Hanke, G.; Galgani, F.; Werner, S.; Oosterbaan, L.; Nilsson, P.; Fleet, D.; Kinsey, S.;
506
Thompson, R.; Palatinus, A.; Franeker, J. A. Van; et al. MSFD GES technical
507
subgroup on marine litter. Guidance on monitoring of marine litter in European Seas.;
508
Luxembourg, 2013.
509
(25) Hidalgo-Ruz, V.; Gutow, L.; Thompson, R. C.; Thiel, M. Microplastics in the Marine
510
Environment: A Review of the Methods Used for Identification and Quantification.
511
Environ. Sci. Technol.2012, 46, 3060−3075.
512
(26) Lavers, J. L.; Oppel, S.; Bond, A. L. Factors influencing the detection of beach plastic
513
debris. Mar. Environ. Res.2016, 119, 245–251.
514
(27) Andrady, A. L. Using flow cytometry to detect micro- and nano-scale polymer
515
particles. In Proceedings of the Second Research Workshop on Microplastic Debris.;
516
Arthur, C., Baker, J., Eds.; NOAA Technical Memorandum NOS-OR&R-39., 2010.
517
(28) Shim, W. J.; Song, Y. K.; Hong, S. H.; Jang, M. Identification and quantification of
518
microplastics using Nile Red staining. Mar. Pollut. Bull.2016, 113, 469–476.
519
(29) Cole, M. A novel method for preparing microplastic fibers. Sci. Rep.2016, 6, 34519.
520
(30) Rumin, J.; Bonnefond, H.; Saint-Jean, B.; Rouxel, C.; Sciandra, A.; Bernard, O.;
521
Cadoret, J.-P.; Bougaran, G. The use of fluorescent Nile red and BODIPY for lipid
522
measurement in microalgae. Biotechnol. Biofuels2015, 8, 42.
523
(31) Claessens, M.; Van Cauwenberghe, L.; Vandegehuchte, M. B.; Janssen, C. R. New
524
techniques for the detection of microplastics in sediments and field collected
525
organisms. Mar. Pollut. Bull.2013, 70 (1–2), 227–233.
526
(32) Tagg, A. S.; Sapp, M.; Harrison, J. P.; Ojeda, J. J. Identification and Quantification of
527
Microplastics in Wastewater Using Focal Plane Array-Based Reflectance
Micro-FT-528
IR Imaging. Anal. Chem.2015, 87 (12), 6032–6040.
529
(33) Zimmermann, W.; Paterson, A.; Broda, P. Preparation of Milled Straw Lignin from
530
Barley. Methods Enzymol.1988, 161, 191–199.
531
(34) Nuelle, M.-T.; Dekiff, J. H.; Remy, D.; Fries, E. A new analytical approach for
532
monitoring microplastics in marine sediments. Environ. Pollut.2014, 184, 161–169.
533
(35) Team, R. C. R Core Team 2015 R: A language and environment for statistical
534
computing. R foundation for statistical computing. 2015, 2014.
535
(36) Liland, K. H.; Mevik, B.-H.; Canteri, R. baseline: Baseline Correction of Spectra.
536
2015.
537
(37) Gillespie, C. S. Fitting heavy tailed distributions: the poweRlaw package. J. Stat.
538
Softw.2015, 64 (2), 1–16.
539
(38) Clauset, A.; Shalizi, C. R.; Newman, M. E. J. Power-Law distributions in empirical
540
data. Soc. Ind. Appl. Math.2009, 51 (4), 661–703.
541
(39) Wickham, H. ggplot2; Gentleman, R., Hornik, K., Parmigiani, G., Eds.; Springer,
542
2009.
543
(40) Lenz, R.; Enders, K.; Stedmon, C. A.; Mackenzie, D. M. A.; Gissel, T. A critical
544
assessment of visual identification of marine microplastic using Raman spectroscopy
545
for analysis improvement. Mar. Pollut. Bull.2015, 100 (1), 82–91.
546
(41) Ballent, A.; Corcoran, P. L.; Madden, O.; Helm, P. A.; Longstaffe, F. J. Sources and
547
sinks of microplastics in Canadian Lake Ontario nearshore, tributary and beach
548
sediments. Mar. Pollut. Bull.2016, 110 (1), 383–395.
549
(42) Maes, T.; Jessop, R.; Wellner, N.; Haupt, K.; Mayes, A. G. A rapid-screening
approach to detect and quantify microplastics based on fluorescent tagging with Nile
551
Red. Sci. Rep.2017, 7, 44501.
552
(43) Dodbiba, G.; Haruki, N.; Shibayama, A.; Miyazaki, T.; Fujita, T. Combination of
553
sink–float separation and flotation technique for purification of shredded PET-bottle
554
from PE or PP flakes. Int. J. Miner. Process.2002, 65, 11–29.
555
(44) Cole, M.; Webb, H.; Lindeque, P. K.; Fileman, E. S.; Halsband, C.; Galloway, T. S.
556
Isolation of microplastics in biota-rich seawater samples and marine organisms. Sci.
557
Rep.2014, 4, 4528.
558
(45) Löder, M. G. J.; Kuczera, M.; Mintenig, S.; Lorenz, C.; Gerdts, G. Focal plane array
559
detector-based micro-Fourier-transform infrared imaging for the analysis of
560
microplastics in environmental samples. Environ. Chem.2015, 12 (5), 563–581.
561
(46) Frère, L.; Paul-Pont, I.; Moreau, J.; Soudant, P.; Lambert, C.; Huvet, A.; Rinnert, E. A
562
semi-automated Raman micro-spectroscopy method for morphological and chemical
563
characterizations of microplastic litter. Mar. Pollut. Bull.2016, 113 (1–2), 461–468.
564
(47) PlasticsEurope. Plastics - the facts 2015; Brussels, 2015.
565
(48) Phuong, N. N.; Zalouk-Vergnoux, A.; Poirier, L.; Kamari, A.; Châtel, A.; Mouneyrac,
566
C.; Lagarde, F. Is there any consistency between the microplastics found in the field
567
and those used in laboratory experiments? Environ. Pollut.2016, 211, 111–123.
568
(49) Long, M.; Moriceau, B.; Gallinari, M.; Lambert, C.; Huvet, A.; Raffray, J.; Soudant,
569
P. Interactions between microplastics and phytoplankton aggregates: Impact on their
570
respective fates. Mar. Chem.2015, 175, 39–46.
571
(50) Zhao, S.; Danley, M.; Ward, J. E.; Mincer, T. J. An approach for extraction,
572
characterization and quantitation of microplastic in natural marine snow using Raman
573
microscopy. Anal. Methods2017, 9, 1470–1478.
574
(51) Eriksen, M.; Thiel, M.; Lebreton, L. Nature of Plastic Marine Pollution in the
575
Subtropical Gyres. In The Handbook of Environmental Chemistry; Takada, H.,
576
Karapanagioti, H. K., Eds.; Springer Berlin Heidelberg, 2016; pp 1–28.
577
(52) Enders, K.; Lenz, R.; Stedmon, C. A.; Nielsen, T. G. Abundance, size and polymer
578
composition of marine microplastics ≥ 10 µ m in the Atlantic Ocean and their
579
modelled vertical distribution. Mar. Pollut. Bull.2015, 100, 70–81.
580
(53) Filella, M. Questions of size and numbers in environmental research on microplastics:
581
Methodological and conceptual aspects. Environ. Chem.2015, 12 (5), 527–538.
582
Figure 1. Microscope and ImageJ images of microparticles of different polymer types on PCTE filter membranes stained with Nile red. For each polymer, images show from left to right: a particle in brightfield,
the same particle in green fluorescence (excitation/emission 460/525 nm), ImageJ rendition with stringent settings (setting 29) and ImageJ rendition with more sensitive settings (setting 9). Ratios in ImageJ renditions indicate the number of particles (n = 10) detected with the respective setting and polymer; ND:
not determined. Polymers are in descending order in accordance with increasing specific density (g/cm3), indicated below polymer name; PP: polypropylene, PE: polyethylene, PS: polystyrene, PC: polycarbonate,
PUR: polyurethane, PET: poly(ethylene terephthalate), PVC: poly(vinyl carbonate). Scale = 50 µm.
Figure 2. Mean size (± SE) comparison of microplastic particle (n = 10 per polymer type) size measured in ImageJ using either brightfield images or green fluorescence images with our script. Note: stringent represents sizes measured with 29 as the lower threshold for pixel brightness and higher sensitivity corresponds to measurements generated with 9 as the lower threshold for pixel brightness. Size corresponds
to the square root of particle area.
Figure 3. Microscope images of processed sand samples demonstrating selective Nile red fluorescent staining of synthetic polymers with Raman spectra of scanned particles. (a) Composite image of excitation/emission
460/525 nm and brightfield. Asterisks indicate particles assessed via Raman-spectroscopy. (b) Normalised Raman spectra obtained from particles highlighted in image b. r: PP (Sigma-Aldrich) spectrum; f: typical spectrum of fluorescent particle in image b; nf: typical spectrum of non-fluorescing particle in image b. (c)
Field shown in panel (a) using green fluorescence only. (d) ImageJ drawing depicting particles >400 µm2 that were quantified via our macro.
Figure 4. Relative abundance of microplastic particle sizes (np = 199) from all sea surface samples analysed via automated counting of fluorescent particles using 109 different microscope fields (one image shown as
example). Size corresponds to the square root of the particle’s area.