1
Improving Patient Experience in
Primary Care: a multi-method
programme of research on the
measurement and improvement of
patient experience
Martin Roland and John Campbell
Co-Chief Investigators
Jenni Burt
Programme Manager
Gary Abel, Ahmed Aboulghate, Faraz Ahmed, Anthea Asprey, Heather Barry,
Julia Beckwith, John Benson, Olga Boiko, Pete Bower, Raff Calitri, Mary Carter,
Antoinette Davey, Marc N. Elliott, Natasha Elmore, Conor Farrington, Hena
Wali Haque, William Henley, Val Lattimer, Nadia Llanwarne, Cathy Lloyd,
Georgios Lyratzopoulos, Inocencio Maramba, Luke Mounce, Jenny Newbould,
Charlotte Paddison, Richard Parker, Suzanne Richards, Martin Roberts, Claude
Setodji, Jonathan Silverman, Fiona Warren, Ed Wilson, Christine Wright
2
Improving Patient Experience in Primary Care:
a multi-method programme of research on the
measurement and improvement of patient experience
Martin Roland*
1, John Campbell
2, Jenni Burt
1,
Gary Abel
1&2, Ahmed
Aboulghate
1, Faraz Ahmed
1, Anthea Asprey
2, Heather Barry
2, Julia Beckwith
1, John Benson
3, Olga Boiko
2, Pete Bower
4,Raff Calitri
2, Mary Carter
2,
Antoinette Davey
2,
Marc N. Elliott
5, Natasha Elmore
1, Conor Farrington
1,
Hena Wali Haque
1, William Henley
2, Val Lattimer
6, Nadia Llanwarne
1, Cathy
Lloyd
7, Georgios Lyratzopoulos
1, Inocencio Maramba
2, Luke Mounce
2, Jenny
Newbould
1, Charlotte Paddison
1, Richard Parker
3, Suzanne Richards
2, Martin
Roberts
2, Claude Setodji
5, Jonathan Silverman
8, Fiona Warren
2, Ed Wilson
1,
Christine Wright
21 Cambridge Centre for Health Services Research, Institute of Public Health, Forvie Site, University of Cambridge School of Clinical Medicine, Cambridge, CB2 0SR, United Kingdom 2 University of Exeter Medical School, Smeall Building, St Luke's Campus, Exeter, EX1 2LU, United Kingdom
3 Primary Care Unit, Institute of Public Health, Forvie Site, University of Cambridge School of Clinical Medicine, Cambridge, CB2 0SR, United Kingdom
4 NIHR School for Primary Care Research, Manchester Academic Health Science Centre, University of Manchester, Williamson Building, Oxford Road, Manchester, M13 9PL, United Kingdom
5 RAND Corporation, 1776 Main Street, PO Box 2138, Santa Monica, CA 90407-2138, USA 6School of Health Sciences, UEA, Norwich Research Park, Norwich, NR4 7TJ, United Kingdom 7 Faculty of Health & Social Care, The Open University, Walton Hall, Milton Keynes, MK7 6AA, United Kingdom
8 University of Cambridge Medical School, Cambridge, CB2 0SR, United Kingdom
*Corresponding author
Declared competing interests of authors: Professor Roland and Professor Campbell have acted as advisors to Ipsos MORI, the Department of Health, and subsequently NHS England on the development of the English GP Patient Survey. Pete Bower has received NIHR funding additional to the programme grant. No other authors have any competing interests to declare.
3
Abstract
Our research aimed to better understand how different patients use surveys to record experiences of general practice; how primary care staff respond to feedback; and how to engage them in responding to feedback. We used methods including quantitative survey analyses, focus groups, interviews, an exploratory trial and an experimental vignette study.
1. Understanding patient experience data
Patients readily criticised their care when reviewing consultations on video, though were reluctant to be critical when completing questionnaires. When trained raters judged
communication within a consultation to be poor, a substantial proportion of patients rated the doctor as ‘good’ or ‘very good’. Absolute scores on questionnaire surveys should be treated with caution: they may present an over-optimistic view of GP care. However, relative rankings to identify GPs who are better or poorer at communicating may be acceptable, as long as statistically reliable figures are obtained. Most patients have a particular GP whom they prefer to see: however, up to 40% of people who have such a preference are unable regularly to see the doctor of their choice. Users of out-of-hours care reported worse experiences where the service was run by a commercial provider compared with not-for profit or NHS providers.
2. Understanding patient experience in minority ethnic groups
4
3. Using patient experience data
We found that measuring how GP-patient communication at practice level masks variation between how good individual doctors are within a practice. In general practices and out-of-hours centres, staff were sceptical about the value of patient surveys and their ability to support service reconfiguration and quality improvement. In both settings, surveys were deemed necessary, but not sufficient. Staff expressed a preference for free-text comments as they provided more tangible, actionable data.
An exploratory trial of real-time feedback (RTF) found that only 2.5% of consulting patients left feedback using touchscreens in the waiting room, though more did when reminded by staff: the representativeness of responding patients remains to be evaluated. Staff were broadly positive about using RTF and practices valued the ability to include their own questions. Staff benefitted from having a facilitated session and protected time to discuss patient feedback.
Limitations
Practice recruitment for our in-hours studies took place in two broad geographical areas which may not be fully representative of practices nationally. Our focus was on patient experience in primary care: secondary care settings may face different challenges in implementing quality improvement initiatives driven by patient feedback.
Future work
Recommendations for future research include consideration of alternative feedback methods to better support patients to identify poor care; investigation into the factors driving poorer experience of communication in South Asian patient groups; further investigation of how best to deliver patient feedback to clinicians to engage them and to foster quality improvement; and further research to support the development and implementation of interventions aiming to improve care where deficiencies in patient experience of care are identified.
Funding
5
Contents
List of Tables ... 13
List of Figures ... 17
List of Boxes ... 19
List of Abbreviations ... 20
Plain English Summary ... 22
Scientific Summary ... 23
Chapter 1. Introduction to the Improve Programme ... 30
Context ... 30
Experience and satisfaction ... 32
Patient experience matters ... 33
Capturing patient experience of care ... 34
The content of primary care surveys of patient experience ... 36
Out-of-hours services ... 37
Measuring patient experience of care ... 37
Patient’s varying experiences of care ... 38
Using patient survey data to improve care ... 40
Summary ... 42
Aims of the programme... 43
1. Understanding patient experience data ... 44
2. Understanding patient experience in minority ethnic groups ... 46
3. Using data on patient experience for quality improvement ... 46
Patient and Public involvement ... 46
SECTION A. Understanding patient experience data... 50
Chapter 2. How do patients respond to communication items on patient
experience questionnaires? Video elicitation interviews with patients ... 51
Abstract ... 51
Introduction and rationale for the study... 52
Changes to study methods from original protocol ... 52
Methods... 54
Recruitment of GP practices ... 54
Recruitment of patients and recording of consultations ... 54
Video elicitation interviews and analysis ... 55
6
Participant recruitment ... 57
Video elicitation interviews ... 59
Questionnaire completion ... 59
Disconnect between the ‘tick and the talk’ ... 60
Factors which influence patients’ reluctance to criticise on the questionnaire... 63
Additional interviews with South Asian respondents ... 67
Discussion ... 70
Strengths and limitations ... 71
Conclusions ... 72
Chapter 3. The association between patients’, raters’ and GPs’ assessment
of communication in a consultation ... 73
Abstract ... 73
Introduction and rationale for the study... 74
Changes to study methods from original protocol ... 75
Methods... 76
Ratings by trained external raters ... 77
Statistical analyses ... 78
Results... 80
Reliability of GCRS scores ... 82
The association between patient scores and trained clinical raters’ scores ... 83
The association between GP scores and trained clinical raters’ scores ... 85
The association between GP scores and patient scores ... 86
Discussion ... 88
Strengths and limitations ... 90
Conclusions ... 92
Chapter 4. Ability of patients to see the clinician of their choice ... 93
Abstract ... 93
Introduction and rationale for the study ... 94
Methods ... 95
Analysis 1 ... 95
Analysis 2 ... 96
Analysis 3 ... 96
7
Analysis 1a. Preference for seeing a particular doctor ... 98
Analysis 1b. Ability to see the doctor of the patient’s choice ... 101
Analysis 2. Seeing the clinician of the patient’s choice: changes over time ... 104
Analysis 3. Seeing the clinician of the patient’s choice: association with subsequent rating ... 105
Conclusions ... 108
SECTION B. Understanding patient experience in minority ethnic
groups ... 110
Chapter 5. Analyses of GP Patient Survey data to explore variations in
patient experience by ethnic group and practice... 111
Abstract ... 111
Introduction and rationale for the study... 112
Structure of work package ... 112
Changes to study methods from original protocol ... 113
Background to the GP Patient Survey ... 113
Workstream 1. Do poor patient experience scores of minority ethnic groups reflect their concentration in poorly performing primary care practices? ... 115
Aims and objectives ... 115
Methods ... 115
Results ... 117
Summary ... 125
Workstream 2. How does reported GP-patient communication varies between patients from different ethnic groups, stratified by age and gender? ... 126
Aims ... 126
Methods ... 126
Results ... 128
Summary ... 132
Workstream 3. Is there evidence that the GP Patient Survey communication items perform differently for South Asian and White British respondents? ... 133
Aims and objectives ... 133
Methods ... 133
Results ... 135
Summary ... 138
Workstream 4. How do practice factors influence GP-patient communication scores? ... 139
Aims and objectives ... 139
Methods ... 139
8
Summary ... 143
Overall conclusions ... 144
Strengths and limitations ... 145
Implications for practice ... 146
Chapter 6. How do White British and Pakistani people rate communication
within simulated GP-patient consultations? Experimental vignette study 147
Abstract ... 147Introduction and rationale for the study... 148
Changes to study methods from original protocol ... 149
Methods... 150
Simulated consultations ... 150
Data collection ... 152
Analysis ... 154
Results... 155
Participants ... 155
Main results ... 157
Analysis of interactions ... 160
Discussion ... 161
Strengths and limitations ... 161
Implications for practice ... 163
SECTION C. Using data on patient experience in quality improvement
... 164
Chapter 7. Attitudes to receiving feedback from patient experience surveys:
focus groups with practice staff ... 165
Abstract ... 165
Introduction and rationale for the study... 167
Changes to study methods from original protocol ... 167
Methods... 168
Findings ... 171
1.Understanding of, and engagement with, surveys ... 171
2.Changes driven by survey feedback ... 175
Barriers to improvement ... 178
Discussion ... 180
Strengths and limitations ... 181
The Utility Index ... 181
Implications for practice ... 184
9
Chapter 8. Attitudes to receiving feedback from patient experience surveys:
interviews with GPs and hospital consultants ... 186
Abstract ... 186
Introduction and rationale for the study... 187
Changes to study methods from original protocol ... 188
Methods... 189
Data collection ... 189
Data analysis ... 189
Results... 190
Dimensions of ambivalence ... 190
Patients and surveys ... 190
Patient experience surveys and quality improvement ... 195
Discussion ... 198
Implications for practice ... 200
Conclusion ... 201
Chapter 9. Understanding high and low patient experience scores: analysis
of patients’ survey data for general practices and individual GPs ... 203
Abstract ... 203
Introduction and rationale for the study ... 205
Changes to study methods from original protocol ... 205
Methods... 206
Questionnaire used in this study ... 207
Test-retest reliability ... 207
Analysis ... 208
Main analysis ... 208
Analysis of test-retest reliability ... 209
Results... 209
Main results ... 213
Results of test-retest reliability analysis ... 215
Discussion ... 222
Strengths and limitations ... 223
Conclusion ... 224
Chapter 10. Exploratory trial of an intervention to improve patient
experience in general practice ... 225
Abstract ... 225
Introduction and rationale for the study ... 226
Changes to study methods from original protocol ... 236
10
Methods... 238
Practice sampling and recruitment ... 238
Staff surveys ... 238
Practice allocation to intervention groups ... 241
Description of Real Time Feedback Intervention ... 244
Practice feedback reports ... 248
Facilitated team reflection session ... 249
Details of data collection... 249
Data analysis ... 254
Results: feasibility study ... 258
Results: exploratory trial ... 260
Proportion and characteristics of patients providing Real Time Feedback... 262
Observed patient and staff interactions ... 267
Patient views of RTF ... 267
RTF and staff attitudes to patient feedback ... 268
Cost analysis ... 271
Qualitative evaluation... 273
Discussion ... 291
Strengths and limitations ... 294
Conclusions ... 296
Chapter 11. The validity and use of patient experience survey data in
out-of-hours care ... 298
Abstract ... 298
Introduction and rationale for the study ... 300
Defining out-of-hours GP care ... 300
Ensuring quality and safety of out-of-hours care ... 300
Role of patient experience surveys in quality assessment ... 301
Rationale for the out-of-hours research ... 302
Structure of the out-of-hours work package ... 303
Changes to study methods from original protocol ... 304
Workstream 1. Exploring variations in national GPPS out-of-hours items ... 305
Study aims and objectives ... 305
Methods ... 305
Results ... 307
Discussion ... 315
Workstream 2. Establishing the validity of GPPS out-of-hours items ... 318
Study aims and objectives ... 318
Methods ... 318
11
Discussion ... 329
Workstream 3. Exploring how out-of-hours services use patient feedback ... 332
Study aims and objectives ... 332
Methods ... 332
Results ... 334
Discussion ... 338
Conclusions from the out-of-hours research ... 339
Implications for practice and future research ... 339
Chapter 12. Conclusions, implications for policy and practice and
recommendations for research ... 342
Conclusions ... 342
1. Understanding patient experience data ... 344
2. Understanding patient experience in minority ethnic groups ... 347
3. Using data on patient experience for quality improvement ... 349
Implications for practice ... 352
Recommendations for research ... 358
Acknowledgements ... 360
References ... 390
Appendices ... 416
Appendix 1: Chapters 2&3. Practice Information Sheet ... 417
Appendix 2: Chapters 2&3. GP Information Sheet ... 420
Appendix 3: Chapters 2&3. GP consent form ... 424
Appendix 4: Chapters 2&3. Patient full information Sheet ... 425
Appendix 5: Chapters 2&3. Patient summary information Sheet ... 430
Appendix 6: Chapters 2&3. Patient video consent form ... 431
Appendix 7: Chapters 2&3. GP questionnaire ... 434
Appendix 8: Chapters 2&3. Patient questionnaire ... 435
Appendix 9: Chapter 2. Patient interview information sheet ... 439
Appendix 10: Chapter 2. Patient interview consent form... 444
Appendix 11: Chapter 2. Video Elicitation Interview topic guide ... 445
Appendix 12: Chapter 3. Global Consultation Rating Scale ... 448
Appendix 13: Chapter 6. Computer-assisted personal interview schedule ... 449
Appendix 14: Chapter 7. Participant information sheet ... 455
Appendix 15: Chapter 7. Participant consent form ... 457
Appendix 16: Chapter 7. Focus group topic guide ... 458
Appendix 17: Chapter 8. Participant information sheet ... 461
Appendix 18: Chapter 8. Participant consent form ... 463
12
Appendix 20: Chapter 9. Practice information sheet ... 466
Appendix 21: Chapter 9. Patient information sheet ... 468
Appendix 22: Chapter 9. Patient questionnaire ... 470
Appendix 23: Chapter 9. Calculation of reliability ... 477
Appendix 24: Chapter 10. Practice information sheet ... 478
Appendix 25: Chapter 10. Practice consent form ... 482
Appendix 26: Chapter 10. Practice profile questionnaire ... 483
Appendix 28: Chapter 10. The Value of Patient Feedback Scale ... 488
Appendix 29: Chapter 10. Structured observation sheets ... 528
Appendix 30: Chapter 10. Patient exit surveys ... 536
Appendix 31: Chapter 10. Example focus group / interview topic guide ... 542
Appendix 32: Chapter 10. Facilitator interview topic guide ... 547
Appendix 33: Chapter 11. Provider information sheet ... 550
Appendix 34: Chapter 11. Patient survey information sheet ... 553
Appendix 35: Chapter 11. Patient questionnaire ... 555
Appendix 36: Chapter 11. Patient interview information sheet ... 563
Appendix 37: Chapter 11. Patient interview consent form ... 565
Appendix 38: Chapter 11. Patient interview topic guide ... 566
Appendix 39: Chapter 11. Service provider information sheet ... 571
Appendix 40: Chapter 11. Service provider consent form ... 573
Appendix 41: Chapter 11. Service provider interview topic guide ... 574
13
List of Tables
Table 1 Location of video elicitation interviews ... 59
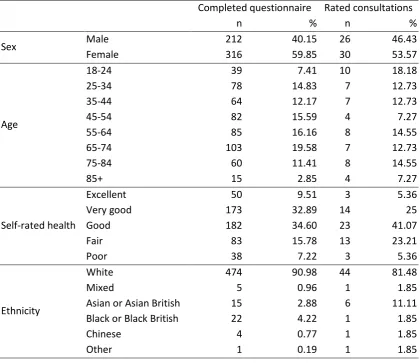
Table 2 Self-reported demographics for patients who completed a questionnaire
and those selected for consultations to be rated by trained raters ... 82
Table 3 Correlation coefficients/standardised regression coefficients used to
examine the association between physician scores and the scores given by the two sets of trained raters, and by patients ... 86
Table 4 Questions on choice of doctor as they appear in the GP Patient Survey ... 94
Table 5 Prevalence and odds ratios for having preference for seeing a particular
doctor ... 100
Table 6 Prevalence and adjusted odds ratios for seeing a preferred doctor most of
the time ... 103
Table 7 Descriptive statistics showing what patients wanted to do last time they
contacted the GP surgery ... 105
Table 8 Association between what type of appointment patients wanted and what
they got ... 106
Table 9 Results of the regression analysis examining the association between
nurse-patient communication scores and what patients wanted to do and what they did do among those who saw a nurse at their last visit to the GP surgery ... 107
Table 10 Results of the regression analysis examining the association between
doctor-patient communication scores and what patients wanted to do and what they did do among those who saw a doctor at their last visit to the
GP surgery ... 108
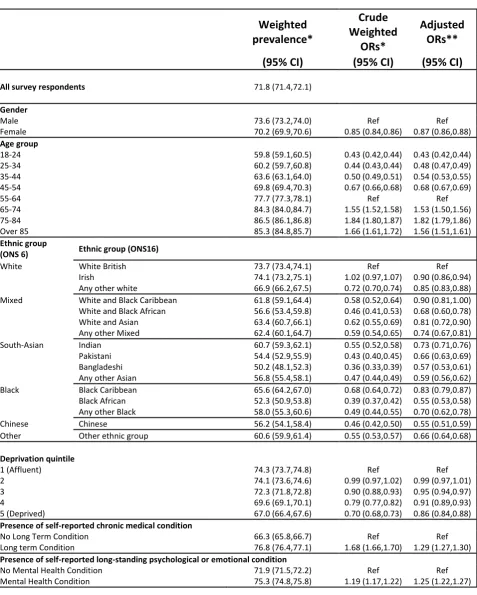
Table 11 Ethnicity of respondents to the 2009/10 GP Patient Survey ... 118
Table 12 Socio-demographic differences in reports of GP-patient communication
(scale 0=100) ... 120
Table 13 Socio-demographic differences in reports of nurse-patient communication
(scale 0-100) ... 122
Table 14 Mean ethnic group difference (percentile points) and degree of
consistency in ethnic group differences across practices (indicated by the respective 95% midrange) for doctor-patient communication ratings ... 124
Table 15 Mean ethnic group difference (percentile points) and degree of
consistency in ethnic group differences across practices (indicated by the respective 95% midrange) for nurse-patient communication ratings ... 125
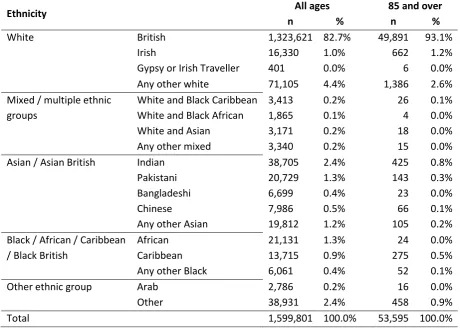
Table 16 Ethnicity make-up of sample for all ages and those aged 85 and over ... 129
Table 17 Estimated item parameters from graded response model in the full (n =
873,051) and the matched sample (N = 108,968) ... 136
Table 18 Regression coefficients for practice predictors (note models also include
individual case-mix variables not shown) ... 142
14
Table 20 Description of all video vignettes used with the number of times each
video was scored ... 157
Table 21 Output from the main regression model adjusting for socio-demographic characteristics but with no interactions ... 159
Table 22 Adjusted difference in communication scores for age group by good/poor scripted communication between White British and Pakistani participants 160 Table 23 Participating practices and focus group participants ... 169
Table 24 Plausibility of patient experience surveys: limiting factors and potential solutions ... 201
Table 25 Practice profiles and questionnaire response rates ... 210
Table 26 Demographic profile of patient respondents ... 211
Table 27 Demographic characteristics of test-retest patient sample by level of study participation with P value for tests of variation across the three groups ... 212
Table 28 Percentages of variance in adjusted mean outcome scores that are attributable to practices, doctors and patients ... 213
Table 29 Number of patient ratings needed to achieve reliability of 0.7 or 0.8 for a doctor’s raw and adjusted mean scores ... 213
Table 30 Sample size, raw agreement (%) and Cohen’s kappa statistic for the 33 categorical items ... 217
Table 31 Sample size, ICC (95% confidence interval), mean test-retest difference (95% confidence interval) and associated P value for the 21 ordinal response items ... 220
Table 32 Overview of relevant studies assessing impact of interpersonal skills training ... 228
Table 33 Intervention groups in the exploratory trial phase ... 241
Table 34 Core RTF survey items and response options ... 246
Table 35 Summary of patient exit survey items ... 252
Table 36 Cost analysis – cost items ... 256
Table 37 Cost analysis – unit costs ... 256
Table 38 Characteristics of participating practices (feasibility phase) ... 259
Table 39 Characteristics of participating practices (by exploratory trial group) ... 261
Table 40 Real-time feedback completion rates for consulting patients (exploratory trial) ... 263
Table 41 Representativeness of consulting patients who provide real-time feedback ... 265
Table 42 Value of patient feedback scores for practice staff: pre- and post-intervention, broken down by trial arm and staff group ... 269
Table 43 Cost analysis – results ... 272
Table 44 Characteristics of staff who took part in interviews and focus groups ... 274
15
hours GP provider (on their own behalf or for someone else) ...
Table 46 Timeliness of care, confidence and trust in out-of-hours clinician, and
overall experience of care: raw scores ... 309
Table 47 Associations of out-of-hours GP provider type with ‘timeliness’,
‘confidence and trust’, and ‘overall experience’ of care ... 311
Table 48 Overall experience of out-of-hours GP services: linear regression modelling
... 312
Table 49 Timeliness of care from out-of-hours GP services: linear regression
modelling ... 313
Table 50 Confidence and trust in out-of-hours clinician: linear regression modelling 314
Table 51 Changes made to GP Patient Survey items evaluating out-of-hours care
following cognitive interviews with service users ... 320
Table 52 The Out-of-hours Patient Questionnaire: 14 items used in analyses ... 322
Table 53 Characteristics of responders and non-responders (n=5,067) ... 325
Table 54 Confirmatory factor analysis of the Out-of-hours Patient Questionnaire .... 326
Table 55 Linear regression models showing the associations of OPQ items to the
four modified GPPS outcomes ... 328
Table 56 Overall author contributions to programme of research ... 361
Table 57 Chapter 2 acknowledgements. Contributions to the video elicitation
interview workstream ... 365
Table 58 Chapter 2 acknowledgements. Conference presentations relating to the
video elicitation interview workstream ... 366
Table 59 Chapter 3 acknowledgements. Contributions to the consultation rating
workstream ... 367
Table 60 Chapter 3 acknowledgements. Conference presentations arising from the
consultation rating workstream ... 368
Table 61 Chapter 4 acknowledgements. Contributions to the GP Patient Survey
analyses ... 369
Table 62 Chapter 4 acknowledgements. Published papers arising from the GP
Patient Survey analyses ... 370
Table 63 Chapter 5 acknowledgements. Contributions to the GP Patient Survey
analyses on minority ethnic experience ... 372
Table 64 Chapter 5 acknowledgements. Conference presentations arising from
GPPS minority ethnic groups analyses ... 373
Table 65 Chapter 5 acknowledgements. Published papers arising from GPPS
minority ethnic groups analyses ... 373
Table 66 Chapter 6 acknowledgements. Contributions to the vignette study ... 374
Table 67 Chapter 6 acknowledgements. Conference presentations arising from the
vignette study ... 375
Table 68 Chapter 7 acknowledgements. Contributions to the focus group study ... 376
Table 69 Chapter 7 acknowledgements. Conference presentations arising from the
16
Table 70 Chapter 7 acknowledgements. Published papers arising from the focus
group study ... 377
Table 71 Chapter 8 acknowledgements. Contributions to the GP interview study ... 378
Table 72 Chapter 8 acknowledgements. Conference presentations arising from the GP interview study ... 379
Table 73 Chapter 9 acknowledgements. Contributions to the patient survey workstream ... 381
Table 74 Chapter 9 acknowledgements. Conference presentations arising from the patient survey workstream ... 382
Table 75 Chapter 9 acknowledgements. Publications arising from the patient survey workstream ... 383
Table 76 Chapter 10 acknowledgements. Contributions to the RTF exploratory trial workstream ... 385
Table 77 Chapter 10 acknowledgements. Conference presentations arising from the RTF exploratory trial workstream ... 386
Table 78 Chapter 11 acknowledgements. Contributions to the out-of-hours workstream ... 387
Table 79 Chapter 11 acknowledgements. Conference presentations arising from the out-of-hours workstream ... 388
Table 80 Chapter 11 acknowledgements. Publications arising from the out-of-hours workstream ... 389
Table 81 Item pool following initial generation of items ... 490
Table 82 Group distribution for cognitive interviews ... 491
Table 83 Polychoric correlation matrix for all items ... 497
Table 84 Polychoric correlation matrix for all items after reversing negative items ... 500
Table 85 Final set of questions used in exploratory factor analysis ... 502
Table 86 Factor loadings from a 4 factor EFA ... 504
Table 87 Proposed final set of questions for the VOP scale ... 505
Table 88 Content validation of initial pool of items ... 507
Table 89 Comments from expert reviewers ... 512
Table 90 Revised items from cognitive interviews in group 1 ... 519
Table 91 Revised items from cognitive interviews in group 2 ... 519
Table 92 Revised items from cognitive interviews in group 3 ... 520
Supplementary Table 1 Questionnaire item response distributions ... 577
17
List of Figures
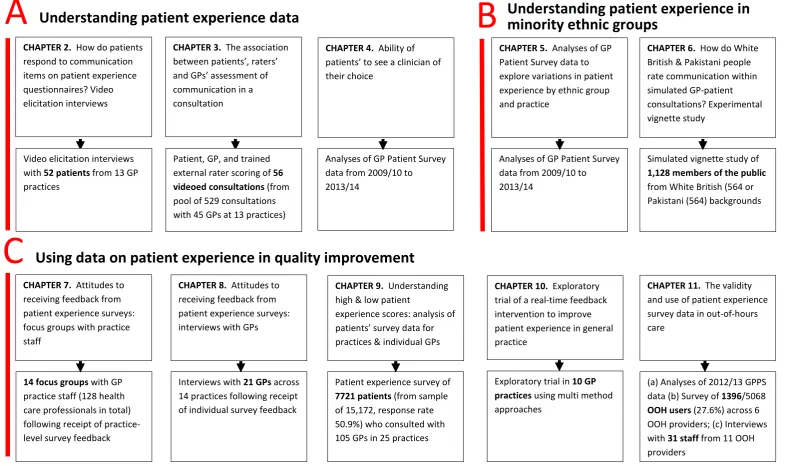
Figure 1 Improve programme themes and studies contained within workstreams ... 45
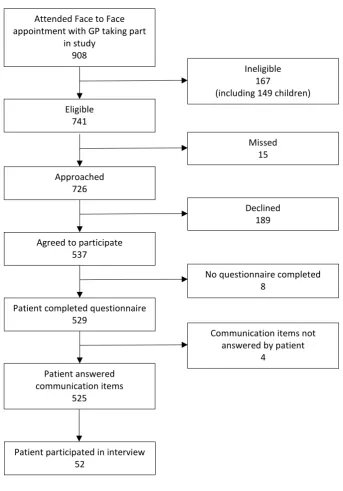
Figure 2 Flow of patients through the video elicitation interview recruitment process
... 58
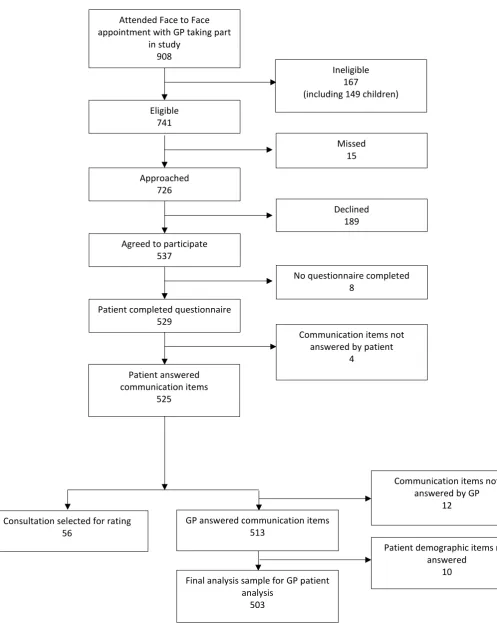
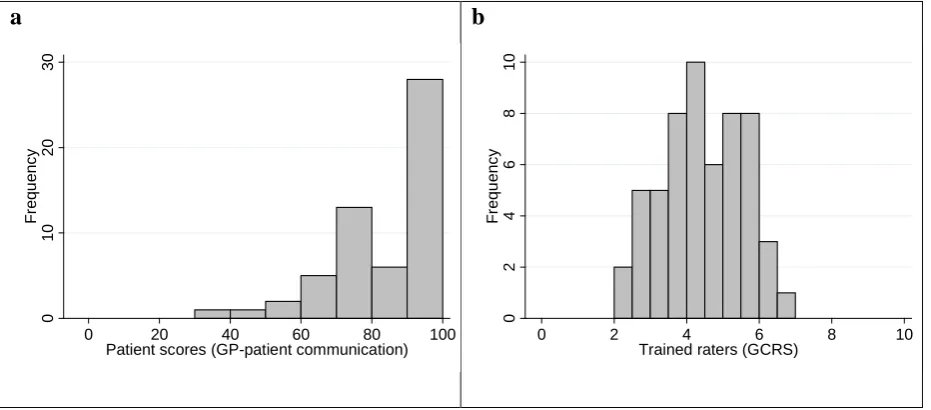
Figure 3 Flow chart illustrating the recruitment and participation of patients ... 81
Figure 4 Distribution of patient scores based on GP patient survey items and ratings
by trained raters on the GCRS ... 83
Figure 5 Scatterplot comparing patient scores based on GP patient survey items and
ratings by trained raters on the GCRS ... 84
Figure 6 Simulated GP communication scores based on different numbers of patient
ratings. The grey areas show the possible individual patient scores that could be given for any particular level of communication competence, as assessed by GCRS ... 85
Figure 7 Distribution of scores given to consultations by GPs scoring themselves (a
and c), raters using the GCRS scale (b), and patients (d). Panels a and b apply only to those consultations rated by trained raters, whilst panels c and d relates to all consultations where GP and patient scores were
recorded along with patient demographics ... 87
Figure 8 Scatterplots illustrating the association between GP scores and a) trained rater scores using the GCRS scale, and b) patients ... 88
Figure 9 Percentage of people able to see or speak to the GP they prefer 'a lot of the time', 'almost always' or 'always' (of people who say they have a particular GP they prefer to see – data from GP Patient Survey) ... 105
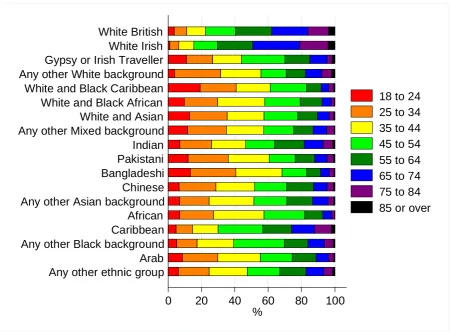
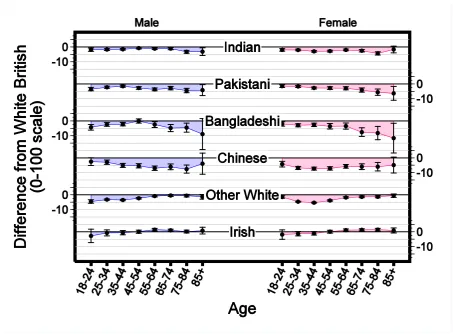
Figure 10 Age composition of responders according to self-reported ethnicity ... 130
Figure 11 Age and gender specific differences, with 95% confidence intervals, in reported GP-patient communication scores (0-100 scale) between White
British patients and responders in Asian and white ethnic groups ... 131
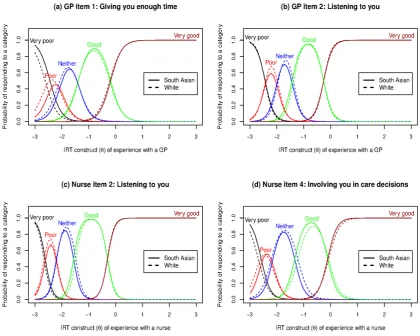
Figure 12 Full sample response curves for GP and nurse experience ... 137
Figure 13 Full sample test characteristics curves (TCC). (A) TCC for GP questions; (B) TCC for nurse questions ... 138
Figure 14 Development of vignettes ... 151
Figure 15 Geographic location of the census based output areas where participants
were recruited ... 156
Figure 16 Box plots showing the distribution of GP communication scores recorded
by White British and Pakistani participants ... 158
Figure 17 The ‘utility index’ of patient experience surveys in primary care –
perspectives of practice staff ... 182
Figure 18 GPs’ Attitudes to Patients’ Motivation and Competence ... 194
Figure 19 Doctors’ attitudes to patient experience surveys as quality improvement
18
Figure 20 Mean communication score (best estimate) by practice and doctor ... 214
Figure 21 Mean score for cleanliness of practice building (best estimate) by practice and doctor ... 215
Figure 22 Intervention groups in the exploratory trial phase ... 231
Figure 23 Overview of practice pathway (exploratory trial) ... 243
Figure 24 Multi-method approach to data collection ... 250
Figure 25 Normalisation Process Theory framework – qualitative analysis ... 258
Figure 26 Attendance at RTF set-up sessions by intervention arm, practice and staff role ... 273
Figure 27 % Endorsing each response category for each question ... 496
Figure 28 % Endorsing each response level for each question ... 499
19
List of Boxes
Box 1 GP-patient communication items used in the patient experience survey ... ….55
Box 2 Video elicitation interview approach ... 56
Box 3 GP-patient communication items used in the patient experience survey ... 77
Box 4 GP and nurse communication items for the 2009/10 GP Patient Survey ... 116
Box 5 GP & nurse communication items for the 2012/13 & 2013/14 GPPS ... 127
Box 6 GP communication items used to rate vignettes ... 154
Box 7 Sample focus group questions ... 170
Box 8 The Value of Patient Feedback Scale ... 240
Box 9 Interactions and events targeted during structured observation sessions ... 251
20
List of abbreviations
ANOVA Analysis of Variance
APMS Alternative Provider Medical Services
CAHPS Consumer Assessment of Healthcare Provider surveys
CAPI Computer-administered personal interview
CATI Computer-administered telephone interviews
CFI Comparative Fit Index
CI confidence interval
CLRN Comprehensive Local Research Network
CQC Care Quality Commission
CRT Customer Research Technology Limited
DH Department of Health
DIF Differential Item Functioning
EQ-5D European Quality of Life-5 Dimensions
FFT Friends and Family Test
FTE Full Time Equivalent
GCRS Global Consultation Rating Scale
GP General Practitioner
GPPS General Practice Patient Survey
HCA Health Care Assistant
IMD Index of Multiple Deprivation
IMPROVE Improving patient experience in primary care
IRT Item response theory
NHS National Health Service
NIHR National Institute for Health Research
NQR National Quality Requirement
NRES NHS Research Ethics Service
OOH out of hours
OR odds ratio
ONS Office for National Statistics
PCA Principal Components Analysis
21
PPG Patient Participation Group
PPI Patient and Public Involvement
QOF Quality and Outcomes Framework
RCT randomised controlled trial
REC Research Ethics Committee
RMG Research Management and Governance
RMSEA Root mean square error approximation
RTF Real Time Feedback
SD standard deviation
SHA Strategic Health Authority
TCC Test Characteristics Curves
22
Plain English Summary
We aimed to gain a better understanding of how patients in general practice use surveys to record their experiences, to understand how staff respond to feedback, and to find ways of engaging staff more actively in the process. We did this in a number of ways, including carrying out surveys, having discussions with patients and staff, and trying out different ways of gathering patient feedback.
Patients were reluctant to be critical when completing questionnaires after consultations even when they didn’t think their care had been very good, and they explained their reasons for this. Considering the results of the national GP Patient Survey, we found that the most common reason for dissatisfaction was patients not being able to see a doctor of their choice – something that has got worse in the past few years.
We carried out several studies to understand why minority ethnic groups give low scores on patient surveys. Part of this is because they tend to be registered in practices with low scores. However, our studies also suggest that low scores from South Asians reflect poor care rather than, for example, different expectations.
We found that, in both primary and out-of-hours care settings, staff don’t trust the results of patient surveys and don’t usually make big changes in clinical care as a result of these. We looked for ways of engaging staff more actively with patient feedback. We tested ‘real time feedback’, where patients use a touchscreen in the waiting room, with staff being provided with results fortnightly. Although patients found this useful, few actually used it unless they were reminded by receptionists.
We describe the implications of our research for practice and make recommendations for future research.
23
Scientific Summary
This programme had seven aims:
1. To understand how general practices respond to low patient survey scores. 2. To estimate the extent to which practice level scores mask differences between
individual doctors.
3. To investigate how patients’ ratings on questions in the GP Patient Survey relate to actual behaviour by GPs in consultations.
4. To understand patients’ responses to questions on communication and seeing a doctor of their choice.
5. To understand the reasons why minority ethnic groups, especially South Asians, give lower scores on patient surveys compared to White British respondents.
6. To carry out an exploratory RCT of an intervention to improve patient experience, using tools developed in earlier parts of the programme.
7. To investigate how the results of the GP Patient Survey can be used to improve out-of-hours care.
In this report, we group our results under three headings:
• Understanding patient experience data (aims 3 and 4)
• Understanding patient experience in minority ethnic groups (aim 5)
• Using data on patient experience for quality improvement (aims 1, 2, 6 and 7)
We conducted empirical studies in GP practices (varying in location, deprivation and performance on patient experience measures) and out-of-hours providers nationally. A total of 47 GP practices and 11 out-of-hours providers participated in the programme of work, although some were involved in more than one study. We additionally completed multiple analyses of GP Patient Survey data and, for an experimental vignette study, collected data from the general public.
1. Understanding patient experience data
24 completing them. We approached this issue in two studies, in which we (1) used video
elicitation interview methods to ask 52 patients directly about how they chose certain questionnaire responses while showing them a video of their consultation and (2) used
statistical analyses to compare assessments of videoed consultations by 56 patients with those of expert raters using standardised assessment instruments.
The first study (chapter 2) showed that while patients readily criticised their care when reviewing consultations on video, they described how they had been reluctant to be critical when completing a questionnaire. Reasons for this included the need to maintain a
relationship with the GP, gratitude for NHS care they had received in the past, and power asymmetries. We concluded that patients find questionnaires to be limited tools for feeding back concerns about consultations.
The second study (chapter 3) reinforced our conclusion from chapter 2. When trained raters judged communication in a consultation to be good, patients generally did the same.
However, when trained raters judged communication in a consultation to be poor, patients’ assessments varied from poor to very good.
The tendency for patients to choose positive responses suggests absolute survey scores should be treated with caution: they may present an over-optimistic view of the GP’s care. Surveys can be used to look at relative scores: scores from a GP which are lower than comparable practices are likely to indicate a problem.
We spoke to GPs about their survey results (chapters 7 and 8) through both focus groups and face-to-face interviews: they reported how, whilst positive about the concept of patient feedback they struggled to engage with and make changes under the current approaches to measurement.
25 In out-of-hours care, we found that patients reported worse experiences where the service was run by a commercial provider compared with not-for-profit or NHS providers. We discuss possible reasons for this.
2. Understanding patient experience in minority ethnic groups
Minority ethnic groups provide consistently low scores in English surveys. In this theme, our analyses of GP Patient Survey data focused on South Asian respondents and on
questionnaires completed in English. Although the GP Patient Survey is available in 15 languages, fewer than 0.2% of surveys are completed in languages other than English. First we showed that Asian respondents to the GP Patient Survey tend to be registered in practices with generally low scores, explaining about half of the difference between South Asian and White British patients in their experience of care (chapter 5). Then, using item-response theory, we found no evidence that South Asians used the scales in a different way to White British respondents (chapter 5).
We then conducted an experimental vignette study, for which we filmed 16 simulated consultations based on transcripts of real consultations using various combinations of White and Asian doctors and patients, half scripted to be ‘good’ and half ‘poor’ for communication. We showed three randomly sampled videos to each of 1120 people (half White British, half Pakistani, equally split between those under and over 55) and asked them to score the
consultation using the communication items from the GP Patient Survey. If the low scores of Pakistani patients in real life settings were due to higher expectations of care, then we would expect them to give lower scores in the experimental vignette situation. In fact, the reverse was observed. When viewing the same consultation, Pakistani respondents gave scores which were much higher when adjusted for socio-demographic characteristics, compared to White British respondents. This suggests that the low scores given by Pakistani patients in surveys such as the GP Patient Survey reflect care which is genuinely worse, and possibly much worse, than that experienced by their White British counterparts.
26 patients. Our results suggest that this should not be done: rather, low scores from South Asian patients should be taken at ‘face value’ and investigated as possible indicators of poor care.
3. Using data on patient experience for quality improvement
In chapter 9, we summarise a patient experience survey we conducted to explore assessment of care conducted at practice level compared to individual GP level. In chapters 7 and 8 we describe focus group and interview studies in which we sought the views of GPs and practice staff on survey results. In chapter 11 we describe a qualitative interview study with out-of-hours staff responsible for collecting and acting upon patient feedback which explored the same issues, alongside other work on measuring patient experience of out-of-hours care.
By conducting a patient experience survey at individual doctor level, we demonstrated that practice-level ratings of GPs’ communication skills can mask considerable variation between GPs within a practice. This is particularly the case in poorer performing practices, where patients may experience wide variation in communication skills between individual doctors.
Across both settings, staff neither believed nor trusted patient surveys. Concerns were expressed about their validity and reliability and of the likely representativeness of respondents. Staff expressed a preference for free-text comments as they provided more tangible, actionable data. It was easiest for practices to engage with office functions such as appointment systems and telephone answering. Addressing an individual doctor’s
performance (e.g. communication skills) was much more difficult.
In interviews, doctors expressed markedly ambivalent views about surveys. However, despite their concerns about surveys, they expressed broadly positive views about the importance of patient feedback in monitoring and improving services.
27 views on RTF, and to estimate the costs to a practice of introducing RTF. We also included facilitated feedback in one arm of the exploratory trial. In our exploratory trial, only 2.5% of consulting patients left any RFT without prompting; however, if encouraged to use RTF by staff, as many as 60% of patients did so. Of patients who used RTF, 86% found it easy to use and were positive about it as a feedback method. Lack of awareness of the screens and lack of time were the commonest reasons for not giving feedback.
Practice staff were broadly positive about using RTF and practices valued the ability to include their own questions in the survey. Practices which had open communication between staff members tended to be more positive about using patient feedback. Practice staff
identified clear benefits from having a facilitated session for discussion of patient feedback and having protected time to discuss the results.
Our programme of work was supported by two study advisory groups comprised of lay members and health care professionals: one, based in Cambridge, which provided support across all streams of work except the out-of-hours research, and one, based in Exeter, convened specifically to provide input to the out-of-hours workstreams.
Implications for practice
The work that we have carried out over the past five years has clear implications for practice.
1. The importance of patient experience
Our research supports the continuing emphasis on obtaining patient experience feedback as an important means of informing NHS care. Whilst continuing effort should be invested in refining the most effective and meaningful mechanism to capture patient feedback, the key challenge remains to provide primary care staff with the support and means to enable them to act upon patient feedback.
2. The need for action on the quality of care for minority ethnic groups
28 with patients from South Asian backgrounds experiencing considerably poorer
communication with GPs than their White British counterparts. Effort should be invested to ensure lower scores on patient experience surveys from such groups are investigated as markers of poorer quality of care.
3. Patients give over-positive responses when rating their care
Our results highlight the difficulty that patients have in feeding back negative experiences in questionnaire surveys. However, patients’ reluctance to criticise a doctor or provider with whom they have to maintain an ongoing relationship will not be addressed simply by
changing the survey method. Providers and managers need to understand that absolute scores paint an optimistic picture of patients’ true views.
4. Surveys are not sufficient to fully capture patient feedback
Across primary and out-of-hours care settings, staff view patient surveys as necessary, but not sufficient. Alternative methods for gaining more qualitative feedback were commonly used to supplement survey scores, with free text viewed as providing more actionable data than responses to standard survey questions.
5. The need for individual level feedback for doctors
Reporting patient experience at practice level masks substantial variation in performance within practices for aspects of care related to individual doctors (e.g. doctor patient communication). However, if a practice has overall high scores for doctor-patient communication, it is unlikely that such a practice contains a low scoring doctor. Robust mechanisms are needed to help lower scoring practices identify and support doctors whose individual patient feedback identifies areas for potential improvement.
6. Patient surveys need to become more meaningful to staff
29 Immediacy of feedback, regularity of feedback, and having some control over the questions asked were all aspects of our experiment with RTF that were valued by practices and had the potential to make feedback more useful. However, a number of important questions remain before RTF could be recommended as a replacement for postal questionnaires.
7. The value of surveys in monitoring national trends
Despite their limited value in stimulating quality improvement, surveys are important for monitoring national trends. For example, the GP Patient Survey is the only source of data which demonstrates that, year on year for the past five years, patients report that they have had increasing difficulty in seeing a doctor of their choice. For out-of-hours services the GP Patient Survey is the only way of monitoring trends. However, where national surveys are used to monitor trends in care it is important that the questions (such as questions on access in the GP Patient Survey) do not keep changing. Much smaller sample sizes are required to monitor national trends: tens of thousands of participants rather than millions.
8. Development of surveys in out-of-hours care
Out-of-hours services are required to audit patient experience but are provided with no information on how to do this, leading to diverse and non-comparable data. Our work shows that, subject to minor amendments, the GP Patient Survey is suitable for the national
monitoring of OOH care. However, it is not sufficiently detailed to support quality improvement, and is unlikely at present to replace in-house approaches, leading to duplication of effort.
Concluding remarks
Large scale postal surveys are likely to remain the dominant approach for gathering patient feedback for the time being, although a range of other methods are being developed. These include real time feedback, focus groups, online feedback, analyses of complaints, practice participation groups, and social media. In the final section of our report we outline
recommendations for research, and identify the criteria that any new methods will need to meet in order to become useful quality improvement tools.
30
Chapter 1. Introduction to the IMPROVE programme
Context
Improving the health status of individuals and populations is a central ambition of western healthcare systems, and the US Institute of Medicine has suggested that high quality healthcare delivery should be safe, effective, patient-centered, timely, efficient and
equitable.1 Berwick et al. 2 have recently noted the importance of patient experience of care as one of the suggested ‘triple aims’ of an advanced healthcare system. A recent US report highlighted the important contribution that listening to, and acting on, patient feedback can potentially make to healthcare improvement efforts. 3
New developments within the English NHS highlight the embedding of public performance assessment within the regulation of the health care system, including NHS England’s consultation on the production of GP league tables, 4 and the Care Quality Commission’s parallel development of a rating system for primary care. 5 A transparent health care system is regarded by policy makers as essential to enabling patients to make informed choices about the care they receive, 6 and patient feedback on healthcare services is now commonly gathered in the US, Canada, Europe, Australia, and China.
Efforts to improve quality of care in the NHS over the last 15 years have focused on
providing prompt access to care (for example, the time taken to see a GP or hospital waiting times), and on providing evidence-based clinical care (for example through the development of National Service Frameworks and the Quality and Outcomes Framework). A direct link between patient feedback and quality improvement efforts was previously operationalised by including results arising from patient surveys as a component of the UK Quality and
Outcomes Framework (QOF). 7 This performance management system provides financial incentives for GPs within the NHS to achieve agreed quality indicators covering areas including chronic disease management, practice organisation and additional services offered. With the introduction of QOF it was possible, for the first time, to rank all practices
31 Some of these policies have been highly effective – for example, associated with a wide range of quality improvement initiatives over a decade, there have been greater
improvements in the UK for the clinical care of conditions like heart disease and diabetes than in any other major developed country. 8 Although relatively neglected in the early years of the millennium, patient experience of healthcare is now a high policy priority, and in 2008 the Next Stage Review 9 suggested that:
“…..quality of care includes quality of caring, this means how personal care is – the
compassion, dignity and respect with which patients are treated. It can only be improved by analysing and understanding patient’s satisfaction with their own experiences.”
The review however noted that “[up until 2008] progress has been patchy, particularly on patient experience” and announced the development of quality accounts for all NHS
organisations in which “….we will require healthcare providers to publish data … looking at safety, patient experience, and outcome.”
Since 2008, therefore, there has been a major policy initiative to improve patient experience in the NHS. Most recently, the focus on patient experience has been enshrined in the NHS Outcomes Framework which, in Domain 4, focuses on ensuring that ‘patients have a positive experience of care’. 10 In primary care, these policy initiatives and statements have been implemented primarily through the development and conduct of the GP Patient Survey (www.gp-patient.co.uk), first sent to 5.6 million patients in January 2009. The large sample size was intended to provide sufficient responses to characterise patient experience of
32 In seeking to achieve improvement in the quality of NHS services, gathering data is
important both to inform the process of service development and innovation, and to assess the impact of such changes in practice. It has been suggested that data to support such
improvement initiatives needs to be of sufficient quality to assess whether an innovation can be made to work, rather than the more rigorous level of research data needed to assess whether an innovation works. 12
Communication in the consultation has always been an important part of primary care and is closely linked to continuity of care. At the outset of this research, there had been many anecdotal accounts that GPs were more focused on meeting clinical targets identified on their computer screens than on the needs of the patient sitting in front of them. It seemed therefore an appropriate time to balance the focus on improving clinical care with a renewed focus on inter-personal care and on communication in the consultation. The ability of patients to choose their own doctor is also important. Our research prior to commencing this programme showed that continuity of care had deteriorated since the introduction of the new GP contract in 2004, 13 and previous research had also highlighted that patients were less likely to report overall positive experiences if they were not able to choose a doctor whom they know. 14, 15
Experience and satisfaction
Previous research has identified considerable confusion and overlap relating to the concepts of patient experience and satisfaction. The two concepts are closely linked, although at a simple level, reports of experience relate to recounting or commenting on what actually happened during the course of a clinical encounter, whilst reports of satisfaction focus on the patient or carer’s subjective evaluation of the encounter (that is, asking for “ratings” of care rather than simple “reports” of care). Individual items in a survey may thus examine patient’s reports of their experience of care, whilst other items may explore patient’s evaluation of that care, the linkage between report and evaluation/rating item pairs offering potential for the development of cut points in scales of performance. 16 In practice, however, the terms are often used interchangeably and survey items designed as report items often have an
33 questions ask patients to consider “how good” the doctor was at providing various elements within a consultation, including giving enough time, involving in decisions about care and treating with care and concern.
Patient satisfaction may be seen as a multidimensional construct, focusing on the subjective experiences of patients, and related to their expectations of care, and the perceived technical quality of the care provided. 17 Russell 18 has recently summarised some of the problems associated with surveys of patient satisfaction with care, including problems with the validity and reliability of satisfaction survey instruments, the lack of a universal definition of the term satisfaction, the disinclination for patients to be critical of care received because of not wanting to jeopardise their treatment, satisfaction being determined by factors other than the actual health care received, and the frequently non-specific nature of resulting findings arising from such surveys. In contrast, reports and surveys of patient experience may offer potential to discriminate more effectively between practices than do reports of patient satisfaction 19 thus potentially offering greater external accountability of health care
providers, enhanced patient choice, and greater potential to improve the quality of care and to measure the performance of the health care system as a whole. 20
Patient experience matters
Patient experience is an important end point for NHS care in its own right. Patients consistently report that personal care is central to effective care, and in that context, the development and refinement of GP’s interpersonal skills are a key priority. 20, 21 It is
noteworthy that many complaints regarding care centre not on technical and ‘clinical’ aspects of care, but on issues relating to inter-personal aspects of care and communication. 22, 23 Good communication with patients is not just an end in its own right; it brings three important additional benefits.
Firstly, our research 24 has confirmed earlier work which showed that patients balance a range of beliefs and concerns when making decisions about taking medicines. Adherence is related both to the quality and duration of the consultation, and to the doctor’s ability to elicit and respect the patient’s concerns. 25-27 Better communication may lead to improved patient
34 Second, there is a close relationship between poor communication and serious medical
error.30 This is partly because not listening to the patient’s perspective may lead doctors to miss important clinical information, and partly because patients react more negatively when things go wrong if communication has been poor during the clinical episode in question. A significant proportion of cases referred to medical defence societies have at their heart poor communication in the consultation, 31 and improving communication with patients and engaging them more closely in their care is seen as key to improving patient safety. 32, 33
Third, the increasing emphasis in the NHS on self-care and prevention demands good
information and shared decision making in the consultation. Our research shows that GPs and practice nurses are currently poorly prepared for roles in which they encourage patients to take greater responsibility for their own care 34 or their lifestyle choices.
Although intuitively of importance, enhanced patient experience of care also matters on account of an important range of other associations reported in the research literature, including improved safety-related outcomes, 35 self-reported health and wellbeing, 36
enhanced recovery, 28 increased uptake of preventive health interventions, 37, 38 and reduced utilization of health care services including hospitalization and emergency department visits.39
Capturing patient experience of care
Whilst several approaches have been adopted to obtaining information on patient experience of care – for example through the use of focus groups, patient participation groups, in depth patient interviews, feedback booths placed in healthcare settings, direct observation of patient experience, 40 and the use of compliment and complaint cards to capture qualitative feedback – the only practical approach to capturing large-scale feedback with the intent of providing actionable information remains through the use of surveys of patients. In primary care in England, this culture of feedback has been embedded into routine practice in several ways. Central amongst these is the use of structured patient feedback obtained through surveys of patients’ experience of care, both at national and practice levels. 41
35 Locock et al. 43 have drawn on secondary analysis of a large national qualitative data archive to inform service improvements.
Newer forms of capturing feedback, such as the use of tablets and kiosks to capture real time feedback is an area of great current interest, but ones which, as yet, lack a strong evidence base from primary care. During the course of this research, a report from a preliminary observational study 44 suggested that real-time feedback offers potential in primary care settings, and similar findings 45 have emerged from reports provided by patients with cancer attending oncology out-patients. Whilst there may be potential for widespread use of real-time data capture of patient experience in primary care, the acceptability and feasibility of the approach in routine primary care is not known, and nor is the nature of the feedback
provided. Such an investigation needs detailed feasibility and pilot work using an experimental design of real-time feedback of patient experience of primary care.
Large scale surveys of NHS patients and staff have been in use since the mid-1990s, building on the experience of smaller-scale surveys conducted at local level, or on the experience of surveys conducted for research purposes. Large scale surveys of patient experiences of primary care were first introduced in 1998 46 with the express purpose of addressing issues relating to the quality of care and reducing inequalities in care by taking account of patient’s views in informing local service developments. Surveys of patients have been used
extensively since the introduction of the UK Quality and Outcomes Framework in 2004, when two questionnaires (GPAQ 11and CFEP 47) were ‘approved’ for use by the NHS, and adopted as the basis of linking the pay of general practitioners to their participation in the patient survey programme. 48
Such surveys may be administered in a variety of ways. In healthcare contexts, paper-based surveys are most commonly used, although digital e-platforms are now commonly and widely used as a means of capturing information, most frequently using online processes. Computer-administered personal surveys (CAPI) 49 and computer administered telephone interviews (CATI) may also be used, most commonly in research settings.
36 Consumer Assessment of Healthcare Provider surveys (CAHPS) introduced in the US in 1995. 51
The content of primary care surveys of patient experience
Historically, the content of UK primary care surveys has evolved from the 1998 survey, 52 which covered a wide range of issues including primary care access and waiting times, GP-patient communication, GP-patients’ views of GPs and practice nurses in terms of knowledge, courtesy, and other personal aspects of care, and the quality and range of services provided such as out-of-hours care and hospital referrals. The GP Patient Survey in 2008 developed and presented an expanded suite of items from the surveys of 2006 and 2007, which were focused almost exclusively on the accessibility of GP services; the 2008 survey focused on domains of care identified as being of importance to patients, 53, 54 including the accessibility of care, technical care, inter- personal care, patient-centredness, continuity, outcomes, and hotel aspects of care. More recently, the English National Health Service (NHS) has outlined eight domains believed to be of critical importance in respect of patient experience.
Overlapping with earlier thinking, these include respect for patient-centred values,
information, communication and education, emotional support, physical comfort, continuity, and access to care, 55 all being reflected, at least to some extent, in the ongoing GP Patient Survey programme.
Most recently, the ‘Friends and Family Test’ has been introduced widely across the NHS, acting as a single-question proxy for patient experience based on the willingness of
respondents to recommend their healthcare provider to close acquaintances. The widespread use of the test has been accompanied by specific guidance on its implementation in practice, 56, 57 and research reports have recently started to emerge following the use of the test in hospital settings, in which concerns have been raised about the reliability of the test. 58, 59 The use of the test was rolled out to GP settings in December 2014.
Out-of-hours services
37 patients’ experience of out-of-hours care has been identified as an area of concern since 2000, with numerous influential reports considering the structures suitable for delivering out-of-hours care, as well as highlighting the variable experience of patients across the UK in respect of service delivery. In 2000, Dr David Carson reported on the structural aspects of out-of-hours care pertaining at the time, and recommended an expanded role for NHS Direct as a facilitator of access to these GP-led services, proposing that patients should use a single telephone access point to enter the system. 60 Much less emphasis was placed on patients’ experience of out-of-hours care, although recommendations were made regarding the need to monitor patients’ experience of the developing service. The transfer of responsibility for out-of-hours care from GPs to primary care trusts was foreshadowed in a report of the House of Commons Health Committee 61 which once again focused on structural and organisational issues relating to care provision. It was not until 2006, 62 following the publication of national quality requirements in respect of out-of-hours care in October 2004, 63 that patient
experience of such services began to attract serious attention, with a recognition that, by 2006, although patient experience of out-of-hours services was generally ‘good’, 1 in 5 patients were dissatisfied with the service at that time, and 40% of respondents in an independent survey of out-of-hours service users reported that the overall quality of the service was less than ‘good’. 64 The incorporation of six items in the 2008 GP Patient Survey with the intent of capturing information on aspects of out-of-hours GP services thus
represented an extension of earlier versions of the questionnaire, recognising the growing importance of patient experience of care, and offered the potential to examine the experience of patients from various sub-groups of the population, and the potential to compare out-of-hours service providers in respect of their patients’ experience of care.