© 2019, IRJET | Impact Factor value: 7.211 | ISO 9001:2008 Certified Journal | Page 3317
A Comparative Study of Control Algorithms for DSTATCOM for
Harmonic Elimination and Reactive Power Compensation
Ms.Heena Parveen
Assistant Professor
Department of Electrical and Electronics Engineering Stanley College of Engineering and Technology for women
Chapel road, Abids, Hyderabad
---***---Abstract
—
In this paper, two different control algorithms for DSTATCOM are presented. The evaluation of different methods is made to derive reference source current signals from the load current to generate the switching pulses for IGBTs of the VSC of the DSTATCOM for harmonic elimination and reactive power compensation. These methods are Back Propagation(BP) control algorithm and Synchronous Reference Frame(SRF)Theory. Back Propagation(BP) control algorithm is based on extraction of the fundamental weighted value of active and reactive power components of load currents which are required for the estimation for reference source current and SRF theory is based on the transformation of currents in synchronously rotating dq frame. Back propagation control algorithm and SRF theory based DSTATCOM are simulated with MATLAB using SIMULINK for linear and non linear loads. Here linear load used is three phase series RL load and non linear loads are three phase uncontrolled rectifier with RL load. The performance of DSTATCOM is studied with the proposed control algorithms for various types of loads
Keywords- Back propagation(BP) control algorithm, SRF theory harmonics,reactive power compensation, power quality
1. INTRODUCTION
In present day distribution systems, major power consumption has been in reactive loads, such as fans, pumps, etc. These loads draw lagging power-factor currents and therefore give rise to reactive power burden in the distribution system. Excessive reactive power demand increases feeder losses and reduces active power flow capability of the distribution system. Power quality in distribution systems affects all the connected electrical and electronics equipments. It is a measure of deviations in voltage, current, frequency of a particular system and associated components. In recent years, use of power converters in adjustable speed drives, power supplies etc is continuously increasing.
This equipment draws harmonics currents from AC mains and increases the supply demands. These loads can be grouped as linear (lagging power factor loads), nonlinear (current or voltage source type of harmonic generating loads), unbalanced and mixed types of loads. Some of power quality problems associated with these loads include harmonics, high reactive power burden, load unbalancing, voltage variation etc. The presence of harmonics in the power system cause greater power loss in distribution, interference problem in communication system and, sometimes results in operation failure of electronic equipment’s.
A DSTATCOM is a device which is used in an AC distribution system where, harmonic current mitigation, reactive current compensation and load balancing are necessary. The device is shunt connected to the power distribution network. In general, the DSTATCOM can provide power factor correction, harmonics compensation and load balancing. The major advantages of DSTATCOM compared with a conventional staticVAR compensator (SVC) include the ability to generate the rated current at virtually any network voltage, better dynamic response and the use of a relatively small capacitor on the DC bus.
© 2019, IRJET | Impact Factor value: 7.211 | ISO 9001:2008 Certified Journal | Page 3318
In this paper, two different control algorithms used for the control of a DSTATCOM is analyzed and the performance of a DSTATCOM is studied through design and simulation.
2. SYSTEM CONFIGURATION
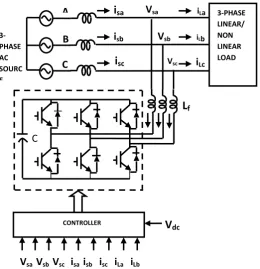
A voltage source converter (VSC)-based DSTATCOM is connected to a three phase ac mains feeding three phase linear/nonlinear loads with internal grid impedance which is shown in Fig.1. The performance of DSTATCOM depends upon the accuracy of harmonic current detection. For reducing ripple in compensating currents, the tuned values of interfacing inductors (Lf) are connected at the ac output of the VSC. The DSTATCOM currents (icabc) are
injected as required compensating currents to cancel the reactive power components and harmonics of the load currents so that loading due to reactive power component/ harmonics is reduced on the distribution system.The voltage and current rating of the required compensation decides the rating of the switches.
[image:2.595.169.430.339.609.2]The selection of the DC bus voltage, DC bus capacitor, AC inductors in the following sections and the obtained values are shown in appendix
Fig. 1. Schematic diagram of VSC-based DSTATCOM
2.1. DC Capacitor Voltage
The value of DC bus voltage (Vdc) depends on the PCC voltage and its must be greater than amplitude of the
AC mains voltage for successful PWM control of VSC of DSTATCOM. For a three-phase VSC, the DC bus voltage is defined as,
3 *
2 2
m V
V LL
dc (1)
Vsb
Vsc
Vsa
iLc iLb
iLa
i
scisb
i
sa3-PHASE AC SOURC E
C B
A 3-PHASE
LINEAR/ NON LINEAR LOAD
L
fC
V
dcCONTROLLER
Vsa Vsb Vsc isa isb isc iLa iLb
© 2019, IRJET | Impact Factor value: 7.211 | ISO 9001:2008 Certified Journal | Page 3319 Where m is the modulation index and is considered as 1 and VLLis the AC line output voltage of DSTATCOM.
2.2. DC Bus Capacitor
The design of the DC bus capacitor is governed by the depression in the DC bus voltage upon the application of the loads and rise in the DC bus voltage on removal of the loads. Using the principle of energy conservation, the equation governing Cdc is as,
2 2 ) 4 . 1 ( ) 8 . 1 ( * * ) 2 2 ( M M dc V V CYCLE TIMEPERIOO NOOFCYCLES X X C
(2)
Where X is rating of converter and Vm is peak value of phase voltage
2.3 AC Inductor
The selection of the AC inductance depends on the ripple current, icr and switching frequency fs, The AC
inductance is given as,
(3)
3. COMPARISON OF CONTROL ALGORITHM
The performance of DSTATCOM depends on the control algorithm used for extraction of reference source current components. In this paper, Back propagation (BP) control algorithm and Synchronous reference frame (SRF)theory techniques are used to extract reference source currents components.
3.1 Back-Propagation Control Algorithm
Fig.2 shows the block diagram of the BP training algorithm for the estimation of reference source currents through the weighted value of load active power and reactive power current components. In this algorithm[1], the phase PCC voltages (Vsa, Vsb, and Vsc), source currents (isa, isb, and isc), load currents (iLa, iLb, and iLc) and dc bus
voltage (Vdc) are required for the extraction of reference source currents (i*sa, i*sb, and i*sc). There are two primary
modes for the operation of this algorithm: The first one is a feed forward, and the second is the BP of error or supervised learning[2]
3.2 Synchronous Reference Frame Method
SRF theory is based on the transformation of currents in synchronously rotating dq frame. Fig.3 shows the basic building blocks of this theory[4]. Sensed inputs Vsa,Vsb, and Vscand iLa, iLb, and iLc are fed to the controller. Voltage
signals are processed by a phase-locked loop (PLL) to generate unit voltage templates (sine and cosine signals). Current signals are transformed to dq frame, where these signals are filtered and transformed back to abc frame
(isa, isb, and isc), which are fed to a sinusoidal PWM signal generator to generate signal switching signals fed to the
© 2019, IRJET | Impact Factor value: 7.211 | ISO 9001:2008 Certified Journal | Page 3320
4. SIMULATION OF DSTATCOM
The parameters are given in appendix. The basic simulation model consists of a source, load, DSTATCOM and control block. The linear load connected is a combination of resistance and inductance in series for each phase and the nonlinear load are three phase uncontrolled and half controlled rectifier with RL load. This DSTATCOM is simulated with the above described Back propagation control algorithm and Synchronous
Reference Frame theory.
4.1 Without DSTATCOM
The simulation is carried out without connecting DSTATCOM to the system with a linear and nonlinear loads.
4.1.1 Linear Load
The output waveforms are shown in Fig.4(a,b and c) shows the Source currents, PCC voltages, and Load currents of a without DSTATCOM in case of linear load condition.
4.1.2 Nonlinear Load
4.1.2.1 Three phase Uncontrolled rectifier with RL load
The output waveforms are shown in Fig.5 (a,b and c) shows the Source currents, PCC voltages, and Load currents of system without DSTATCOM in case of nonlinear load condition
Fig.2 Block diagram of the reference current extraction using Back Propagation control algorithm
S1 S4 S3 S6 S5 S2 Vte Vde WP Wq LPF 1/3
1/3 LPF
iLa iLb
iLc iLa iLb iLc iLa iLb iLc WP
ILap=Wo+iLaUap+iLbUbp+ilcUcp
ZP=f(ILap)
Iap1=W01+WapZap+WapZbp+WcpZcp
Wap1=f(ILap) ILaq1=W01+
iLaUaq+iLbUbq+ilcUcq Z=f(ILaq)
Iaq1=W01+WaqZaq+WaqZbq+WcqZcq Waq1=f(ILaq1)
Wq
Wp Estimation
of phase’B weighted value of Wbp1 and Wbq1 Wq
Wp
Estimation of phase’C weighted value of Wcp1 and Wcq1 Wq + +
+
+ + + WLqAWLpA
Vt
Vdc
PI CONTROLLER
LPF
PI CONTROLLER
K
K
r
Uaq Ubq Ucq
Uap Ubp
© 2019, IRJET | Impact Factor value: 7.211 | ISO 9001:2008 Certified Journal | Page 3321 Fig.3 Block diagram of the control algorithm using Synchronous Reference Frame Method
Fig.4 Outputs waveforms of linear load(without DSTATCOM)(a) Source currents,(b) PCC voltages,(c) Load currents
Fig.5 Outputs waveforms of non linear load
(a) Source currents,(b) PCC voltages,(c) Load currents
(without DSTATCOM)
i
sc*i
sb*i
sa*Switching Signal to VSI
i
qdci
ddci
sai
sbi
scV
saV
sbV
scSin
Cos
I
qI
dIbeta Ialpha
i
sci
sbi
sa3-Phase to 2-Phase clark’s
transformation
Park’s
transformation
LPF
LPF
PLL
Reverse Park’s and Clark’s transformation Hysteresis based
© 2019, IRJET | Impact Factor value: 7.211 | ISO 9001:2008 Certified Journal | Page 3322 (a)
(b)
Fig.6 Waveforms and harmonic spectra of (a) source current of phase “a,” (b) PCC voltage of phase “a,” under nonlinear load (Without DSTATCOM
THD calculation of source current and PCC voltage of phase A is as shown in Fig. 6(a) and 6(b)
respectively. As seen the magnitude of source current is 44.85A and its THD is 21.60%. Similarly the magnitude of PCC voltage of phase A is 330.5V and its THD is 11.09%.
4.2 WITH DSTATCOM
4.2.1 Back Propagation Control Algorithm
Now the DSTATCOM is connected as shown in Fig.1. The performance of the BP algorithm in the time domain for the three phase DSTATCOM is studied for PFC and ZVR modes of operation under linear and nonlinear loads.
4.2.1.1 Performance of DSTATCOM in ZVR Mode
© 2019, IRJET | Impact Factor value: 7.211 | ISO 9001:2008 Certified Journal | Page 3323
4.2.1.1.1 Linear Load
Fig.7 Output waveforms (Back propagation control) of
Linear Load(a) Source current, (b)PCC voltages, (c)Loadscurrents (ZVR mode)
Fig.8 DC Link voltage (Back propagation control) of
Linear Load (ZVR mode)
Fig.9 Amplitude of PCC Voltage(ZVR mode)
© 2019, IRJET | Impact Factor value: 7.211 | ISO 9001:2008 Certified Journal | Page 3324
[image:8.595.174.418.113.300.2]4.2.1.1.2 Nonlinear Load
Fig.10 Output waveforms (Back propagation control) of Non Linear Load (a) Source current, (b)PCC voltages, (c)Loads
[image:8.595.178.421.404.670.2]current (ZVR mode)
Fig.10 shows the PCC voltage, load currents, and source currents.
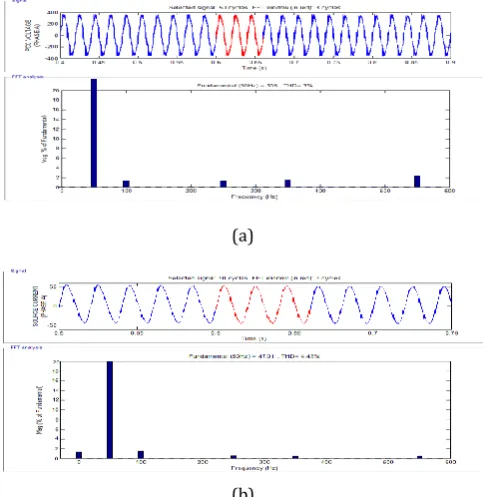
(a)
(b)
Fig .11 Waveforms and harmonic spectra of (a) PCC voltage of phase “a,” (b) source current of phase “a,” in ZVR mode
© 2019, IRJET | Impact Factor value: 7.211 | ISO 9001:2008 Certified Journal | Page 3325 may be seen that the harmonic distortions of the source current and PCC voltage are within the IEEE-519 standard limit of 5%. Table I shows the summarized simulation results demonstrating the performance of DSTATCOM. These results show satisfactory performance of DSTATCOM for harmonic elimination of nonlinear loads.
4.2.1.2 Performance of DSTATCOM in PFC Mode
The dynamic performance of a VSC-based DSTATCOM is studied for PFC mode under linear and nonlinear loads conditions
4.2.1.2.1 Linear Load
Fig.12 Output waveforms (Back propagation control) of Linear Load(a) Source current, (b)PCC voltages, (c)Loads currents(PFC mode)
4.2.1.2.2 Nonlinear Load
© 2019, IRJET | Impact Factor value: 7.211 | ISO 9001:2008 Certified Journal | Page 3326
(a)
[image:10.595.176.422.90.414.2](b)
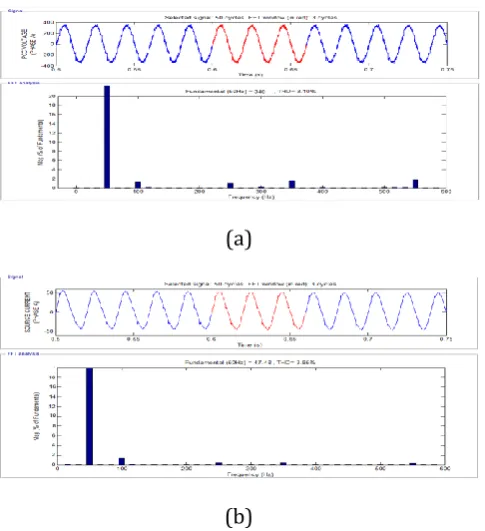
Fig .14 Waveforms and harmonic spectra of (a) PCC voltage of phase “a,” (b) source current of phase “a,” under nonlinear load(With DSTATCOM) in PFC mode
The waveforms of non linear load for the phase “a” voltage at PCC(Vsa), source current (isa), and load current (iLa)
are shown in Fig. 14(a)–(b), respectively. The total harmonic distortion (THD) of the phase “a” at PCC voltage and source current are found to be 2.50%, and 3.43% , respectively. It is observed that the DSTATCOM is able to perform the function of harmonic elimination with high precision.
4.2.2 Synchronous Reference Frame (SRF)Theory
4.2.2.1 Linear Load
[image:10.595.178.417.592.701.2]© 2019, IRJET | Impact Factor value: 7.211 | ISO 9001:2008 Certified Journal | Page 3327
[image:11.595.176.415.150.268.2]4.2.2.2 Nonlinear Load
Fig.16 Output waveforms (SRF theory) of Non Linear Load with DSTATCOM(a) Source current, (b)PCC voltages, (c)Loads currents
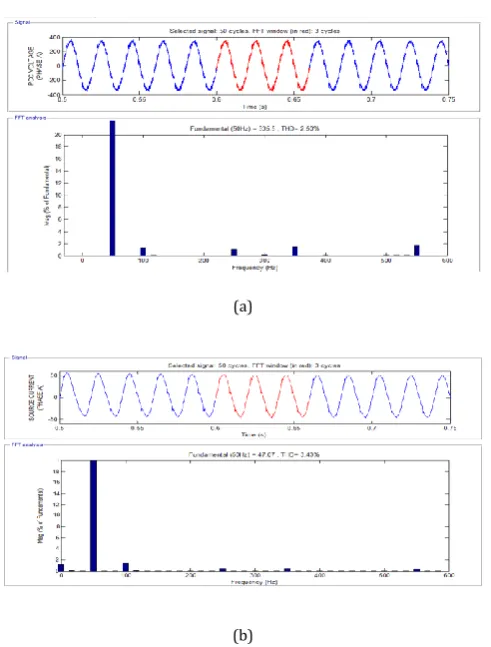
(a)
(b)
Fig .17 Waveforms and harmonic spectra of (a) PCC voltage of phase “a,” (b) source current of phase “a,” under nonlinear load(With DSTATCOM) using SRF theory
The waveforms of the phase “a” voltage at PCC and source current are shown in Fig. 17(a)–(b), respectively. The total harmonic distortion (THD) of the phase “a” at PCC voltage and source current are found to be 3%, and 4.45% , respectively. It is observed that the DSTATCOM is able to perform the function of harmonic elimination with high precision
5. CONCLUSION AND FUTURE SCOPE
[image:11.595.176.421.304.553.2]© 2019, IRJET | Impact Factor value: 7.211 | ISO 9001:2008 Certified Journal | Page 3328 voltage and power factor of linear and nonlinear loads. In case of nonlinear load, the THD of source currents are reduced with the help of DSTATCOM. In case of linear load the THD’s of Voltage and currents are increased but within acceptable limits whereas both the voltage and current are regulated. The gating signals are generated by a Sinusoidal PWM technique. From the simulation results it can be concluded that Back propagation control algorithm provides a better performance in both the cases when compared to SRF theory. calculating the weights of hidden layer for desired output is important in BP control technique.
The future work on this project can be carried out by using Hysteresis PWM technique and SVPWM technique for the generation of pulses. And also comparison of other theories like Symmetrical component theory, Sliding Mode control, cross correlation theory etc. can be carried out. And also the experimental analysis can be done in a laboratory by developing a prototype model of DSTATCOM for these two methods.
APPENDIX
AC supply source: three-phase, 415 V (L-L), 50 Hz.
Source impedance: RS= 0.04 Ω and LS= 2 mH.
Loads:
Linear Load: 10KVA, 0.8 pf lag ,
Nonlinear Load:
1. Uncontrolled rectifier with R = 13Ωand L = 200 mH.
2. Half controlled rectifier with R = 13Ωand L = 200 mH
Rating of VSC = 10 kVA.
Switching frequency of inverter = 10 kHz
Reference dc bus voltage: 700 V
DC bus Capacitance(Cdc)=4000ufarad
Interfacing inductor (Lf) = 2.75 mH
Gains of PI controller for dc bus voltage: kpd= 3.1 and kid=0.9
Gains of voltage PI controller: kpd= 2.95 and kid= 4
Selected initial weights: W0= 0.4 and W01 = 0.2
Learning rate (μ) = 0.6
Cut off frequency of low-pass filter used in dc bus voltage = 15 Hz
Cut off frequency of low-pass filter used in ac bus voltage = 10 Hz.
© 2019, IRJET | Impact Factor value: 7.211 | ISO 9001:2008 Certified Journal | Page 3329
Linear Load- Wap=Wbp=Wcp=0.4
Waq=Wbq=Wcq=0.6
Non Linear Load-1. Uncontrolled rectifier with RL load
Wap=Wbp=Wcp=0.35
Waq=Wbq=Wcq=0.605
TABLE-1
PERFORMANCE OF DSTATCOM
TYPE OF LOAD PARAMETERS WITHOUT
DSTATCOM
WITH DSTATCOM
BP CONTROL ALGORITHM SRF THEORY
ZVR MODE PFC MODE
LINEAR LOAD (RL LOAD) SOURCE CURRENT (A,THD) 13 A (0 %) 13.9 A (0.8 %) 13.7 A (0.87 %) 13.85 A (0.93 %) PCC VOLTAGE (V,THD) 234 V (0 %) 239.6 V (0.61 %) 237 V (0.7 %) 237 V (0.8 %)
NON LINEAR LOAD
(UNCONTROLLED RECTIFIER WITH RL LOAD) α=0° SOURCE CURRENT (A,THD) 31.7 A
(21.60 % )
© 2019, IRJET | Impact Factor value: 7.211 | ISO 9001:2008 Certified Journal | Page 3330
REFERENCES
[1].Bhim Singh and Sabha Raj Arya “Back-Propagation Control Algorithm for Power Quality Improvement Using DSTATCOM”. VOL. 61, NO. 3, MARCH 2014
[2].Jung and G. N. Wang, “Pattern classification of back-propagation algorithm using exclusive connecting network,” J. World Acad. Sci., Eng. Technol., vol. 36, pp. 189–193, Dec. 2007
[3].C. Ying and L. Qings heng, “New research on harmonic detection based on neural network for power system,” in Proc. 3rd Int. Symp. Intell. Inf.Technol. Appl., 2009, vol. 2, pp. 113–116
[4].B. Singh and J. Solanki, “A comparison of control algorithms for DSTATCOM,” IEEE Trans. Ind. Electron., vol. 56, no. 7, pp. 2738–2745, Jul. 2009
[5].Understanding FACTS: Concepts and technology of flexible ac transmission systems by Narain G. Hingorani and Laszlo Gyugyi
[6].Bhim Singh, Jitendra Solanki “A Comparison of Control Algorithms for DSTATCOM,” IEEE Transactions on Industrial Electronics, vol. 56, no. 7, July 2009.
[7].Kullan, M., Muthu, R., Mervin, J.B. and Subramanian, V. (2016) Design of DSTATCOM Controller for Compensating Unbalances. Circuits and Systems, 7, 2262-2272
[8].Facts controllers in power transmission and distribution by K.R. Padiyar.
[9].Power Quality Enhancement Using Custom Power Devices by Arindam Ghosh.
[10]. R. C. Dugan, M. F. Mc Granaghan, and H. W. Beaty, Electric Power Systems Quality, 2nd ed. New York, NY, USA: McGraw-Hill, 2006