CELLULASE PRODUCTION BY
FERMENTATION: STATISTICAL OPTIMIZATION OF PROCESS PARAMETERS
*
Poonam Sangwan and Rajesh Dhankhar
Bioremediation Lab, Department
ARTICLE INFO ABSTRACT
Response
applied in the optimization of process parameters. Box
process parameters that significantly affect cellulase production. The exp
optimum conditions of incubation time (5.5 days), temperature (32.50C), pH (5.5), spore suspension (1.75ml) for solid state fermentation that led to the maximum production of cellulase at a level of 86.34 IU/gds. Good correlation wa
the present model was applicable to production of cellulase enzyme efficiently.
Copyright © 2016, Poonam Sangwan and Rajesh Dhankhar
permits unrestricted use, distribution, and reproduction in any medium, provided the original work is properly cited.
INTRODUCTION
Lignocellulosic feedstock is among the most plentiful complex organic carbons in form of plant biomass. Lignocellulosic biomass includes forestry, agricultural and agro
wastes. Lignocellulosic biomass is a great potential resource for the production of biofuels because it is largely abundant, inexpensiveandproductionof such resources is environmentally sound. It mainly consists of three types of polymers cellulose, hemicelluloses and lignin that are strongly intermeshed and chemically bonded by non-covalent forces and by covalent cross linkage (Ali et al., 2012). Cellulases are association of free enzymes, including endoglucanases, exoglucanases and cellobiohydrolases, which are found in many of the glycosyl hydrolase families. Cellulases catalyze the hydrolysis of cellulose, which is the principle component of the cell wall of most plants. Simple, efficient and economical proc
conversion of cellulose to glucose by enzymatic hydrolysis would aid in decreasing pollution. Microbial cellulases are used currently in food industries, paper pulp industry and animal feed industries (Guo et al., 2008). The genus of
has been especially famous for producing cellulolytic enzymes with relatively high enzymatic activity (Morton, 1987).
*Corresponding author: Poonam Sangwan,
Bioremediation Lab, Department of Environmental Sciences, M.D.U Rohtak-124001, Haryana, India.
ISSN: 0975-833X
Article History:
Received 14th January, 2016
Received in revised form 10th February, 2016
Accepted 07th March, 2016
Published online 26th April,2016
Key words:
Eicchornia crassipes, Rice husk, Solid State fermentation, Box-Behnken design, Response surface methodology.
Citation: Poonam Sangwan and Rajesh Dhankhar
optimization of process parameters”, International Journal of Current Research
RESEARCH ARTICLE
CELLULASE PRODUCTION BY
TRICHODERMA ATROVIRIDE
UNDER SOLID STATE
FERMENTATION: STATISTICAL OPTIMIZATION OF PROCESS PARAMETERS
Poonam Sangwan and Rajesh Dhankhar
Department of Environmental Sciences, M.D.U Rohtak-124001, Haryana, India
ABSTRACT
Response surface methodology (RSM) is a powerful and efficient mathematical approach widely applied in the optimization of process parameters. Box-Behnken design was applied to elucidate the process parameters that significantly affect cellulase production. The exp
optimum conditions of incubation time (5.5 days), temperature (32.50C), pH (5.5), spore suspension (1.75ml) for solid state fermentation that led to the maximum production of cellulase at a level of 86.34 IU/gds. Good correlation was observed between the actual and predicted results indicated that the present model was applicable to production of cellulase enzyme efficiently.
Poonam Sangwan and Rajesh Dhankhar. This is an open access article distributed under the Creative Commons Att
use, distribution, and reproduction in any medium, provided the original work is properly cited.
among the most plentiful complex organic carbons in form of plant biomass. Lignocellulosic forestry, agricultural and agro-industrial wastes. Lignocellulosic biomass is a great potential resource for the production of biofuels because it is largely abundant, of such resources is environmentally of three types of polymers cellulose, hemicelluloses and lignin that are strongly intermeshed and covalent forces and by covalent Cellulases are association of ases, exoglucanases and cellobiohydrolases, which are found in many of the glycosyl hydrolase families. Cellulases catalyze the hydrolysis of cellulose, which is the principle component of the cell wall of most plants. Simple, efficient and economical processes for conversion of cellulose to glucose by enzymatic hydrolysis would aid in decreasing pollution. Microbial cellulases are used currently in food industries, paper pulp industry and animal 2008). The genus of Trichoderma
has been especially famous for producing cellulolytic enzymes with relatively high enzymatic activity (Morton, 1987).
Bioremediation Lab, Department of Environmental Sciences, M.D.U
Solid state fermentation (SSF) is a way of fermenting substrate in the presence of excessive moisture in growth medium in spite of large amount of water being provided. SSF is an environmental friendly (less waste water production), low energy required and economical technology in synthesizing cellulase enzyme in response to submerged fermentation (Pandey, 2003). Response surface methodology (RSM) is a statistical technique for the optimization of multiple variables, which determine optimum process condit
experimental designs with interpolation by first or second polynomial equations in a sequential testing procedure. Response surface methodology (RSM) analyzes
defined independent variables on the response without the need for prior knowledge of a predetermined relationship between the response function and the variables (Shankar and Isaiarasu, 2012).The aim of this study was to obtain a high yield of cheap cellulase by using Trichoderma atroviride
fermentation and also exploiting waste like
crassipes and Rice husk. This study will help in proper disposal of wastes resulting in resolution of the environmental problems.
MATERIALS AND METHODS
Preparation of substrate
Eicchornia crassipes is an aquatic plant collected from local pond near by Rohtak city and rice husk is collected from Rice
International Journal of Current Research
Vol. 8, Issue, 04, pp.29177-29182, April, 2016
INTERNATIONAL
Poonam Sangwan and Rajesh Dhankhar, 2016. “Cellulase production by Trichoderma atroviride under Solid state fermentation: Statistical
International Journal of Current Research, 8, (04), 29177-29182.
UNDER SOLID STATE
FERMENTATION: STATISTICAL OPTIMIZATION OF PROCESS PARAMETERS
124001, Haryana, India
surface methodology (RSM) is a powerful and efficient mathematical approach widely Behnken design was applied to elucidate the process parameters that significantly affect cellulase production. The experiment established the optimum conditions of incubation time (5.5 days), temperature (32.50C), pH (5.5), spore suspension (1.75ml) for solid state fermentation that led to the maximum production of cellulase at a level of s observed between the actual and predicted results indicated that the present model was applicable to production of cellulase enzyme efficiently.
the Creative Commons Attribution License, which
Solid state fermentation (SSF) is a way of fermenting substrate in the presence of excessive moisture in growth medium in spite of large amount of water being provided. SSF is an environmental friendly (less waste water production), low nd economical technology in synthesizing cellulase enzyme in response to submerged fermentation (Pandey, 2003). Response surface methodology (RSM) is a statistical technique for the optimization of multiple variables, which determine optimum process conditions by combining experimental designs with interpolation by first or second polynomial equations in a sequential testing procedure. methodology (RSM) analyzes the effects of defined independent variables on the response without the need or prior knowledge of a predetermined relationship between function and the variables (Shankar and Isaiarasu, The aim of this study was to obtain a high yield of cheap
Trichoderma atroviride through solid state tation and also exploiting waste like Eicchornia
and Rice husk. This study will help in proper disposal of wastes resulting in resolution of the environmental
AND METHODS
is an aquatic plant collected from local pond near by Rohtak city and rice husk is collected from Rice
INTERNATIONAL JOURNAL OF CURRENT RESEARCH
milling industries and processed to particle size of 1mm, mixed and washed with distilled water and dried at 600C for 8 h in the oven. Processed substrates were collected in the polythene covers and stored at room temperature.
Microorganisms
The microorganism Trichoderma atroviride was procured from Institute of microbial Technology (IMTECH) Chandigarh. The strain was well preserved in our laboratory. A spore suspension was obtained for each organism by growing them on potato dextrose agar at 300C for one week and harvesting the spores with sterile water containing 0.1% Tween-80.
Medium and culture conditions
Erlenmeyer conical flasks (250ml) containing substrate 5g and Mendel’s media (10ml) of following composition (g/L) (NH4)2SO4 (1.4gm), KH2PO4 (2gm), CaCl2.2H2O (0.4gm),
MgSO4.7H2O(0.6gm),Urea(0.3gm),Proteasepeptone (0.75gm),
Yeast extract (10g), COCl2.6H2O (3.7mg), FeSO4.7H2O (5mg),
MnSO4.7H2O (1mg), Zinc Sulphate (1.4gm), Tween 80 (2ml)
were sterilized at 1210C for 20 min. After cooling, each flask was seeded with the inoculums concentration (0.5-3ml), initial pH (3-8), temperature (25-400C), incubation period (3-8 days) defined by the experimental design and in a shaker at 200 rpm for throughout the incubation periods. Thereafter, the enzyme was extracted by adding 50ml of 50mM citrate buffer pH 4.8 under shaking at 200 rpm on a rotary shaker and at 300C for 60min. The resultant slurry was filtered through a muslin cloth and centrifuged at 10000 rpm for 15min at 40C, and the supernatant was used as crude enzyme source for cellulase.
Enzyme assay
The fortitude of Cellulase activity was examined according to the method of Ghose (Ghose, 1987). In test tubes, 0.5ml of 1% CMC was added with 0.5ml diluted enzyme was incubated at 500C for 30min. The reaction was terminated by addition of 2ml DNSA (Dinitrosalicyclic acid) reagent and tubes were kept at boiling water bath for 5min (Chang et al., 2011). After cooling the tubes at room temperature, 10ml distilled water was added in each tube. The intensity of the colour was read at 540nm in UV-VIS spectrophotometer. Standard curve was performed with glucose solution. One unit of enzyme activity was defined as the amount of enzyme required for release 1μ mol of glucose per minute under assay condition.
Experimental design
The experimental design and statistical analysis were performed on Box-Behnken design with quadratic model was employed to study the combined effect of four independent variables namely incubation period (A, days), Temperature (B,
0
C), pH (C), spore suspension (D, ml) for the dependent variables such as cellulase (U/gds) production using Design-Expert software (version 9, Stat-Ease Inc., Minneapolis, USA). A total no. of 29 experimental runs given by this design. The dependent variables was expressed individually as a function of the independent variable known as response function. This
design is interpreted by a second-order polynomial regression model as follows:
Y = β0 + ∑ βi Ai + ∑ βii Ai 2
+ ∑ βij AiAj
Where, Y is the measured response (cellulase yield), β0 the
constant, βi the linear coefficient, βii the quadratic coefficient,
βij the cross product coefficient Ai and Aj are the levels of the
independent variable.
Data analysis
Regression analysis and estimation of the coefficients were performed using Design-Expert software (version 9, Stat-Ease Inc., Minneapolis, USA). The quality of the fitted model was expressed by the coefficient of determination R2, and its statistical significance was checked by F-test.
RESULTS AND DISCUSSION
Optimization of Cellulase production by Trichoderma
atroviride using response surface methodology
RSM based on the Box-Wilson, which was used to optimize different parameters for cellulase production, 29 experimental runs with different combinations of four factors were carried out. The variables such as incubation time, Temperature, pH, spore suspension that influence cellulase production in solid state fermentation (SSF) using RSM (Table1). The effect of each factor and their interaction were analyzed using the analysis of variance (ANOVA) (Table2).The calculated regression equation for the optimization of parameters for production of cellulase i.e. CMCase (Y, U/gds) is a function of the incubation period (A, days), temperature (B, 0C), pH (C), spore suspension (D, ml). By applying multiple regression analysis on the experimental data, the following second order polynomial equation was found to explain the cellulase production as shown below:
Cellulase (U/gds) 82.06 - 0.39A – 0.32B - 1.37C + 0.80 D +3.03A*B + 0.70 A*C – 2.65A*D + 7.99 B*C – 0.44 B*D + 2.10 C*D – 15.61A2 – 13.22B2 – 14.95C2 – 11.75D2 ...Equation (1)
This is because higher temperature (above 32.5°C) alters the cell membrane composition and stimulates protein catabolism,
thus causes the cell death (Sherief et al., 2010). The effect of
pH was studied by varying the pH from 3 to 8 using appropriate buffers. It was found that enzyme has got activity over a broad range of pH (Fig. 2). Enzymes have an optimum pH, at which their activity is maximum; at higher or lower pH values, their activity decreases (Jahangeer et al., 2005). Inoculum size (or spore suspension) certainly has an effect on the cellulase production. In the present study, effect of the size of inoculum was also explored (Fig.2).
The maximum enzyme production was at 1.75mL of spore suspension of Trichoderma atroviride. The decrease in cellulase production with further increase in inoculums might be due to depletion of nutrients by the enhanced biomass, which resulted dwindle in metabolic activity (Kashyap et al.,
2002). A balance between the increasing biomass and accessible nutrient would yield an optimal production of enzyme (Ramachandran et al., 2004). The predicted levels of cellulase production in substrate using the above equations are given in Table 1 along with the experimental data. Several indicators were used to evaluate the adequacy of the fitted model i.e., Determination coefficient (R2), Coefficient of variation (CV), Model significance (F-value). The quadratic regression model illustrate that Equation 1 are highly significant statistical models for Cellulase production responses in substrate, as it was evident from the Fisher’s F-test with a very low probability value [(P model >F) (Table 2). The p-value is a tool for evaluating the significance and contribution of each parameter.
[image:3.595.114.484.84.388.2]Fig. 1. Predicted VS Actual values for Cellulase
Table 2. ANOVA for the experiment
Term Response Y, Cellulase
F-value 4.71
P>F 0.0032
R2 0.825
Mean 59.08
Adjusted R2 0.65
Adequate precision 6.96
Coefficient of variance (%) 12.56
Lack of fit 18.30
Model term having values of Prob > F less than 0.05 are considered significant, whereas those greater than 0.10 are insignificant (Zahangir et al., 2008).ANOVA indicated the R2 -value of 0.825 respectively, for responses Y.
Actual
Pr
e
d
ict
ed
Predicted vs. Actual
30 40 50 60 70 80 90
30 40 50 60 70 80 90
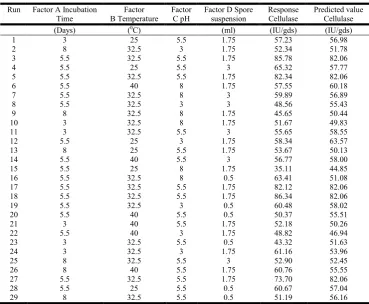
Table 1. Result of BBD showing observed and predicted response for Cellulase
Run Factor A Incubation Time
Factor B Temperature
Factor C pH
Factor D Spore suspension
Response Cellulase
Predicted value Cellulase
(Days) (0C) (ml) (IU/gds) (IU/gds)
1 3 25 5.5 1.75 57.23 56.98
2 8 32.5 3 1.75 52.34 51.78
3 5.5 32.5 5.5 1.75 85.78 82.06
4 5.5 25 5.5 3 65.32 57.77
5 5.5 32.5 5.5 1.75 82.34 82.06
6 5.5 40 8 1.75 57.55 60.18
7 5.5 32.5 8 3 59.89 56.89
8 5.5 32.5 3 3 48.56 55.43
9 8 32.5 8 1.75 45.65 50.44
10 3 32.5 8 1.75 51.67 49.83
11 3 32.5 5.5 3 55.65 58.55
12 5.5 25 3 1.75 58.34 63.57
13 8 25 5.5 1.75 53.67 50.13
14 5.5 40 5.5 3 56.77 58.00
15 5.5 25 8 1.75 35.11 44.85
16 5.5 32.5 8 0.5 63.41 51.08
17 5.5 32.5 5.5 1.75 82.12 82.06
18 5.5 32.5 5.5 1.75 86.34 82.06
19 5.5 32.5 3 0.5 60.48 58.02
20 5.5 40 5.5 0.5 50.37 55.51
21 3 40 5.5 1.75 52.18 50.26
22 5.5 40 3 1.75 48.82 46.94
23 3 32.5 5.5 0.5 43.32 51.63
24 3 32.5 3 1.75 61.16 53.96
25 8 32.5 5.5 3 52.90 52.45
26 8 40 5.5 1.75 60.76 55.55
27 5.5 32.5 5.5 1.75 73.70 82.06
28 5.5 25 5.5 0.5 60.67 57.04
[image:3.595.343.526.610.700.2]
Figure 2A. Figure 2B.
Figure 2C. Figure 2D.
Figure 2E. Figure 2F.
Figure 2. A-F. Three dimensional response plots for Cellulase activity showing interactive effects of variables Design-Expert® Software
Factor Coding: Actual CMCase (IU/gds)
Design points above predicted value Design points below predicted value 86.34
35.11
CMCase (IU/gds) = 35.11 Std # 15 Run # 15 X1 = A: Incubation Day = 5.5 X2 = B: Temperature = 25
Actual Factors C: pH = 8 D: Spore suspension = 1.75
25 28 31 34 37 40 3 4 5 6 7 8 20 30 40 50 60 70 80 90 C MC ase ( IU /g d s)
A: Incubation Day B: Temperature (degree celsius)
Design-Expert® Software Factor Coding: Actual CMCase (IU/gds)
Design points above predicted value
Design points below predicted value
90.43
38.11
X1 = A: Incubation Day X2 = C: pH Actual Factors B: Temperature = 25 D: Spore suspension = 1.75
3 4 5 6 7 8 3 4 5 6 7 8 20 40 60 80 100 C M Case ( IU/ gd s)
A: Incubation Day C: pH
Design-Expert® Software Factor Coding: Actual CMCase (IU/gds)
Design points below predicted value 90.43
38.11
X1 = A: Incubation Day X2 = D: Spore suspension
Actual Factors B: Temperature = 25 C: pH = 8
0.5 1 1.5 2 2.5 3 3 4 5 6 7 8 0 20 40 60 80 100 C MC as e ( IU /gds)
A: Incubation Day D: Spore suspension (ml)
Design-Expert® Software Factor Coding: Actual CMCase (IU/gds)
Design points above predicted value Design points below predicted value 90.43
38.11
X1 = B: Temperature X2 = C: pH
Actual Factors A: Incubation Day = 5.5 D: Spore suspension = 1.75
3 4 5 6 7 8 25 28 31 34 37 40 0 20 40 60 80 100 C MC ase ( IU /gd s)
B: Temperature (degree celsius) C: pH
Design-Expert® Software Factor Coding: Actual CMCase (IU/gds)
Design points above predicted value
Design points below predicted value 90.43
38.11
X1 = B: Temperature X2 = D: Spore suspension Actual Factors A: Incubation Day = 5.5 C: pH = 8
0.5 1 1.5 2 2.5 3 25 28 31 34 37 40 0 20 40 60 80 100 C M C a se ( IU /g d s )
B: Temperature (degree celsius) D: Spore suspension (ml)
Design-Expert® Software Factor Coding: Actual CMCase (IU/gds)
Design points above predicted value Design points below predicted value 90.43
38.11
X1 = C: pH X2 = D: Spore suspension
Actual Factors A: Incubation Day = 5.5 B: Temperature = 25
[image:4.595.43.539.84.705.2]For good statistical model, the R2 value should be in the range of 0-1.0, and the values are obtained in the data analysis indicates the model is good. This again ensured a satisfactory adjustment of the quadratic model to the experimental data, and indicated that the model could explain 80-85% of the variability in the response. The coefficient of variation (CV) indicate the degree of precision with which the experiments are compared. Generally, the higher the value of the CV is, the lower the reliability of the experiment.
Here the value of coefficient of variation is 12.56for responses Y indicate good reliability of the experiment performed (Box et al., 1978). The adequate precision measures the signal to noise ratio. A ratio greater than 4 is desirable. The adequate precision was 6.96 for Y responses that indicates an adequate signal. The lack of fit, F-value of 18.3% for responses Y which is the ratio of mean square due to regression to the mean square due to error and indicates the influence of each controlled factor on tested model, was significant at high confidence level. Non significant lack of fit is good. (Fig.1) shows that the actual response values agree well with the predicted response values of cellulase. The 3D response surface plot described the regression model was drawn to illustrate the combined effects of the independent variables and combined effects of each independent variable upon the response variable. The optimum conditions for maximum production of enzyme production was determined by response surface analysis and also estimated by regression equation. The optimum conditions are namely: Incubation time (5.5 days), Temperature (32.5°), pH (5.5) and spore suspension (1.75 ml). The optimal values for variables as predicted are found to be within design region. This shows that the model correctly explains the influence of the chosen variables on enzyme production. The response surface curves were plotted to understand the interaction of the variables and to determine the optimum levels of each variables for maximum response (Fig 2).
Validation of the model
The suitability of the model equation for predicting the optimum response values was tested using the optimum conditions mentioned above. This set of conditions was determined to be optimum by a RSM optimization approach, which was also used to experimentally validate and predict the value of the responses using model equations. The experimental values were found to be in accord with the predicted ones (Table 1). The cellulase activity reached 86.34 IU/gds for cellulase under the optimal conditions.
Conclusion
In the present work, the applied response surface methodology (RSM) proved to be efficient in optimizing process parameters for cellulase production using a very cheap substrate
Eicchornia crassipes and rice husk. From the optimization studies, the optimum experimental condition are incubation period (5.5 days), temperature (32.50C), pH (5.5) and spore suspension (1.75ml). Using the optimized conditions the maximum cellulase production of 86.34 IU/gds was obtained. Comparison of predicted and experimental values revealed good correlation between them, implying that Box-Behnken
models derived from RSM can be used to adequately describe the relationship between the dependent and independent variables in cellulase production.
Acknowledgements
The authors are grateful for the support provided by the Department of Environmental Sciences, Maharshi Dayanand University, Rohtak, Haryana, India.
Conflict of Interest
The author declare no conflict of interest.
REFERENCES
Aishwarya, V., Ishwarya, M., Rajasekaran, R. and Ranjini, R. 2011. Optimization of fermentation parameters and purification of cellulase with cellulose (paper) as substrate. Advance Biotech,10(09): 40–42.
Box, G.E.P., Hunter, W.G. and Hunter, J.S. 1978. Statistics for Experimenters, John Wiley & Sons, New York, NY, USA. Chang, X.G., Yang, J. and Wang, D. 2011. Box-Behnken design: an alternative for the optimization of analytical methods. Chemical products and process modelling.6: Article 14.
Ghose, T.K. 1987. Waste management in pulp & paper industry waste pure. Applied chemistry, 59: 257-268. Guo, R., Ding, M., Zhang, S.L., Xu, G.J. and Zhao, F.K. 2008.
Purification and characterization of two endo-1,4-glucanases from mollusc, ampullaria crossean.
Comparative Biochemistry and Physiology, Part B,
Biochemistry & Molecular Biology.178:209-215.
Jahangeer, S., Sohail, M., Shahzad, S., Ahmad, A. and Khan, S.A. 2005. Screening and characterization of fungal cellulases isolated from the native environmental source. Pakistan Journal of Botany, 37(3):739–748.
Kashyap, P., Sabu, A., Pandey, A., Szakacs, G. and Soccol, C.R. 2002. Extracellular L-glutaminase production by zygosaccharomyces rouxii under solidstate fermentation. Process Biochemistry, 38(3): 307–312.
Krishna, C. 2005. Critical Reviews in Biotechnology, 25, 1– 30.
Morton J F. 1987. Optimization of cellulase production by
Aspergillus niger and Trichoderma viride using sugarcane waste. Fruits of Warm Climates. 18-28.
Pandey, A. 2003. Solid state fermentation. J biochem Eng.
13:81.
Ramachandran, S., Patel, A.K., Nampoothiri, K.M., Francis, F., Nagy, V., Szakacs, G. and Pandey, A. 2004. Coconut oil cake—a potential raw material for the production of alpha-amylase. Bioresource Technology, 93(2):169-174.
Riswan Ali, S.B., Muthuvelayudham, R., Viruthagiri, T. and Saravanan, P. 2012. Optimization of Nutrients Medium for cellulase and hemicellulase productions from Rice Straw: A Statistical Approach.
Sherief, A.A., El-Tanash, A.B., Atia N. El-Tanash and Atia N. 2010. Cellulase production by Aspergillus fumigatus grown on mixed substrate of rice straw and wheat bran. Research Journal of Microbiology, 5(3): 199–211.
Zahangir A. Md., Suleyman A. M., and Rosmaziah, W. 2008. Statistical optimization of process conditions for cellulase production by liquid state bioconversion of domestic wastewater sludge, Bioresource Technology, 99, pp. 4709-4716.