Printed in Great Britain © The Company of Biologists Limited 1984
PULMONARY MECHANICS AND THE WORK OF
BREATHING IN THE LIZARD, GEKKO GECKO
BY WILLIAM K. MILSOM AND TIMOTHY Z. VITALIS*
Department of Zoology, University of British Columbia, Vancouver, British Columbia, V6T2A9, Canada
Accepted 9 April 1984
SUMMARY
Measurements of pulmonary mechanics made on anaesthetized specimens of the Tokay gecko Gekkogecko (Linn6), indicate that both static and dynamic pulmonary mechanics are dominated by the mechanics of the body cavity and chest wall. The lungs are relatively large and compliant and offer little resistance to air flow at any of the ventilation frequencies (f) used in this study. The body wall is relatively stiff and becomes less compliant with increasing ventilation frequency and with increasing tidal volume ( VT) at the higher frequencies. The vast majority of the work performed in breathing is used to overcome elastic forces in the chest wall resisting lung inflation. This work increases exponentially with increases in volume. As a consequence, in terms of total ventilation, the most economic breathing pattern is a high frequency, low tidal volume pattern in which changes in minute ventilation (VE) are most economically produced solely by changes in f. Because reductions in tidal volume drastically reduce alveolar ventilation volume while dead space remains constant, the same arguments do not apply to alveolar minute ventilation ( VA) . In terms of alveolar minute ventilation, there is an optimum combination of f and VT for each level of VA, with changes in VA being most economically produced by almost equal changes in both f and VT.
INTRODUCTION
In mammals, for each level of alveolar ventilation (VA), there is an optimum combination of tidal volume ( VT) and breathing frequency (f) which minimizes either the mechanical work of breathing (Otis, Fenn & Rahn, 1950) or the average force required from the respiratory muscles to move the lungs (Mead, 1960). It is energetic-ally more expensive to ventilate the lungs at frequencies above or below these 'optimum' rates when corresponding adjustments are made in VT to maintain VA constant. Many studies have now shown that spontaneous breathing patterns in most mammals corres-pond closely with their calculated 'optimal' patterns (Christie, 1953; Agostoni, Thimm & Fenn, 1959; Crosfill & Widdicombe, 1961) particularly under conditions of elevated respiratory drive (Yamashiro, Daubenspeck, Lauritsen & Grodins, 1975).
•Present Address: School of Biological Sciences, University of East Anglia, Norwich, NR4 7TG, United kingdom.
• K e y words: Reptiles, pulmonary mechanics, work of breathing.
188 W. K. MlLSOM AND T . Z. VlTALIS
Unlike the continuous breathing pattern of mammals, most reptiles exhibit 1 periodic or intermittent pattern of breathing in which single breaths or bursts or breaths are separated by breath-holds of varying length (McCutcheon, 1943; Gans & Hughes, 1967; Naif eh et al. 1970; Gans&Clark, 1976; Glass &Johansen, 1976). The primary regulated variable in respiratory responses to temperature change, hypoxia and hypercapnia, in most species, is the breath-hold length or non-ventilatory period
(TNVP) (Glass & Johansen, 1976; Milsom & Jones, 1980; Benchetrit & Dejours, 1980). It is difficult to say to what extent these resting breathing patterns and ventilatory responses reflect the influence of mechanical factors as so little is known of pulmonary mechanics in this group. Static compliances of both isolated lungs and intact respirat-ory systems have been reported for a few species (Jackson, 1971; Cragg, 1978; Gratz, 1978; Hughes & Vergara, 1978; Perry & Duncker, 1978, 1980), and these data indicate that species with relatively stiff lungs (low compliance) tend to utilize a higher frequency and lower tidal volume breathing pattern than species with relatively high lung compliances. This implies that the resting breathing pattern may be strongly influenced by static lung mechanics (Perry & Duncker, 1980). Dynamic pulmonary mechanics, which would also be expected strongly to influence not only the resting breathing pattern but particularly the changes in breathing resulting from changes in respiratory drive, have not yet been described for any reptile. Since this information is essential for a full understanding of the interrelationship between pulmonary mechanics and breathing patterns in this group, the present study was undertaken to provide such data for one species of lizard, the Tokay gecko.
METHODS
Experiments were performed at room temperature (22—23 °C) on nine Tokay geckos (Gekko gecko) (36-151 g) anaesthetized by intraperitoneal injection of 25-30mgkg"1 sodium pentobarbital (Somnotol, MTC Pharmaceuticals).
Static pressure-volume measurements
In all nine animals, an intratracheal cannula possessing a sidearm for pressure measurements was inserted into the trachea, just below the larynx, through a mid-ventral incision which was then sewn closed.
Journal of Experimental Biology, Vol. 113
Fig. 1
Lungs
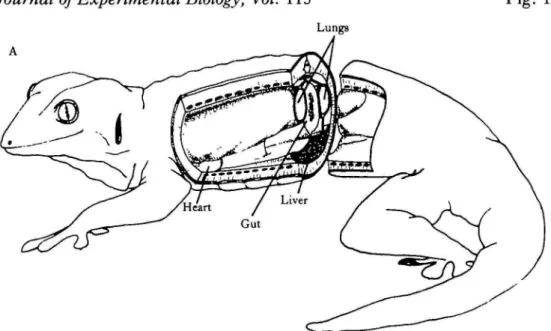
Fig. 1. (A) Schematic diagram of a Tokay gecko to show the location of the lungs in the body cavity and their relationship to the viscera and the body wall. (B) Dry cast of the lungs cut in longitudinal section to show internal structure; magnification, Xl-62.
fcshion, beginning with the chest cavity equilibrated to atmospheric pressure and the animal, again, in the normal supine position.
In these three animals the body wall was then widely resected and the animals eviscerated. Then, starting from VLR the steady state pressure changes associated with a stepwise inflation, deflation and reinflation sequence of the exposed lungs, were recorded. The exposed lungs were periodically swabbed with saline throughout this procedure to prevent drying.
Dynamic pressure-volume measurements
In five of the remaining lizards, following the static pressure-volume measurements of the intact system, the tracheal cannula was connected to a pneumotachograph (Fleisch no. 00) which was in turn connected to a Harvard small animal respirator (Harvard Inc., Millis, Mass., U.S.A.). The pressure drop across the pneumotacho-graph screen during tracheal air flow was monitored with a Validyn DP 103-18 dif-ferential pressure transducer and this air flow signal was fed through a Gould integrat-ing amplifier to give tidal volume. Intratracheal pressure was recorded as described for the static pressure-volume measurements. All measurements of pressure, flow and volume were continuously recorded on a Gould 6 channel chart recorder and the pressure and volume signals were also plotted on an Esterline Angus XY plotter. During pump ventilation, for any given lung volume, intratracheal pressure was always greater during inflation than during deflation. When volume was plotted against pressure on x,y coordinates, through a complete pump cycle, a counterclock-wise rotating hysteresis loop was produced (Fig. 3A). Inflation volumes of 0-5—4 ml and ventilation frequencies of 3—120 min'1 were used in random sequence, to produce a spectrum of such dynamic pressure-volume loops.
In three lizards, a mid-ventral incision was then made just anterior to the vent and a large bore tube (5 mm i.d.) was inserted into the thoraco-abdominal cavity, as described earlier. This tube was then connected to the pneumotachograph and res-pirator and air flow and inflation volume were again recorded, along with abdominal cavity pressure (recorded as described above) during pump ventilation of the thoraco-abdominal cavity at frequencies between 3 and 120 min"1 with a tidal volume of 2 ml. Pressure and volume were again plotted on x,y coordinates to produce pressure-volume loops of each ventilation cycle. The lungs were collapsed during this procedure.
All values given in this paper are means ± S.E.
RESULTS
Anatomical observations
190
W. K . MlLSOM AND T . Z . VlTALISPressure
- 6
(cmH2O)
-4 A
m
l 10
0
g"
1)
I
Vol
u
J
/
108
-
6-4"
A
\
A
1
Lungs
/
/ /
Y/
2 /2
— 2
- - 4
Lungs + chest
^ / ^ Chest
f
4 o 8
Fig. 2. Static pressure-volume diagrams from one animal for the lungs, chest wall and lung and chest wall together. Volume is expressed both in absolute values (left axis) (xero volume is defined in the text) and as multiples of the resting lung volume. Arrows indicate the path of inflation and deflation.
The lungs are not enclosed in a pleural cavity but lie along the dorsal surface of the pleuroperitoneal cavity, held in place by thin mesopneumonia. A dorsal mesop-neumonium connects the dorsomedial surface of each lung to the dorsal body wall while a smaller ventral mesopneumonium anchors the ventromedial lung -surface to the liver and underlying viscera (Fig. 1). These connections do not hinder the free movement of the lungs but do establish the resting lung volume when the system is open to the atmosphere.
Static pressure-volume measurements
Fig. 2 depicts sample static pressure-volume curves derived from one animal. Static compliance of the body wall (CB) , lungs (CL) and intact system (total compliance, CT) were taken as the mid-range slope of the pressure-volume curves obtained during step inflation of the body cavity, lungs and intact system respectively. Based on data collected from all animals, VLR was 6-3 ± 1-OmllOOg"1 (N=9) and the average
values for CL, CB and C T were 2 0 - 0 ± 3 0 (N=3), 1-45 ±0-5 (AT = 3 ) and 1-55 ± O^mlcmHzO"1 lOOg"1 respectively. Because of the high compliance of the lung, the compliance of the total system closely reflects the compliance of the body wall.
Dynamic pressure-volume measurements
Work of breathing in lizards
B
191
Pressure (cm H2O)
Fig. 3. (A) Schematic diagram of the pressure-volume relations of the intact respiratory system during a ventilation cycle. The loop begins at A and is generated by a point, moving with time, in a counter-clockwise direction. See text for details. (B) Effects of increasing tidal volume from 0-5 to 2'5 ml 100 g~' on pressure-volume loops produced at a constant ventilation frequency of 30min"' in one individual. (C) Effects of increasing ventilation frequency from 10 to 90min~' on pressure-volume loops produced for a constant tidal pressure-volume of 2ml 100g"' in the same individual as in (B).
192
W. K. MiLSOM AND T . Z. VlTALIS
0-8-~
0-6-I O
re
J,
5 °'
4"
o.
I
o
0-2-20
i- 24
40 60
{(min"1)
80 100
- 5 '
s
-1)
o
Static
10
0 1 3 4 5
Pressure
Work of breathing in lizards
193
100
10" •5
s
1
-4 = > V T
0-5
- f
10 100 1000
VE(mlmin"')
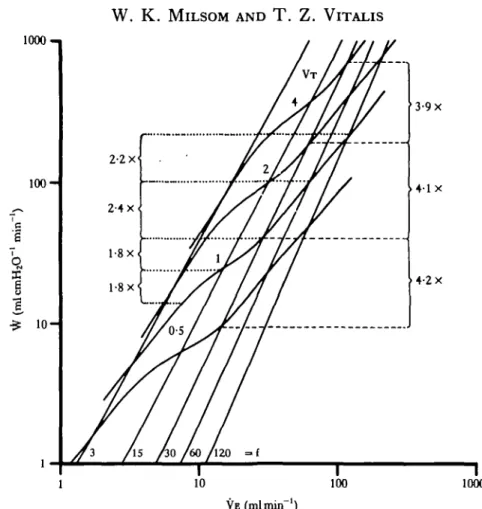
Fig. 5. The relationship between the total work breath ' (W) and minute ventilation (VE) for dif-ferent combinations of tidal volume (VT in ml) and respiratory frequency (f in breaths min"'). Data points represent average values from five animals and vertical bars represent ± 1 S.E.M.
animals, deflation is a passive event, the pressure and volume falling along the line
CEA in Fig. 3A and being powered by the elastic energy stored during lung inflation.
Thus the total work of an entire ventilation cycle is equal to the work required to overcome elastic and non-elastic forces during inflation. The magnitude of each of these components of work was determined by measuring the respective areas represented graphically by planimeter. Minute work is simply the product of the total work per breath multiplied by the number of breaths per minute.
Fig. 3B shows data collected from a single animal illustrating the effects of increas-ing inflation volume at a constant ventilation frequency on dynamic pressure-volume loops and in Fig. 3C, the effects of increasing ventilation frequency at a constant tidal volume are shown for the same animal. The changes in slope of the hysteresis loops, so evident in Fig. 3C, are indicative of changes in the dynamic compliance of the respiratory system. The changes in dynamic compliance recorded over the entire range of tidal volumes (VT) and breathing frequencies (f) used in these studies,
194
W. K. MlLSOM AND T . Z. VlTALISderived from the mean values taken from all five animals, are shown in Fig. 4A Standard error bars have been included for only one tidal volume curve in this figure, for clarity, but were quantitatively similar for each curve. At the lowest ventilation frequencies (<10min~1), increases in tidal volume lead to an increase in dynamic compliance (a decrease in stiffness), whereas at high ventilation frequencies (>60min~1) increases in tidal volume lead to a decrease in dynamic compliance (increase in stiffness). For tidal volumes between 0 5 and 2 ml, dynamic compliance is relatively volume-independent over a frequency range from 30-50 min"1 (Figs 3B, 4A). For any given tidal volume, increasing frequency leads to a decrease in dynamic compliance, an effect which is accentuated with increasing tidal volume. In the series of curves in Fig. 4B, the peak pressures associated with lung inflation of various tidal volumes at 10, 40 and 90 breaths min"1 are plotted along with the static pressure-volume curve for comparison. In these curves, the slopes (dotted lines) connecting the data points to the origin of each curve, represent dynamic compliance. The origins of each of the frequency curves have been artificially set to zero pressure and volume. As ventilation frequency increases, the time available for passive expiration decreases. As a consequence, each time ventilation frequency is increased, there is a transient
V T
-70
-90
O
12 30 60 120
90-
30-10- S
%*•
II
- 1 0
•70
- 9 0
VT = 0-5 1 2 3 4 0 - 5 1 2 3 4 0 - 5 1 2 3 4 0 - 5 1 2 3 4 0 - 5 1 2 3 4
Fig. 6. The percentage of total work required to overcome non-elastic forces (stippled bars, left hand axis, read from bottom to top) and elastic forces (clear bars, right hand axis, read from top to bottom). In the upper panel, the effects of increasing ventilation frequency (f) from 3 to 120 min"1 are shown
Work of breathing in lizards
195
phase during which expiration is less than the previous inflation, leading to a small increase in end-expiratory lung volume (functional residual capacity, FRC). This increase in FRC also increases the elastic recoil of the lung which promotes an increase in expiratory air flow returning the system to equilibrium (expiration = inspiration). The actual starting values for each curve are depicted by open circles on the static pressure-volume curve. All three points fall on the relatively linear portion of this curve. As a consequence, the decreases in dynamic compliance associated with in-creasing frequency cannot have been caused by shifting the starting point of each ventilation to a volume at which the system as a whole is stiffer, but — as seen by the shape of each curve — must be the result of a genuine increase in dynamic compliance.
In the three animals for which the body cavity alone was ventilated at increasing frequencies, but only for a single tidal volume, similar changes in dynamic compliance were observed. These results would suggest that the changes in dynamic compliance recorded here represent changes in the mechanics of the body wall.
Increasing tidal volume at any given ventilation frequency, produces a straight line on the log.log plot shown in Fig. 5, indicating that there is an exponential increase in the work breath"1. The curves produced by increasing ventilation frequency at each tidal volume, are more complex. Each curve shows an initial range, at low frequencies (<10min~') in which the work breath"1 increases with increasing frequency. This is followed by a range in which the work breath"1 stabilizes or actually decreases as
ID-JO 7 O
1
-i .
• Lungs
PI
10
I I I I 100 f (mm"1)
196
W. K. MlLSOM AND T . Z. VlTALISlOOO-i
1 0 0
-J,
1 0
-2-2 X
3-9 x
41 x
4-2 x
ft 20
10 100 1000I
YE (mlmin ')
Fig. 8. The relationship between minute work (W) and minute ventilation (VE) for different com-binations of ventilation volume (VT in ml) and frequency (f min"1). The effects on minute work of doubling VE by increasing f at a constant V T of 1 ml are shown by the numbers and dotted lines on the left side of the figure while the effects of doubling VE on minute work by increasing V T at a constant f of 30 min"1 are shown by the numbers and dashed lines on the right side of the figure.
frequency increases, and this in turn gives rise to a third range in which the work breath"1 again increases with further increases in ventilation frequency (>60 min"1). The overall slope of each tidal volume curve increases with tidal volume.
Non-elastic work plays a much smaller role in the generation of total work, than does elastic work (Fig. 6). The contribution of non-elastic work to total work decreases slightly as tidal volume increases at ventilation frequencies above 12 mm"1 but, in general, decreases substantially as ventilation frequency increases (above 12min~') for any given tidal volume.
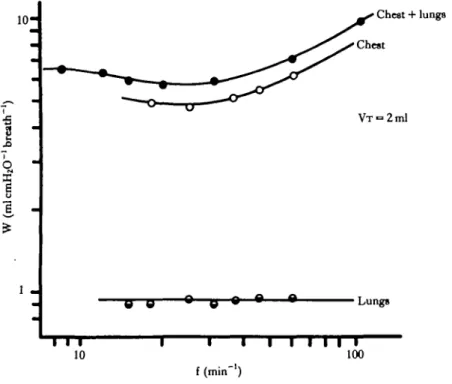
Data obtained from the dynamic pressure-volume loops of the isolated chest (Fig. 7) indicate that the relationships observed between the work breath"1 and ventilation frequency and tidal volume, recorded in the intact animal, primarily reflect the dynamic properties of the chest wall rather than any inherent mechanical properties of the lung itself. The calculated cost of ventilating the lung alone is low and frequency-independent over the range studied here.
Work of breathing in lizards
1972 0 0
-
150-
100-
50-10
30 60 90 120
f (min-i)
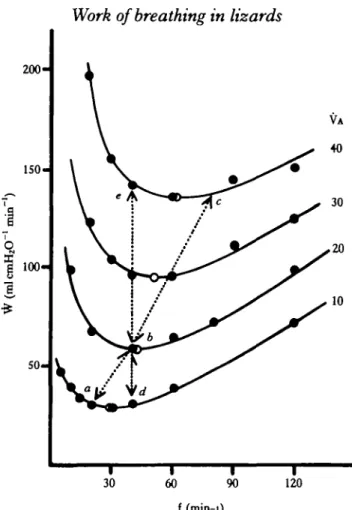
Fig. 9. Relationship between minute work (W) and ventilation frequency (f) for several levels of alveolar minute ventilation (VA in mlmin"1100g~'). Closed circles represent data points derived from Fig. 5, as described in the text and the open circles denote the value of f for which each curve exhibits its minimum value of W. Points a, b and c represent a V T of 1 ml on each respective curve. Points d, b and e are points of equal ventilation frequency. The effects on \V of increasing VA by doubling V T at constant f, or doubling f at constant V T are represented by the vertical distance between points of equal f or equal VT, respectively, on each VA curve.
the work required to produce a single breath (W) and the number of breaths taken each minute (f). It can be seen from this figure, that the work required to produce any given level of minute ventilation (VE) is less the higher the ventilation frequency and the lower the tidal volume. Furthermore, increases in VE are most economically effected by increasing breathing frequency, rather than increasing tidal volume. As illustrated in Fig. 8, a doubling of VE, brought about solely by doubling ventilation frequency, ata VTof 1 ml, will increase minute work 1-8 to 2-4 times. If VE is doubled, solely by increasing VT, at a ventilation frequency of 30 min"1, minute work increases by 3-9 to 4-2 times.
198 W. K. MlLSOM AND T . Z. VlTALIS
(±0-03) ml lOOg"1, recorded for these animals (Milsom, 1984). It can be seen fromj this figure that for each level of VA, there is a single combination of f and VT for which W is minimum. For any given level of VA, the relationship described here can be represented by the equation W = (60f/2CL) (VT)2.
In Fig. 9, the consequences of doubling VA by increasing ventilation frequency alone or by increasing alveolar ventilation volume alone are also shown. Both methods of increasing alveolar minute ventilation lead to increases in minute work of 1-8 to 2-3 times. The least expensive way of increasing VA, i.e. the changes associated with the transition between the optimum patterns associated with each level of VA, involves roughly equal changes in both f and VT.
D I S C U S S I O N
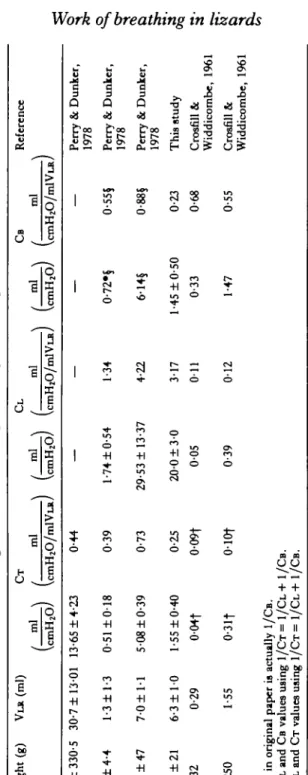
Given the extremely simple structure of the lungs of the Tokay gecko (Fig. 1) (Perry & Duncker, 1978), all viscoelastic properties of the lung must reside in the outer lung wall. The static pressure-volume relationships reveal that these lungs are extremely compliant, so much so that the total compliance of the intact respiratory system is almost identical to the compliance of the body wall (CT = CB) (Fig. 2). Our values of CB and C T are somewhat lower than those previously reported for this species (Perry & Duncker, 1978) but in general, are consistent with values reported for other species of lizards possessing unicameral lungs (Table 1). In mammals of similar size (Table 1), values reported for CB are similar to those reported for lizards but the lungs are, in comparison, extremely stiff and consequently, CT, the compliance of the total intact system, is much lower.
The dynamic compliance of the respiratory system of the gecko, is frequency-dependent. For any tidal volume, the higher the ventilation frequency, the stiffer the behaviour of the system, an effect which is enhanced by increasing tidal volume. This decrease in compliance (increasing stiffness) with increasing frequency appears to be due solely to viscoelastic properties of the body wall.
Table 1. Mean lung volumes and compliances of vanbus species Spacia Weight (g) VLR (ml) CT CL CB Reference ml ml ml ml ml
(a)
(C~H~O/~~YLR)()
(mHlO/mlVu)(z)
(cmHIO/mlvu Teju lizard 701 f 330.5 30.7 f 13.01 13.65+
4.23 044 - - - - Perry & Dunker,9
01978
3-
Gran lizard 28 f 4.4 1.3 f 1.3 0.51 f 0.18 0.39 1.74 f 0.54 1.34 0.72.3 0.551 Perry & Dunkcr,%
1978 p 0.73 29.53+
13.37 4.22 6.149 d Tokay lizard 108 f 47 7.0+
1.1 5.08 f 0.39 0.883 Perry & Dunker, h@o) 1978e
5
100 f 21 6.3 f 1.0 1.55 f 0.40 0.25 20.0 f 3.0 3.17 1.45 f 0.50 0.23 This study
3. 00
200 W. K. MlLSOM AND T . Z. VlTALIS
increasing tidal volume is much greater at high ventilation frequencies than at lo\^ frequencies. This is also evident in the work breath"1 curves (Fig. 5).
The work required to produce each breath is primarily expended in overcoming forces associated with movement of the body cavity and chest wall. Elastic forces account for most of this work. The work required to move the lung is relatively small (<15% of total work) and frequency-independent, implying that non-elastic work associated with resistance to air flow is negligible in the gecko lung over the range of ventilation frequencies used in this study.
For any given ventilation frequency, the work required to produce each breath increases as an exponential function as tidal volume increases. This appears to be due to the material properties of the body cavity and chest wall, and this effect is slightly accentuated at higher breathing frequencies due to the decreased dynamic com-pliance. Elastic work accounts for roughly 70 to 85 % of the total work and this fractional contribution tends to increase slightly, although not significantly, as VT increases at higher ventilation frequencies.
The relationship between the work per breath and breathing frequency for any given tidal volume is complex and indicative of a multicomponent system with more than one time constant. As ventilation frequency increases from 0 to 10 breaths min"', the work breath"1 also increases. Over the range of ventilation frequencies from 10 to 30 breaths min"1, however, work breath"1 decreases slightly. At ventilation frequen-cies above 60 min"1, work breath"1 again increases with increasing frequency. This latter increase is more pronounced at larger tidal volumes. Increases in the non-elastic work breath"1 with increasing frequency are not surprising, and would be expected to be larger at higher tidal volumes and ventilation frequencies. The decrease in work breath"1 over the mid range from 10 to 30 breaths min"1 is surprising particularly as it is almost exclusively due to a decrease in non-elastic work. Over this range of ventilation frequencies there is an apparent decrease in the viscoelasticity of the body cavity and chest wall. At present, we are unable to account for this effect.
The results of the work breath"1 measurements indicate that it is relatively expen-sive to increase tidal volume and that increases in ventilation frequency are a more economical way to increase VE. This is even more evident from the minute work curves. For any given VE, the higher the breathing frequency and lower the tidal volume, the less the cost of breathing. Increases in VE brought about solely by increasing f are half the cost of similar increases in VE brought about solely by increasing VT. These results are consistent with theoretical predictions for a purely elastic system. This correlates well with the fact that the work required to overcome elastic forces accounts for 70-85 % of the total work in this system.
Work of breathing in lizards 201
each level of VA there is an optimum combination of f and VA (and hence VT) where the work of breathing is minimum. It is of interest that for the levels of VA calculated here, increases in f and VT are equally efficient means of increasing VA.
In mammals, pulmonary mechanics are most strongly influenced by the mechanics of the lungs. Both elastic and non-elastic forces are important in generating the work required for breathing. The non-elastic forces required to overcome resistance to air flow predominate at higher ventilation frequencies. In lizards, both static and dynamic mechanics are most strongly influenced by the mechanics of the body cavity and chest wall. The vast majority of the work of breathing is required to overcome elastic forces alone, whatever the ventilation frequency. Despite these striking differences between the pulmonary mechanics of each group, in both groups there is an optimum combina-tion of f and VT at which minute work is at a minimum for each level of VA. These optima represent an interaction between pulmonary mechanics and the relative costs of dead space ventilation, and it would appear that such relationships hold for species with vast differences in pulmonary mechanics. The physiological significance of these results to the normal breathing pattern in the Tokay gecko will be considered in the following paper.
The authors wish to thank Dr Peter Pare for his advice and suggestions and Dr John Gosline for his patient and valuable assistance throughout the data analysis and writing of this paper. This study was supported by grants from the Natural Sciences and Engineering Council of Canada and the Natural, Applied and Health Sciences Committee of the University of British Columbia.
R E F E R E N C E S
AGOSTONI, E., THIMM, F. F. & FENN, W. O. (1959). Comparative feature* of the mechanics of breathing.
J. appl. Physiol. 14, 679-683.
BENCHETWT, B. & DEJOURS, P. (1980). Ventilatory CO2 drive in the tortoise Testudo horsfeldi.J. exp. Biol. 87, 229-236.
CHRISTIE, R. V. (1953). Dyspnoea in relation to the visco-elastic properties of the lungs. Proc. R. Soc. Med. 46, 381-386.
CRAGG, P. A. (1978). Ventilatory patterns and variables in rest and activity in the lizard, Lacerta. Comp.
Bhchem. Phyiiol. 60A, 399-410.
CROSFILL, M. L. & WIDDICOMBE, J. G. (1961). Physical characteristics of the chest and lungs and the work of breathing in different mammalian species. J. Physiol., hand. 158, 1—14.
GANS, C. & C L A M , B. (1976). Studies on ventilation of Caiman crocodilus (Crocodilia: Reptilia). Retpir.
Physiol. 26, 285-301.
GANS, C. & HUGHES, G. M. (1967). The mechanism of lung ventilation in the tortoise Testudograeca Linne.
J. exp. Biol. 47, 1-20.
GLASS, M. & JOHANSEN, K. (1976). Control of breathing in Acrockordus javamcus, an aquatic snake. Pkysiol.
Zool. 49, 328-340.
GRATZ, R. K. (1978). Ventilation and gas exchange in the diamondback water snake, Natrix rhombifera.
J. comp. Physiol. 1ZJ, 299-305.
HUGHES, G. M. & VERGARA, G. A. (1978). Static pressure-volume curves for the lung of the frog (Rana
pipiens).J. exp. Biol. 76, 149-165.
JACKSON, D. C. (1971). Mechanical basis for lung volume variability in the turtle, Pseudemys scripta elegans.
Am.J. Physiol. 220, 754-758.
MCCUTCHEON, F. H. (1943). The respiratory mechanism in turtles. Physiol. Zool. 16, 255-269. MEAD, J. (1960). Control of respiratory frequency. J. appl. Physiol. 15, 325-336.
MILSOM, W. K. (1984). The interrelationship between pulmonary mechanics and spontaneous breathing pattern in the Tokay lizard, Gekko gecko. J. exp. Biol. 113, 203-214.
202 W. K. MILSOM AND T . Z. VITALIS
NAIFEH, K. H., HOGGINS, S. E., H O F F , H. E., H U G G , T . W. & NORTON, R. E. (1970). Respiratory patterns
in crocodilian reptiles. Respir. Pkysiol. 9, 31-42.
O n s , A. B. (1954). The work of breathing. Physiol. Rev. 34, 449-458.
O n s , A. B. (1964). The work of breathing. lnHandbook of Physiology, Section 3, Vol. 1, Respiration, (eds W. O. Fenn & H. Rahn). Washington D.C.: American Physiological Society.
O n s , A. B., F E N N . W . O. &RAHN, H. (1950). The mechanics of breathing in man. J. appl.Physiol. 2, 592-607. PERKY, S. F . & DUNCKER, H. R. (1978). Lung architecture, volume and static mechanics in five species of
lizards. Respir. Physiol. 34, 61-81.
PERRY, S. F. & DUNCKER, H. R. (1980). Interrelationship of static mechanical factors and anatomical structure in lung evolution. J. comp. Physiol. 138, 321—334.
YAMASHIRO, S. M., DAUBENSPECK, J. A., LAURITSEN, T . N. & GRODINS, F . S. (1975). Total work rate of