University of Warwick institutional repository: http://go.warwick.ac.uk/wrap
This paper is made available online in accordance with
publisher policies. Please scroll down to view the document
itself. Please refer to the repository record for this item and our
policy information available from the repository home page for
further information.
To see the final version of this paper please visit the publisher’s website.
Access to the published version may require a subscription.
Author(s): N. J. GAY, A. J. VYSE, F. ENQUSELASSIE, W. NIGATU and
D. J. NOKES
Article Title: Improving sensitivity of oral fluid testing in IgG prevalence
studies: application of mixture models to a rubella antibody survey
Year of publication: 2003
Link to published
Improving sensitivity of oral fluid testing in IgG prevalence
studies: application of mixture models to a rubella
antibody survey
N. J. G A Y1
*, A. J. V Y S E1
, F. E N Q U S E L A S S I E2
, W. N I G A T U3
A N D D. J. N O K E S4# 1
Immunisation Division, PHLS Communicable Disease Surveillance Centre, 61 Colindale Avenue, London NW9 5EQ, UK
2
Department of Community Health, Faculty of Medicine, University of Addis Ababa, Addis Ababa, Ethiopia 3Department of Infectious and Other Disease Research, Ethiopian Health and Nutrition Research Institute, Addis Ababa, Ethiopia
4Department of Biological Sciences, University of Warwick, Coventry CV4 7AL, UK
(Accepted 19 October 2002)
S U M M A R Y
A method for the analysis of age-stratified antibody prevalence surveys is applied to a previously reported survey of antibody to rubella virus using oral fluid samples in which the sensitivity of the assay used was shown to be compromised. The age-specific distribution of the quantitative results of antibody tests using oral fluids is modelled as a mixture of strong positive, weak positive and negative components. This yields maximum likelihood estimates of the prevalence at each age and demonstrates that, when used in conjunction with mixture modelling techniques, the results of antibody prevalence studies using oral fluids accurately reflect those obtained using sera.
I N T R O D U C T I O N
The aim of an age-stratified serological survey is to determine the prevalence of antibody to a specific in-fection in all age groups [1]. Of particular use in the study of viral transmission and population immunity is the measurement of long lasting IgG antibody in a population. Traditionally serum has been the specimen of choice for such surveys, but blood collection is in-vasive, hazardous, and relatively expensive, requiring specially trained staff to perform the procedure using sterile equipment. A sample that is simple, safe and cheap to collect is more desirable, especially for popu-lation immunity studies where large numbers of speci-mens need to be easily and economically obtained [2]. Oral fluid is a feasible non-invasive alternative to serum for this purpose as it is very simple, safe and cheap to collect and contains immunoglobulins reflecting those
found in serum. The major drawback is that antibodies are present at considerably lower concentrations in oral fluid and so require particularly sensitive assays. In the context of viral-specific IgG, with the exception of assays for human immunodeficiency virus type 1 (HIV-1) [3] , there is some concern that the technology used in current protocols to detect specific antibody in oral fluid are not sensitive enough to enable oral fluid assays to replace serum assays [4 –7].
Samples may be tested for the presence of antibody using a variety of laboratory techniques, ELISA being the most commonly used. Many assays also enable results to be expressed numerically, assumed pro-portional to the quantity of the specific antibody in the sample. When assays are used on an individual basis, perhaps for diagnostic purposes or pre-vaccination screening, samples need to be categorized as positive (containing specific antibody), negative (containing no specific antibody) or equivocal (further tests necess-ary). Cut-off values are set to define the boundaries of these zones. Setting cut-off values is not straight-forward unless there is clear separation of results into
* Author for correspondence : CDSC, 61 Colindale Avenue, London NW9 5EQ, UK.
positive and negative peaks. When using oral fluids it is often difficult to distinguish between negative samples and those with low levels of specific antibody. How-ever, when conducting a serological survey it may be sufficient only to determine accurately the proportion seropositive at each age – individual results are only of interest for the contribution they make to the overall picture (unless, for example, there is interest in identi-fying predictors of serological status). In this setting, an alternative approach is to derive the prevalence from the age-specific distribution of results, rather than using cut-offs to categorize each sample [8].
Mixture models provide an appropriate method for the analysis of the distribution of results, since the samples are taken from a mixture of individuals who have experienced infection and those who have not [8]. In this study we describe the application of mixture models to a previously reported survey of rubella virus antibody in a rural Ethiopian population using oral fluid samples [7]. Results from paired serum samples were also available. Using a fixed cut-off, the sensitivity of the oral fluid assay relative to the serum results was shown to decrease with increasing age of subject, from more than 90 % in those aged less than 10 years to just 65 % above age 40 years [7]. We investigated whether analysing the results using an appropriate mixture model would overcome this apparent lack of sensi-tivity, enabling oral fluid samples to be used success-fully to investigate population immunity.
M E T H O D S
Data
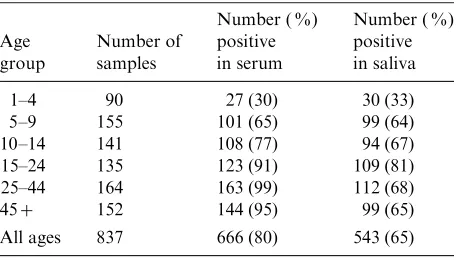
The serological data used here are taken from the re-sults of a survey of IgG antibody to rubella virus in a rural Ethiopian population [7] designed to determine the potential of oral fluid to replace serum for the evaluation of population immunity levels. The data comprise 837 optical density (OD) ratios (the OD reading divided by that given by a reference serum sample) obtained using an ‘ in house ’ amplified IgG antibody capture ELISA (GACELISA) [4] to screen oral fluid samples from persons aged 1–84 years. In-dividual results were aggregated into six age groups (1–4, 5–9, 10–14, 15–24, 25–44 and 45 years or more) by 20 reactivity categories (equal width bands based on the log(OD ratio)). In the original study [7] these re-sults were categorized as positive or negative using a fixed cut-off [4] (Table 1). Rubella virus-specific IgG results from paired serum samples using a commercial
[image:3.592.305.533.110.240.2]ELISA (Behring Enzygnost, Dade-Behring, Milton Keynes, UK), classified using the fixed cut-off rec-ommended by the manufacturer, were also available (Table 1).
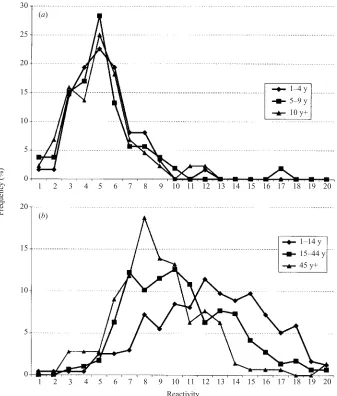
The age-stratified distribution of results for oral fluid samples was considered in comparison to those from the paired sera. The distribution of reactivity observed in samples for which the paired serum was negative was shown to be independent of age and approximated a Normal distribution (Fig. 1a). In samples for which the paired serum was positive the mean reactivity de-creased with age (Fig. 1b). This information was used to motivate our choice of mixture model below.
Model
In constructing a mixture model, it is assumed that samples in the survey were taken from individuals with one of several different immune statuses. The simplest model has just two statuses, uninfected and previously infected. It is assumed that for each status the anti-body results can be described by some distribution. If the parameters of these distributions (e.g. mean and standard deviation for a Normal distribution) and the proportion of samples with each status were known, the overall distribution of antibody results could be determined. Mixture modelling takes the inverse ap-proach and estimates the distribution parameters for each status and the proportion of samples with each status by fitting the overall distribution of results.
For the present analysis, a mixture model was con-structed to estimate the prevalence of rubella virus antibody using data from the oral fluid samples on the assumption that each individual had one of three statuses : negative, weak positive and strong positive. The proportion of samples with each status was as-sumed to be age-dependent. For a given status, the Table 1. Age-specific prevalence of rubella virus anti-body in paired serum and saliva samples using a fixed cut-off
Age group
Number of samples
Number ( %) positive in serum
Number ( %) positive in saliva
1–4 90 27 (30) 30 (33)
5–9 155 101 (65) 99 (64)
10–14 141 108 (77) 94 (67)
15–24 135 123 (91) 109 (81)
25–44 164 163 (99) 112 (68)
45+ 152 144 (95) 99 (65)
All ages 837 666 (80) 543 (65)
distribution of results in the oral fluid assay was as-sumed to be independent of age, and to follow a Normal distribution. Age-related changes in reactivity of samples from infected persons are reflected in the model by changes in the relative proportions weak and strong positive. In all 18 parameters (12 describing the proportions in each component for each age group and 6 describing the mean and standard deviation of the 3 component distributions) were estimated from 120 data points (the distribution of results in the 6 age groups). Details of the parameter estimation procedure are given in the appendix.
R E S U L T S
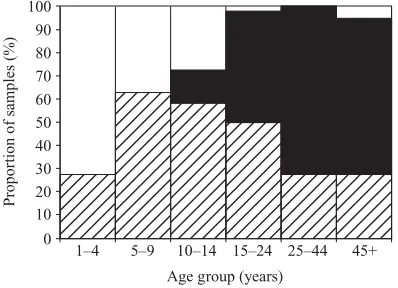
The proportions of samples attributed by the mix-ture model to the negative, strong positive and weak
positive components are shown in Figure 2. The prevalence of previous infection is calculated as the sum of the strong and weak positive components. The estimated distribution of results within each com-ponent is shown in Figure 3.
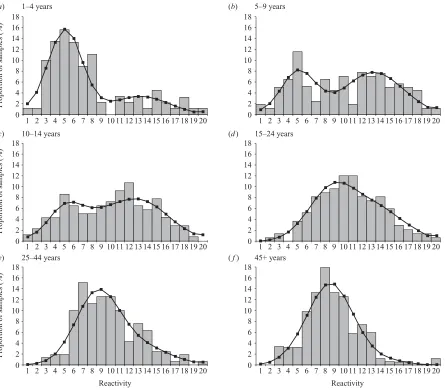
The model provided a good fit to the data, which is shown in Figure 4 and reflected by the deviance (D=97.75 on 102D.F.). Clearly defined positive and
negative distributions can be seen for young children, but these become progressively obscured at older ages. The proportion uninfected estimated by the model (Table 2) is compared to the proportion negative for rubella virus antibody in the original study using both oral fluids and matching sera (Fig. 5). The model estimates are very similar to the serum results, and overcome the lack of sensitivity associated with use of a fixed cut-off in the oral fluid assay.
1 2 3 4 5 6 7 8 9 10 11 12 13 14 15 16 17 18 19 20
0 5 10 15 20 25 30
1–4 y 5–9 y 10 y+
1 2 3 4 5 6 7 8 9 10 11 12 13 14 15 16 17 18 19 20
0 5 10 15 20
1–14 y
15–44 y 45 y+
Reactivity (a)
F
requenc
y (%)
[image:4.592.129.466.68.464.2](b)
A model using a single Normal component to model the infected population provided a significantly worse fit than the model with two (weak and strong) positive components (D=212.80 on 110 D.F., P<0.00001).
Allowing the parameters of this distribution (mean and standard deviation) to take different values in each age group improved the fit (D=115.82 on 100D.F.), but it
was still considerably worse than the fit for the model with weak and strong positive components. Modelling the uninfected population with a Gamma distribution rather than a Normal distribution had little effect on the fit of the model or the estimated prevalence.
D I S C U S S I O N
This study confirms the potential of age-specific mix-ture models as a tool for the analysis of population-based seroprevalence studies, in particular those that utilize oral fluids rather than serum. In such studies individual test results are only of importance for their contribution to the overall prevalence. Therefore it is not necessary to use a cut-off to categorize individual
samples as positive or negative, but rather use an age-specific mixture model to analyse the distribution of the quantitative results to provide a direct estimate of the age specific prevalence [8]. The prevalence estimates from the age-specific model with three component distributions applied to oral fluid data were in close agreement with results from matching sera using a commercial assay, which may be con-sidered to represent the true prevalence of rubella virus antibody in the population studied.
The principal decisions in conducting a mixture model analysis involve the number of components to use and the choice of distribution for each component. In this analysis, we were able to base our choices on the distribution of reactivity observed in oral fluid samples for which the result on the paired serum was known. As a compromise between simplicity and flexibility, we did not attempt to model the mechanism of decaying antibody levels, only to describe the distribution result-ing from this process. We thus modelled the infected population as a mixture of strong positive and weak positive Normal components. The importance of in-cluding the ‘ weak positive ’ component is demon-strated by the greatly improved fit over a model with just positive and negative components. The increase with age in the proportion of positives in the ‘ weak positive ’ component, particularly noticeable after age 15 years, reflects the decay of rubella specific antibody levels in persons infected many years previously as observed in other studies [4–7]. The approach of using strong and weak positive components to introduce flexibility into the infected distribution worked well in this study because the distribution of results for the uninfected population did not change with age (Fig. 1a). In a situation where the distribution of re-sults from the uninfected population was also age-dependent (especially if the mean increased with age, perhaps due to acquisition of cross-reacting anti-bodies) it may be necessary to model the mechanisms producing these effects, rather than employing such an heuristic device.
The availability of serum results in this study di-rected the construction of the mixture model by en-abling us to confirm the validity of our assumptions regarding the distribution of reactivity in infected and uninfected individuals. The serum results, however, were not used in the parameter estimation process. Future studies using the same oral fluid assay in un-vaccinated populations may be conducted using oral fluid samples only, without the need for paired serum samples.
Propor
tion of samples (%)
1–4 5–9 10–14 15–24 25–44 45+
0 10 20 30 40 50 60 70 80 90 100
[image:5.592.75.274.70.214.2]Age group (years)
Fig. 2.Estimated proportion of samples negative%, weak positive&and strong positive by age group.
Reactivity
1 2 3 4 5 6 7 8 9 10 11 12 13 14 15 16 17 18 19 20 0
5 10 15 20 25
F
requenc
y (%)
Strong positive Weak positive Negative
Fig. 3.Estimated distribution of reactivity in the oral fluid assay for negative, weak positive and strong positive samples.
[image:5.592.62.289.251.394.2]A variety of IgG assays designed specifically for use with oral fluids are available for a range of other acute self-limiting virus infections [9–14]. Due to decaying IgG over time since exposure, it is likely that these will also experience difficulty in distinguishing weak posi-tive and negaposi-tive results due to a combination of the low concentration of immunoglobulins found in oral
fluids and limitations in current immunoassay detec-tion systems. When using a fixed cut-off value, data from prevalence studies utilizing oral fluids are likely to
1–4 years
1 2 3 4 5 6 7 8 91011121314151617181920 1 2 3 4 5 6 7 8 9 1011121314151617181920
Reactivity Reactivity 0 2 4 6 8 10 12 14 16 18 0 2 4 6 8 10 12 14 16 18 0 2 4 6 8 10 12 14 16 18 0 2 4 6 8 10 12 14 16 18 0 2 4 6 8 10 12 14 16 18 0 2 4 6 8 10 12 14 16 18 (a)
10–14 years (c)
25–44 years (e)
5–9 years (b)
15–24 years (d)
45+ years (f)
Propor
tion of samples (%)
Propor
tion of samples (%)
Propor
tion of samples (%)
[image:6.592.78.523.67.457.2]1 2 3 4 5 6 7 8 91011121314151617181920 1 2 3 4 5 6 7 8 9 1011121314151617181920 1 2 3 4 5 6 7 8 91011121314151617181920 1 2 3 4 5 6 7 8 9 1011121314151617181920
[image:6.592.308.529.485.629.2]Fig. 4.Distribution of reactivity in the oral fluid assay by age group : observed data (bars) and model fit (line).
Table 2. Maximum likelihood estimates(95 % CI)of the age-specific proportion of negative samples
Age group
Proportion negative ( %)
1–4 73 (54–83)
5–9 37 (27–47)
10–14 27 (17–39)
15–24 2 (0–11)
25–44 0 (0–10)
45+ 5 (0–18)
Propor
tion ne
gati
v
e (%)
1–4 5–9 10–14 15–24 25–44 45+
0 20 40 60 80 100
Oral fluid: fixed cut-off Serum
Oral fluid: mixture model
Age group (years)
[image:6.592.58.286.513.620.2]be compromised and not accurately reflect those using sera, particularly in older age groups. However, this study has demonstrated that an accurate estimate of age-specific antibody prevalence can be achieved if mixture models are applied to results from population immunity studies using oral fluids. This therefore brings a step nearer the realization of using oral fluids to replace serum for prevalence studies, enabling the compliance advantages of oral fluids to be fully exploited for this purpose.
A C K N O W L E D G E M E N T S
Support for data collection was provided by a Well-come Trust Project grant (ref. no. 047413).
A P P E N D I X – D E S C R I P T I O N O F T H E M I X T U R E M O D E L
The reactivityxin the oral fluid assay was defined as the logarithm of the OD ratio. Individual results are aggregated into 120 data points comprising 6 age groups (1–4, 5–9, 10–14, 15–24, 25–44 and 45 years or more) by 20 reactivity categories : njk denotes
the number of results from person in age group j
(j=1, …, 6) falling in the kth reactivity category (xkx1<xfxk: x0=x1, x20=1, xk=x0.5+0.1k
fork=1, …, 19).
Mixture model
Let fx(x), fw(x), fs(x) denote the distributions for
the negative, weak positive and strong positive components respectively. Let pxj , pwj , psj denote the proportion of samples from the negative, weak positive and strong positive components respectively in age groupj(pxj +pw
j +psj=1). Then the overall density of
results at agej,fj, is a mixture of the three component
densities,
fj(x)=pxj fx(x)+pjwfw(x)+psjfs(x):
Parameter estimation
LetNjdenote the number of individuals of agej, so that
Nj=Sknjk. Then (nj,1, …,nj,20) is multinomial with
in-dexNjand probabilitiespjk, where
pjk=
Z xk
xkx1
fj(x) dx:
Maximum likelihood estimates for the parameters were obtained by minimizing the devianceD
D=2X
6
j=1
X20
k=1
njk log njk pjk Nk
:
Likelihood-based 95 % confidence intervals for the age specific prevalence were obtained by finding the maximum and minimum values for which the deviance was within 3.84 of the minimum (Table 2).
R E F E R E N C E S
1. Morgan-Capner P, Wright J, Miller C, Miller E. Sur-veillance of antibody to measles, mumps and rubella by age. B M J 1988 ;297: 770–772.
2. Mortimer P, Parry J. Non-invasive virological diagnosis : are saliva and urine specimens adequate substitutes for blood ? Rev Med Virol 1991 ;1: 73–78.
3. Malamud D. Oral diagnostic testing for detecting human immunodeficiency virus-1 antibodies : a tech-nology whose time has come. Am J Med 1997 ;102: 9–14. 4. Vyse A, Brown D, Cohen B, Samuel R, Nokes DJ. Detection of rubella virus-specific immunoglobulin G in saliva by an amplification-based enzyme-linked immunosorbent assay using monoclonal antibody to fluorescein isothiocyanate. J Clin Microbiol 1999 ;37: 391–395.
5. Nokes DJ, Nigatu W, Abebe A, et al. A comparison of oral fluid and serum for the detection of rubella-specific antibodies in a community study in Addis Ababa, Ethiopia. Trop Med Int Health 1997 ; 3: 258–267.
6. Nokes DJ, Enquselassie F, Vyse A, Nigatu W, Cutts F, Brown D. An evaluation of oral-fluid collection devices for the determination of rubella antibody status in a rural Ethiopian community. Trans Roy Soc Trop Med Hyg 1998 ;92: 679–685.
7. Nokes DJ, Enquselassie F, Nigatu W, et al. Has oral fluid the potential to replace serum for the evaluation of population immunity levels ? A study of measles, rubella and hepatitis B in rural Ethiopia. Bull WHO 2001 ;79: 588–595.
8. Gay NJ. Analysis of serological surveys using mixture models : application to a survey of parvovirus B19. Stat Med 1996 ;15: 1567–1573.
9. Nigatu W, Nokes DJ, Enquselassie F, et al. Detection of measles specific IgG in oral fluid using an FITC/ anti-FITC IgG capture enzyme linked immunosor-bent assay (GACELISA). J Virol Meth 1999 ; 83: 135–144.
10. Parry J, Perry K, Panday S, Mortimer P. Diagnosis of hepatitis A and B by testing saliva. J Med Virol 1989 ;
28: 255–260.
11. Perry K, Brown D, Parry J, Panday S, Pipkin C, Richards A. Detection of measles, mumps and rubella
antibodies in saliva using antibody capture radio-immunoassay. J Med Virol 1993 ;40: 235–240.
12. Rice P, Cohen B. A school outbreak of parvovirus B19 infection investigated using salivary antibody assays. Epidemiol Infect 1996 ;116: 331–338.
13. Vyse A, Knowles W, Cohen B, Brown D. Detection of IgG antibody to Epstein–Barr virus viral capsid antigen
in saliva by antibody capture radioimmunoassay. J Virol Meth 1997 ;63: 93–101.
14. Wang J, Adler S. Salivary antibodies to cytomegalovirus (CMV) glycoprotein B accurately predict CMV infec-tions among preschool children. J Clin Microbiol 1996 ;