Malays J Med Sci. Sep–Oct 2017; 24(5): 101–105 To cite this article: Arifin WN, Zahiruddin WM. Sample size calculation in animal studies using resource equation approach. Malays J Med Sci. 2017;24(5):101–105. https://doi.org/10.21315/mjms2017.24.5.11
To link to this article: https://doi.org/10.21315/mjms2017.24.5.11
Abstract
Animal research plays an important role in the pre-clinical phase of clinical trials. In animal studies, the power analysis approach to sample size calculation is recommended. Whenever it is not possible to assume the standard deviation and the effect size, an alternative to the power analysis approach is the ‘resource equation’ approach, which sets the acceptable range of the error degrees of freedom (DF) in an analysis of variance (ANOVA). The aim of this article is to guide researchers in calculating the minimum and maximum numbers of animals required in animal research by reformulating the error DF formulas.
Keywords: animal research, research design, sample size
Using Resource Equation Approach
Wan Nor Arifin1, Wan Mohd ZAhiruddin2
1 Unit of Biostatistics and Research Methodology, School of Medical Sciences, Universiti Sains Malaysia, 16150 Kubang Kerian, Kelantan, Malaysia
2 Department of Community Medicine, School of Medical Sciences, Universiti Sains Malaysia, 16150 Kubang Kerian, Kelantan, Malaysia Submitted: 24 May 2017
Accepted: 16 Jul 2017 Online: 26 Oct 2017
Brief
Communication
Introduction
Prior to embarking on clinical drug trials on humans, researchers need to conduct extensive pre-clinical studies in vitro (test tube or cell cultures) and in vivo (animal experiments) to examine preliminary efficacy, toxicity, and pharmacokinetics (1). Pre-clinical animal studies should closely follow the established practices in human clinical trials (2). While sample size determination has been adequately highlighted in human clinical studies, it has not adequately been described in animal studies in the published literature (3).
Animal study researchers may face problems in determining how many animals they should use, where a too small sample size can miss the real effect in an experiment, while a sample size that is larger than necessary will lead to wasting resources and ethical issues on the sacrificed animals. Similar to human studies, the power analysis approach
to sample size determination is often the most scientifically favored method. The emphasis on this approach can be clearly seen in a number of papers on methods in animal research (4, 5, 6) and recommendations by animal research committees (7, 8). However, a researcher must have prior knowledge and information about two major concepts in the power analysis approach: 1). effect size (the minimum difference between two groups that can be considered clinically significant) and 2). standard deviation (the measure of variability within a sample for a quantitative variable). The information may not be readily available in the literature or difficult to estimate, especially for studies that are exploratory in nature.
(ANOVA) is between 10 to 20 (4, 9, 10). The resource equation approach is suitable for exploratory studies whenever it is not possible to assume the standard deviation and the effect size (4). This is applicable whenever the outcome is a quantitative variable and suitable for analysis by ANOVA.
The aim of this article is to guide researchers on sample size calculation in exploratory animal research. The sample size calculation will be based on the resource equation. This article takes a different approach than the ones presented in other papers (4, 6) in calculating the appropriate number of animals in a study. Using simple algebra, the DF formulas are presented in forms of minimum and maximum numbers of animals required in a study using three common ANOVA designs.
Minimum and Maximum Sample Sizes for Three ANOVA Designs
Design 1: Group comparison—one-way ANOVA For one-way ANOVA, the between-subject error DF (that is, the within-subject DF) is calculated as:
DF = N – k = kn – k = k(n – 1),
where N = total number of subjects, k = number of groups, and n = number of subjects per group.
By rearranging the formula, n is given as:
n = DF/k + 1
Based on the acceptable range of the DF, the DF in the formulas are replaced with the minimum (10) and maximum (20) DFs to obtain the minimum and maximum numbers of animals per group:
Minimum n = 10/k + 1
Maximum n = 20/k + 1
In total, the minimum and maximum numbers of animals required are:
Minimum N = Minimum nxk
Maximum N = Maximum nxk
Minimum n = 10/3 + 1 = 4.3 = rounded up to 5 animals/group
Maximum n = 20/3 + 1 = 7.7 = rounded down to 7 animals/group.
Please note that the minimum and maximum numbers of animals per group are rounded up and down, respectively, to keep the DF for each sample size/group within the limit (e.g., DF = 12 for n = 5, and DF = 18 for n = 7).
The total sample sizes are:
Minimum N = Minimum nx 3 = 5 x 3 = 15 animals
Maximum N = Maximum n x 3 = 7 x 3 = 21 animals
In conclusion, for the proposed study, between 5 and 7 animals per group are required. In other words, a total of 15 to 21 animals are required to keep the DF within the range of 10 to 20.
Although the formula is given for one-way ANOVA, it is also applicable for an independent
t-test (involving two groups). In this case, k is
set equal to 2. The formula is applicable because the error DF of one-way ANOVA and the DF for an independent t-test is equal for a two-group comparison. Performing one-way ANOVA and an independent t-test (assuming equal variance) will also result in the same P-value.
Design 2: Same subjects, repeated measures— one within factor, repeated-measures ANOVA
For this repeated-measures ANOVA design, only one group of subjects is involved. That is why it is concerned only with the within-subject factor. The within-subject error DF is calculated
as:
DF = (N – 1)(r – 1),
where N = total number of subjects and r
= number of repeated measurements. Because there is no grouping factor, the calculation of n is
not applicable here.
N is obtained as:
N = DF/(r – 1) + 1
Maximum N = 20/(r – 1) + 1.
Whenever the experiment involves sacrificing the animals at each repetition, N must be multiplied by r.
For example, in an experiment to study the effect of a drug on tumor sizes in a group of animals at four time points (pre-treatment, and post-treatment 1, 2, and 3), the sample sizes are:
Minimum N = 10/(4 – 1) + 1 = 4.3 = rounded up to 5 animals
Maximum N = 20/(4 – 1) + 1 = 7.7 = rounded down to 7 animals
Again, please note that the minimum and maximum numbers of animals are rounded up and down, respectively, to keep the DF for each sample size between the range of 10 and 20.
If the animals must be sacrificed at each measurement, the total sample sizes are:
Minimum Nxr = 5 x 4 = 20 animals Maximum Nxr = 7 x 4 = 28 animals
Design 3: Group comparison, repeated
measures—one between and one within factor, repeated-measures ANOVA
For repeated-measures ANOVA with one between-subject factor (the group), there are two error DFs: between-subject error DF and within-subject error DF (11).
The between-subject error DF is calculated
as:
DF = N – k = kn – k = k(n – 1),
and the within-subject error DF in this ANOVA design is calculated as:
DF = (N – k)(r – 1) = (kn – k)(r – 1) =
k(n – 1)(r – 1)
Thus, the error DF is the sum of these two error DFs:
DF = Between-subject error DF + Within-subject error DF
= k(n – 1) + k(n – 1)(r – 1) =
k(n – 1)(1 + r – 1) = kr(n – 1),
where N = total number of subjects, k
= number of groups, n = number of subjects per group, and r = number of repeated measurements.
By rearranging the terms, n is obtained as:
n = DF/kr + 1
Similarly, the DFs in the following formulas are replaced with 10 and 20 for the minimum and maximum n and N, respectively. The minimum and maximum numbers of animals required are:
Minimum n = 10/kr + 1 Maximum n = 20/kr + 1
The minimum and maximum total numbers of animals required are:
Minimum N = Minimum nxk
Maximum N = Maximum nxk
Again, whenever the experiment involves sacrificing the animals at each repetition, n and
N must be multiplied by r.
For example, consider a study that aims to compare three treatment groups (honey, honey with chemical, and control) with four repeated measurements (pre-treatment, and post-treatment 1, 2, and 3) of tumor sizes. Considering the error DF, the sample sizes per group are:
Minimum n = 10/(3 x 4) + 1 = 1.8 = rounded up to 2 animals/group
Maximum n = 20/(3 x 4) + 1 = 2.6 = rounded down to 2 animals/group,
resulting in equal sample sizes for the minimum and maximum N:
Minimum (Maximum) N = Minimum (Maximum) nx 3 = 2 x 3 = 6 animals
If the animals must be sacrificed at each measurement, the total sample size is:
Closing Remarks
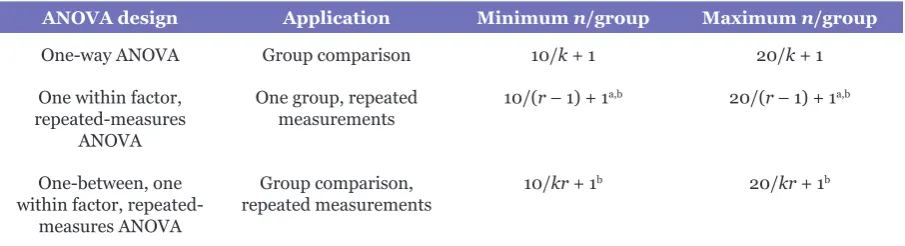
This article presented sample size formulas for three common ANOVA designs that are applicable to animal studies. The main formulas by the ANOVA designs are presented again in Table 1 as a quick reference. The focus of
this article is on the minimum and maximum numbers of animals required in an animal research. Given ethical consideration and budget limitations, a researcher may choose a suitable sample size for his or her planned animal study based on these simple formulas.
Table 1. Sample size formulas for three ANOVA designs
ANOVA design Application Minimum n/group Maximum n/group
One-way ANOVA Group comparison 10/k + 1 20/k + 1
One within factor, repeated-measures
ANOVA
One group, repeated
measurements 10/(r – 1) + 1
a,b 20/(r – 1) + 1a,b
One-between, one within factor,
repeated-measures ANOVA
Group comparison,
repeated measurements 10/kr + 1
b 20/kr + 1b
k = number of groups, n = number of subjects per group, N = total number of subjects, r = number of repeated measurements. an = N, because only one group is involved, bn must be multiplied by r whenever the experiment involves sacrificing the animals at
each measurement.
Authors’ Contributions
Conception and design: WNA, WMZ
Analysis and interpretation of the data: WNA, WMZ
Drafting of the article: WNA, WMZ
Critical revision of the article for important intellectual content: WNA, WMZ
Final approval of the article: WNA, WMZ Statistical expertise: WNA, WMZ
Correspondence
Dr Wan Nor Arifin
MBBS (IIUM), MSc Medical Statistics (USM) Unit of Biostatistics and Research Methodology, School of Medical Sciences, Universiti Sains Malaysia, 16150 Kubang Kerian,
Kelantan, Malaysia. Tel: +609 767 6825 Fax: +609 765 3370 E-mail: [email protected]
References
1. Junod SW. FDA and clinical drug trials: a
2. Muhlhausler BS, Bloomfield FH, Gillman MW. Whole animal experiments should be more like human randomized controlled trials. PLoS Biol.
2013;11(2):e1001481. https://doi.org/10.1371/
journal.pbio.1001481
3. Baker D, Lidster K, Sottomayor A, Amor S. Two years later: journals are not yet enforcing the ARRIVE guidelines on reporting standards
for pre-clinical animal studies. PLoS Biol.
2014;12(1):e1001756. https://doi.org/10.1371/
journal.pbio.1001756
4. Festing MF, Altman DG. Guidelines for the design and statistical analysis of experiments
using laboratory animals. ILAR Journal.
2002;43(4):244–258. https://doi.org/10.1093/ ilar.43.4.244
5. Fitts DA. Ethics and animal numbers: informal analyses, uncertain sample sizes, inefficient replications, and type I errors. Journal of the American Association for Laboratory Animal Science. 2011;50(4):445–453.
7. Chinese University of Hong Kong. Sample size [Internet]. Hong Kong: Chinese University of Hong Kong, Faculty of Medicine, Laboratory Animal Services Centre; (cited 2017 May 11). Available from: http://www.lasec.cuhk.edu.hk/ sample-size-calculation.html
8. Saxton AM. How many animals do I need? Tennessee: The University of Tennessee, Knoxville; (cited 2017 May 11). Available from: http://iacuc.utk.edu/iacuc-resources/how-many-animals-do-i-need/
9. Mead R, Gilmour SG, Mead A. Statistical principles for the design of experiments: applications to real experiments. Cambridge, UK: Cambridge University Press; 2012.
10. Festing MF. Design and statistical methods in studies using animal models of development. ILAR Journal. 2006;47(1):5–14. https://doi. org/10.1093/ilar.47.1.5
11. Girden ER. ANOVA: repeated measures.