36
Classification Boosting in Imbalanced Data
Sinta Septi Pangastuti1a, Kartika Fithriasari1b*, Nur Iriawan1c, and Wahyuni Suryaningtyas2d
1 Statistics Department, Institut Teknologi Sepuluh Nopember Jl. Arif Rahman Hakim, Surabaya 60111 Indonesia and
Statistics Department, Faculty of Mathematics and Natural Sciences, Padjadjaran University Jl. Raya Bandung-Sumedang Km. 21, Jatinangor 45363, INDONESIA. E-mail: [email protected] ; [email protected]a ;
[email protected] ; [email protected]c ,
2 Doctoral Candidate at Statistics Department, Institut Teknologi Sepuluh Nopember Jl. Arif Rahman Hakim, Surabaya
60111 Indonesia and Mathematics Education Program Study, Faculty of Teacher Training and Education, Muhammadiyah University of Surabaya Jl. Sutorejo No. 59, Surabaya 60113, INDONESIA. E-mail: [email protected]
* Corresponding Author: [email protected]
Received: 21st April 2019 Revised : 6th August 2019 Published: 30th September 2019
DOI : https://doi.org/10.22452/mjs.sp2019no2.4
ABSTRACT Most existing classification approaches assumed underlying training data set to be evenly distributed. However, in the imbalanced classification, the training data set of one majority class could far surpass those of the minority class. This becomes a problem because it’s usually produces biased classifiers that have a higher predictive accuracy over the majority class, but poorer predictive accuracy over minority class. One popular method recently used to rectify this is the SMOTE (Synthetic Minority Over-Sampling Technique) which combines algorithms at data level. Therefore, this paper presents a novel approach for learning and imbalanced data sets, based on a combination of the SMOTE algorithm and the boosting procedure by focusing on a two-class problem. The Bidikmisi data set is imbalanced, because the distribution of majority class examples is 15 times the number of minority class examples. All models have been evaluated using stratified 5-fold cross-validation, and the performance criteria (such as Recall, F-Value and G-Mean) are examined. The results show that the SMOTE-Boosting algorithms have a better classification performance than the AdaBoost.M2 method, as the g-mean value increases 4-fold after the SMOTE method is used. We can say that SMOTE-Boosting algorithm is quite successful when taking advantage of boosting algorithms with SMOTE. When boosting affects the accuracy of the random forest by focusing on all data classes, the SMOTE algorithm alters the performance values of the random forest only in minority classes.
Keywords: Boosting, G-mean, Imbalanced classification, SMOTE
1. INTRODUCTION
Data mining is a method often used to determine the hidden relationship between variables (Han et al, 2006). There are mixtures of prevalent information mining undertakes inside the instructive information mining, e.g., grouping, bunching, anomaly location, affiliation standard, expectation, and so forth. In recent years, many applications of data mining are used to handle cases with large data or big data. In this study, the application of data mining was conducted by using the local data
37 has received worthy consideration in the classification problems. Imbalance class for a binary classification problem occurs when one class (majority class) highly exceeds the number of another class (minority class).
The classification technique aims to find a decision function that accurately predicts the class of testing data derived from the same distribution function as the data for training. The large class is called the majority class (negative class) while the smaller class is called the minority class (positive class). Under such conditions, most classifiers are biased towards the major class since the classification engine will be inclined to predict the major class and ignore the minor class (Japkowicz & Stephan, 2002). Imran et al. (2016) used three re-sampling techniques: SMOTE (Synthetic Minority Oversampling Technique), ROS (Random over Sampling), and RUS (Random under Sampling) with three different classifiers and trained them with the rebalanced data. There are several approaches to learning methods used to overcome the problem of imbalanced data; one of them is the ensemble method. The ensemble method, in principle, combines a set of classifiers that are trained in order to create a better classifier model that makes the ensemble classifier more accurate than the original classifier in performing a classification (Han et al, 2012). According to Schapire in Leaes et al. (2017), one approach that can be used to improve the performance of classification on imbalanced data is boosting. Boosting can improve performance by exploiting classification errors, which involves using the base classifier. We used the SMOTE-Boosting algorithm (Chawla et al, 2003) which provides good performance. SMOTE-Boosting modifies the Adaptive Boosting algorithm (Freud & Schapire, 1995) by employing the SMOTE algorithm in each iteration. The purpose of SMOTE is to increase the probability of selecting hard-to-class samples, derived from the minor class, into the training data in each iteration so as to make the base classifier to focus more on minor class
observations. This will certainly improve the accuracy of classification of minority classes.
This paper is structured as follows. In section two, a brief explanation of ensemble methods and its algorithm are given. The performance evaluation for imbalanced data is discussed in section three, followed by results and discussion in section four. The conclusion is presented in section five.
2. ENSEMBLE METHODS
In this section, the ensemble method that is used for imbalanced data set for the Bidikmisi scholarship is presented. The ensemble classification method combines a collection of classifications to create a single composite model to provide better accuracy. Experimental studies such as Bühlamann and Hothorn (2007) showed that predictions from composite models provide better results compared to single-model predictions. This ensemble method has become popular in the last few decades, with some of the most popular combining techniques include Boosting (Freud & Schapire, 1996), Cost sensitive boosting (CSB) by Ting (2000) and Cost-Sensitive boosting algorithm (Sun et al, 2005). The most recent algorithm is SMOTEBoost, which successfully utilizes the benefits of both boosting and the SMOTE algorithm for an imbalanced dataset (Chawla et al, 2003), will be explained in the next section.
2.1 Adaptive Boosting M2 Algorithm
Boosting, which was introduced by Schapire in Leaes et al. (2017), is one of the ensemble methods used to improve the performance of a learning algorithm by combining a collection of weak classifiers to form a strong end classifier. Adaptive boosting is one of the boosting algorithm introduced by Freud & Schapire (1995). In this paper, we use well-known modifications that have been
employed in imbalanced domains:
38 Note that this algorithm cannot deal with the imbalanced problem directly; it has to be combined with another technique as its base
classifier. The goodness of a base classifier is measured based on the pseudo-loss, as seen in Algorithm 1.
Algorithm 1 AdaBoost.M2 Input:
xi,yi
,..., xm,ym
where xiX and yi Y 1,...,kGiven: B
i y i, : 1,...,m y
, yi
1. Train weak learner or base classifier use
D
t distribution
1( , ) 1/ for ,
D i y B i y B
2. for t1, 2,...,T
3. Compute weak hypothesis h Xt: Y
0,1 with pseudo-loss, Equation (1).
,
1
, 1 , ,
2
t t t i i t i i
i y B
D i y h x y h x y
(1)If t 0.5, then the learning process stops.
4. Set
1
t t
t
(2) 5. Update weight value
1
1 , ,
2 1
( , )
( , ) t i i t i i
h x y h x y t
t t
t
D i y
D i y
Z
(3)
where
Z
t is a normalization contact that makes1 1
( , ) 1 m
t i
D i y
Output: Boosted classifier
1
1
( ) arg max log ( , )
T
t y Y
t t
H x h x y
(4)As mentioned earlier, this algorithm needs base classifier as its weal learner. In this paper, both AdaBoost.M2 and SMOTE-Boosting used the random forest as a base classifier.
2.2 SMOTE-Boosting Algorithm
The algorithm SMOTE-Boosting was proposed by Chawla et al. (2003). SMOTE-Boosting combines the SMOTE algorithm and standard boosting procedures, utilizing SMOTE to improve minority class predictions and utilizing boosting to avoid sacrificing
accuracy over the entire data set. SMOTE is one method of dealing with imbalanced data proposed by Chawla et al. (2002). The basic idea of SMOTE is to increase the number of samples in the minor class to equal the major class, by generating synthetic data based on the nearest neighbor, k-nearest neighbor, where the nearest neighbor is selected based on the Euclidean distance between the two data. Suppose the given data with p variable is
and , then the
Euclidean distance d(x,z) is defined as follows:
d( , )x z (x1z )1 2(x2z )2 2 ... (xpz ) .p 2 (5)
p
T
x ,..., x , x1 2
x T
z,z ,...,zp
39
Synthetic data generation is done by using the following equation:
xsyn xi (xknnxi) . (6)
Synthetic samples are generated in the following way: Take the difference between variable vector (sample) under consideration
xi and its nearest neighbor
xknn . Multiply this difference by a random number between 0 and 1
, and add it to the variable vectorunder consideration
xi . This cause theselection of a random point along the line segment between two specific variables, and so this approach effectively forces the decision region of the minority class to become more general.
SMOTE method is also used to handle continuous and nominal mixed data sets, and it is known as SMOTE-NC. Based on research by Chawla et al (2002) using data Adult from USI repository, the dataset has 6 continuous variables and 8 nominal variables. The SMOTE and SMOTE-NC algorithm are used to approve the dataset. In this study, 10 nominal variables and one continuous variable were used. Based on the study using data from the UCI repository, data showed that SMOTEBoost is able to achieve higher F-values than AdaCost, due to SMOTE’s ability to improve coverage of the minority class.
The SMOTE-NC (Synthetic Minority Oversampling Technique – Nominal Continous) algorithm is described as follows:
1. Median Computation: Compute the
median standard deviation of continuous variable for minority classes. If the nominal variables differ between a sample and its potential nearest neighbor, then this median is included in the Euclidean distance computation. The median is used to override differences in nominal variables by an amount that is related to the typical difference in continuous variable values.
2. Nearest Neighbor (k) Computation: Compute the Euclidean distance between the variable vector in which the nearest neighbor's k are being identified (minority class sample), and other variable vectors (minority class sample) using the continuous variable space. For each different nominal variables between the considered variable vector and its potential nearest-neighbor, including the median standard deviation calculated earlier, in the calculation of Euclidean distance.
3. Creating Synthetic Samples: The
continuous variable of the new synthetic data for minority classes are created using the same SMOTE approach as described earlier. The nominal variables are given the value occurring in the majority of the
k-nearest neighbors.
The purpose of merging the SMOTE and AdaBoost.M2 algorithm is to increase the True Positive (TP) rate. SMOTE-Boosting successfully combines AdaBoost.M2 and SMOTE, while AdaBoost.M2 tries to improve the accuracy of the classifier by focusing on the “difficult to classify” observations that come from both classes, SMOTE tries to improve the performance of the classifier only on observations in minority classes. Therefore, in several consecutive boosting iterations, SMOTE-Boosting was able to make wider decision areas for minority classes than the standard boosting method. SMOTE-Boosting initially used the iteration procedure from AdaBoost.M2, by Freud & Schapire (1995). In the AdaBoost.M2 iteration procedure, the classification result of the classifier component is first brought into the form of probability [0,1] for later use in calculating pseudo loss.
SMOTE-Boosting introduces synthetic
40
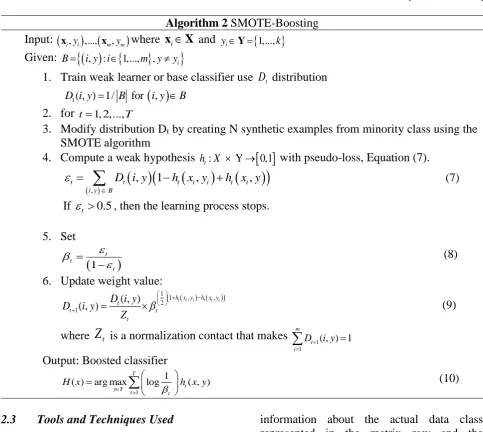
Algorithm 2 SMOTE-Boosting Input:
xi,yi
,..., xm,ym
where xiX and yi Y
1,...,k
Given: B
i y i, : 1,...,m y
, yi
1. Train weak learner or base classifier use Dt distribution
1( , ) 1/ for ,
D i y B i y B
2. for t1, 2,...,T
3. Modify distribution Dt by creating N synthetic examples from minority class using the
SMOTE algorithm
4. Compute a weak hypothesis h Xt: Y
0,1 with pseudo-loss, Equation (7).
,, 1 , ,
t t t i i t i
i y B
D i y h x y h x y
(7)If t 0.5, then the learning process stops.
5. Set
1
t t
t
(8) 6. Update weight value:
1
1 , ,
2 1
( , )
( , ) t i i t i i
h x y h x y t
t t
t D i y
D i y
Z
(9)
where
Z
t is a normalization contact that makes 11
( , ) 1 m
t i
D i y
Output: Boosted classifier
1
1
( ) arg max log ( , ) T
t y Y
t t
H x h x y
(10)2.3 Tools and Techniques Used
In this paper, Data Mining techniques are used for the prediction of Bidikmisi data set. The techniques are classification using Random Forest algorithm, combined with
SMOTE and boosting algorithm. For
implementation of all these classification tasks we have used ebmc package in R, and Minitab.
3. PERFORMANCE EVALUATION FOR IMBALANCED DATASET
Actual data and predictive predicted data from the classification model is presented using a confusion matrix, which contains
41
Recall= TP .
(TP+FN) (11)
Precision= TP .
(TP+FN) (12)
F-Value 2(Recall Precision). Recall+Precision
(13)
Table 1: Confusion matrix.
Predictive Positive Class Predictive Negative Class
Real Positive Class True Positive (TP) False Negative (FN)
Real Negative Class False Positive (FP) True Negative (TN)
The recall value provides information on how minority classes are identified, but maybe at
the expense of precision through
misclassification of the majority class. The
commonly used sensitivity and specificity are taken to measure the performance of each algorithm on the imbalanced data sets. They are defined as:
Specificity= TN .
(TN+FP) (14)
Sensitivity= TP .
(TP+FN) (15)
G-Mean= Sensitivity × Specificity. (16)
To perform an overall performance evaluation, geometric mean (G-mean) can be used. G-mean is the geometric average of Recall (Sensitivity) and Specificity. According to Li et al. (2008), several studies use G-mean measurements to evaluate the performance of algorithms on imbalanced data problems because this measure combines sensitivity and specificity by taking the geometric mean. If all positive classes are unpredictable, then the G-mean will be zero, so expect a classification algorithm to reach a high G-mean value.
4. RESULTS AND DISCUSSION
42
Table 2: Summary of the Bidikmisi data set.
Data set Number of majority
class instances
Number of minority class instances
Number of classes
Bidikmisi 10143 686 2
*Source: Kemenristekdikti of the Republic of Indonesia
Table 3: Summary of the nominal and continuous variables
Number of nominal variables 10
Number of continuous variable 1
*Source: Kemenristekdikti of the Republic of Indonesia
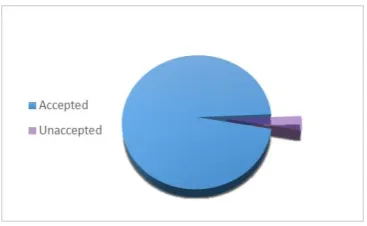
The Bidikmisi data set has a mixture of both nominal and continuous variables (see Table 3), so SMOTE-NC is used to obtain synthetic data. Based on Figure 1, the distribution of class categories showed that there is an imbalanced data. The number of
majority class examples is 15 times the number of minority class examples, so we increase the SMOTE parameter N value to 1500. Then we obtained the new train and test data sets by stratified 5-fold cross-validation.
Figure 1: Data characteristics based on student status.
As shown in Figure 1, the majority class is accepted as student status with 97% and only 3% is minority class, i.e., student's status is not accepted. Such a condition would cause the classifier to be biased against the majority class, meaning that the classification engine would tend to predict the majority class and ignore the minor class. Therefore, the ensemble classification method is expected to
be able to handle the problem created. The experimental result for the Bidikmisi data set is presented in Figures 2 to 3.
Performance evaluation for
43 41 40 39 37 35 33 31 29 27 25 23 21 19 17 15 13 11 9 7 5 0.18 0.16 0.14 0.12 0.10 0.08 0.06 0.04 0.02 0.00 Iteration P e rf o rm a n ce F-value AdaBoost F-value SMOTEBoost Recall AdaBoost Recall SMOTEBoost
Boosting performance with tree=100
41 40 39 37 35 33 31 29 27 25 23 21 19 17 15 13 11 9 7 5 0.18 0.16 0.14 0.12 0.10 0.08 0.06 0.04 0.02 0.00 Iteration P e rf o rm a n ce F-value AdaBoost F-value SMOTEBoost Recall AdaBoost Recall SMOTEBoost
Boosting performance with tree=50
(a) (b)
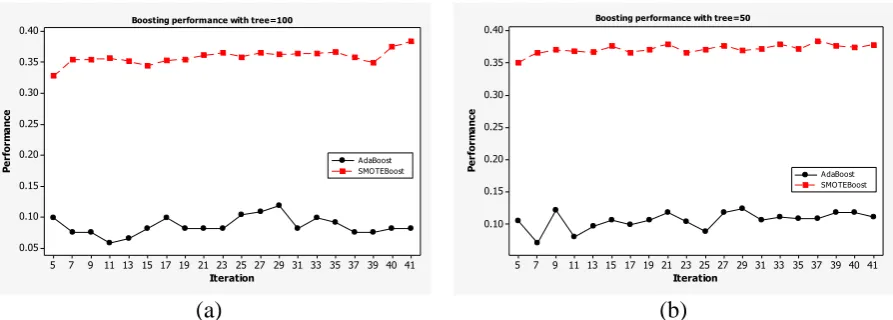
Figure 2: Recall and F-value of the Bidikmisi data set when boosting random forest: (a) Tree=100 and (b) Tree=50 are applied.
41 40 39 37 35 33 31 29 27 25 23 21 19 17 15 13 11 9 7 5 0.40 0.35 0.30 0.25 0.20 0.15 0.10 0.05 Iteration P e rf o rm a n ce AdaBoost SMOTEBoost
Boosting performance with tree=100
41 40 39 37 35 33 31 29 27 25 23 21 19 17 15 13 11 9 7 5 0.40 0.35 0.30 0.25 0.20 0.15 0.10 Iteration P e rf o rm a n ce AdaBoost SMOTEBoost
Boosting performance with tree=50
(a) (b)
Figure 3: G-mean of the Bidikmisi data set when boosting random forest: (a) Tree=100 and (b) Tree=50 are applied.
The analysis of Figure 2 and 3 shows the behavior of the ensemble method with respect to the different number of iterations. It is apparent that the SMOTE-Boosting achieved higher f-value than AdaBoost.M2. We also compared the boosting algorithm with different random forest trees.
The recall value shown in Figure 2 shows the behavior of the ensemble method with respect to the number of iterations. It can be seen that the value of the recall tends to be stable or show an ascending pattern. The recall value corresponds to a true positive and a false negative (recall = TP / (TP + FN)). Then false negative will have a greater value than true positive, due to the increase of predicted minor class to the majority class. As for the value of
f-value, it is the geometric average of the
precision and recall value. SMOTE embedded within the boosting procedure additionally improved the recall achieved by the boosting procedure, thus increasing the F-value. SMOTE, as a part of SMOTE-Boosting, allows the learners to broaden the minority class scope, while the boosting, on the other hand, aims at reducing the number of false positives.
44
Method Tree
SMOTEBoost AdaBoost
tree=50 tree=100
tree=50 tree=100
0.40 0.35 0.30 0.25 0.20 0.15 0.10 0.05
P
e
rf
o
rm
a
n
ce
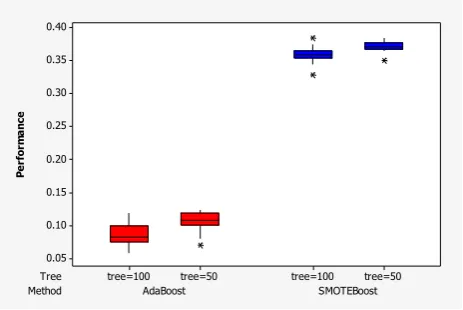
Figure 4: Clustered boxplot boosting performance of G-mean.
Figure 4 presents a boxplot of the mean values generated in each model. The G-mean value generated using the SMOTE-Boosting, shown in the figure by the blue box, was higher compared to AdaBoost.M2. The G-mean value is generated using the AdaBoost.M2, shown by the red box in the figure. The median for both methods seems similar, but the variations of G-mean generated by the SMOTE-Boosting algorithm tend to be smaller than the AdaBoost.M2, ranges from 35% to 37%. It is also shown for different trees where each method gives an almost the same results. This indicates that the G-mean performance generated by SMOTE-Boosting is more stable than AdaBoost.M2.
5. CONCLUSION
All models have been evaluated using stratified 5-fold cross-validation, and the performance criteria for each method are examined. The algorithm used is SMOTE-Boosting based on SMOTE algorithm integration in standard boosting procedures. The results of the imbalanced classes show that the SMOTE-Boosting ensemble algorithms show better classification performance than the AdaBoost.M2 method. It can be said that
SMOTE-Boosting methods are quite
successful when taking advantage of boosting algorithms with SMOTE. While boosting affects the accuracy of the random forest by
focusing on all data classes, the SMOTE algorithm alters the performance values of the random forest only in minority classes.
6. ACKNOWLEDGEMENT
This research was supported by DPRM-DIKTI
under scheme PUPT, project No.
1049/PKS/ITS/2018. The author thanks the Kementerian Riset, Teknologi, dan Pendidikan Tinggi for funding and to anonymous references for their useful suggestions.
7. REFERENCES
Bayisa, L.F., Liu, X., Garpebring, A. & Yu, J. (2018). Statistical learning in computed tomography image estimation. The International Journal of Medical Physics Research and Practice, 45(12): 5450-5460.
Bühlaman, P., & Hothorn, T. (2007). Boosting Algorithms: Regularization, Prediction and Model Fitting. Statistical Science,
22(4): 477-505.
45 bidikmisi scholarship applicants in east
java. MATEMATIKA: Malaysian
Journal of Industrial and Applied Mathematics, 34 (Special Issue): 83-90. Chawla, N. V., Bowyer, K. W., Hall, L. O. &
Kegelmeyer, W. P. (2002). SMOTE: synthetic minority over-sampling technique. Journal of Artificial Intelligence Research, 16: 321-357. Chawla, N.V., Lazarevic, A., Hall, L.O. &
Bowyer, K.W. (2003). SMOTEBoost: Improving the prediction of the minority class in boosting. Proceedings of the 7th European Conference on Principles and Practice of Knowledge Discovery in Databases, Cavtat-Dubrovnik, Croatia, 22-26 September, 107–119, Springer.
Freund, Y. & Schapire, R. E. (1995). A decisitheoretic generalization of on-line learning and an application to boosting. Proceedings of the 2nd European Conference on Computational Learning Theory,
Barcelona, Spain, 13-15 March, 23-37, Springer.
Freund, Y. & Schapire, R. (1996). Experiments with a new boosting algorithm.
Proceedings of the 13th International Conference on Machine Learning, 325-332.
Han, J., Kamber, M. & Pei, J. (2006). Data Mining Concepts and Techniques 2nd Edition. USA: Kaufman Publisher. Han, J., Kamber, M. & Pei, J. (2012). Data
Mining Concepts and Techniques 3rd Edition. USA: Kaufman Publisher. Imran, M., Afroze, M., Sanampudi, SK., &
Qyser, AAM. (2016). Data mining of imbalanced dataset in educational data using Weka tool. International Journal of Engineering Science and Computing, 6(6): 7666-7669.
Japkowicz, N. & Stephen, S. (2002). The Class Imbalance Problem: A Systematic Study. Intelligent Data Analysis, 6(5), 203-231.
Leaes, A., Fernandes, P., Lopes, L. & Assunção, J. (2017). Classifying with AdaBoost.M1: The training error threshold myth. Proceedings of the Thirtieth International Florida Artificial Intelligence Research Society Conference, Marco Island, Florida, 22-24 May.
Li, X., Wang, L. & Sung, E. (2008). AdaBoost with SVM-based component classifiers. Engineering Applications of Artificial Intelligence, 21(5) 785-795. From University of Wollongong Publications: http://ro.uow.edu.au/eispapers/602. Schapire, R. & Singer, Y. (1999). Improved
boosting algorithms using confidence-rated predictions. Machine Learning,
37: 297–336.
Sun, Y., Wong, A.K.C. & Wang, Y. (2005). Parameter inference of cost-sensitive boosting algorithm. Proceedings of the 4th International Conference Machine Learning and Data Mining in Pattern Recognition, Leipzig, German, 9-11 July, pp. 21-30, Springer.
Suryaningtyas, W., Iriawan, N., Fithriasari, K., Ulama, BSS., Susanto, I., & Pravitasari, AA. (2018). On the Bernoulli Mixture Model for Bidikmisi Scholarship Classification with Bayesian MCMC.
Journal of Physics: Conference Series,
1090: 1-8.
Ting, K. (2000). A Comparative Study of Cost-Sensitive Boosting Algorithms.
Proceedings of 17th International Conference on Machine Learning,