Distance Based Method for Outlier Detection of
Body Sensor Networks
Haibin
Zhang
1,
Jiajia
Liu
1,∗,
Cheng
Zhao
11SchoolofCyberEngineering,[email protected],XidianUniversity,Xi’an710071,P.R.China
Abstract
We propose a distance based method for the outlier detection of body sensor networks. Firstly, we use a Kernel Density Estimation (KDE) to calculate the probability of the distance tok nearest neighbors for diagnosed data. If the probability is less than a threshold, and the distance of this data to its left and right neighbors is greater than a pre-defined value, the diagnosed data is decided as an outlier. Further, we formalize a sliding window based method to improve the outlier detection performance. Finally, to estimate the KDE by training sensor readings with errors, we introduce a Hidden Markov Model (HMM) based method to estimate the most probable ground truth values which have the maximum probability to produce the training data. Simulation results show that the proposed method possesses a good detection accuracy with a low false alarm rate.
Receivedon 19 September 2015;acceptedon 24 November 2015;publishedon 19 January 2016
Keywords: outlierdetection;bodysensornetworks;slidingwindow
Copyright© 2016 HaibinZhang et al., licensed to EAI. This is an open access article distributed under the terms of the Creative
Commons Attribution license (http://creativecommons.org/licenses/by/3.0/), which permits unlimited use, distribution and reproduction in any medium so long as the original work is properly cited.
doi:10.4108/eai.19-1-2016.151000
1. Introduction
The improvement of living standards, unreasonable diet, excess energy, environmental pollution and other factors enable chronic diseases developing more quickly. This leads to a shortage of qualified healthcare professionals and equipments to treat the sick and needy persons. The wireless body sensor network (BSN) is one of solutions to this problem. BSNs use wireless devices attached to or implanted in the body to collect various vital signs such as heart rate (HR), oxygen saturation (SpO2), blood pressure (BP), etc, and transmit collected data to a central device for processing. This allows real-time monitoring and early detection of clinical deterioration, and greater freedom and mobility while maintaining the quality of medical care [9].
Wireless devices are restricted by resources. In addi-tion, they are frequently susceptible to environmental effects, vulnerable to the malicious, which lead to unre-liability sensor data. However, medical applications have strict requirements for reliability to avoid false alarm, so outlier detection is extremely important to ensure the reliability and accuracy of sensor data before the decision-making process [9].
∗
Corresponding author. Email:[email protected]
Outlier detections in wireless sensor networks have been studied for many years [1–4]. They estimated sensor readings or probabilities of sensor readings using spatial correlation in measurements at different sensors for the outlier detection of wireless sensor networks. These methods have an assumption that there are a large number of sensors used for the same events detection, a sensor value can be deduced from other sensors’ values. However, they are not suitable for body sensor networks, because it is difficult to put too many sensors on body and it is usual that different sensors are used to collect different vital signs.
Kimet al. in [5] gave an approach for motion outlier detection in body sensor networks, they used history data to train Gaussian Mixture Model to generate clusters of data in similar motion groups, these cluster of data are used to estimate a Gaussian distribution to compute fault probability for new node reading. These methods can detect faults that are deviated largely to the normal data. For those faults whose readings are normal values without a low probability these methods may have a bad performance.
Chen et al. in [6] diagnosed abnormal data of time series of multivariate variables by two steps. Firstly, they suppose that there is a relationship between the variables represented by an expression. Then a data is diagnosed as faulty if its deviation to the estimated value by this expression is larger than a threshold.
1
on Wireless Spectrum
Research
Article
EAI
European Alliancefor Innovation
EAI Endorsed Transactions on
Wireless Spectrum
Similarly, Salem et al. in [8] tried to use a linear regression to estimate the reading of a sensor, e.g. HR, by values of its neighbour sensors. However, there may not be relationship between variables, and it can not decide which data is faulty when some fault occurs.
Salem et al. in [9] used a Kernel function to estimate the the distribution of the distance between a sensor reading to the mean of training data. A data instance is diagnosed as faulty if the probability of the calculated distance is very low. Rajasegarar et al. in [13],[12] used a naive Bayes based method for outlier detection. This method simply calculated the frequency of each attribute to estimate the probability. However, the Bayesian model is established on the basis of independence hypothesis, which assumed that the attributes of data are independent. This is not always true, and may affect the results of the classification.
In this paper, we propose a distance based outlier detection method for BSNs. Firstly, we calculate the average distance to k nearest neighbors of training data to estimate a KDE. For any diagnosed data, we calculate the probability of its distance to k nearest neighbors using the KDE, if this probability is less than a threshold, then the diagnosed data may be an outlier. Then we check the distances of the diagnosed data to its left and right neighbors, if both of these distances are great, then we decide the diagnosed data as an outlier.
In some conditions like that the sensor readings have successive outliers, then the previous method may have a poor performance. We introduced a sliding window to this issue. Similarly, we calculate the probability of the distance tok nearest neighbors for a diagnosed sliding window with the estimated KDE, if this probability is less than a threshold, then we decide that there are some outliers in this window. Then we check the distance to the left and right neighbors to locate the outlier.
Estimating the KDE with training data is the key issue of the proposed method for outlier detection. However, the history training data containing errors can disrupt the estimated values of the KDE. We use the Hidden Markov Model (HMM) to estimate the most probable ground truth values which have the maximum probability to produce the training sensor readings.
The rest of this paper is organized as follows. Section II introduces system models and some definitions. In section III, the distance based outlier detection method is formalized. In section IV, experiments are carried out to test the performance of the proposed method. Conclusions are drawn in Section V.
2. System Models and Definitions
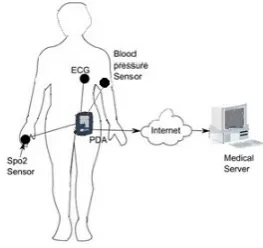
Fig. 1 shows the network architecture of our consid-ering medical deployment scenario. We use three sen-sors to monitor heart activities, blood pressure, res-piration rate and saturation of oxygen in the arterial
Figure 1. The Architecture of BSNs.
blood. These sensors monitor vital signs and transmit the collected data periodically at every discrete time instance to neighboring personal server devices, such as a smartphone. Then by wireless and wired connection, these data are streamed remotely to a medical doctor’s site for real time diagnosis, to a medical database for record keeping, or to the corresponding equipment that issues an emergency alert.
Time series of vital sign data: It is a sequence of vital sign data arranged in time orderX= (Xa, Xa+1,· · ·, Xc), whereXi = (xih, xib, xis) is the set of sensor readings of HR, BP and SpO2. The main purpose of time series analysis is to diagnose the current sensor readings based on the existing historical data. At any time t, suppose the ground truth values of HR, BP and SpO2 areGt= (gth, gtb, gts), the measured values transmitted from sensors areXt = (xth, xtb, xts), the outlier detection process decides whetherxt accords with Gt. However, for outlier detection process, the difficult is that we have no way to know the ground truth valuesGt.
2.1. Kernel Density Estimation
Kernel density estimation is a non-parametric way to estimate the probability density function of a random variable. Let (y1, y2,· · ·, yn) be an independent and identically distributed sample obtained from some distribution with an unknown density functionf. The shape of functionf can be estimated as
b
fh(y) = 1 n
n
X
i=1
Kh(y−yi) = 1
nh n
X
i=1
K(y−yi
h ) (1)
whereK(•) is a non-negative function called the kernel that integrates to one and has mean zero, h >0 is a bandwidth. Kh(x) is a kernel with subscripth is given as
Kh(x) = 1 hK(
x
h) (2)
2
EAI
European Alliancefor Innovation
EAI Endorsed Transactions on
Wireless Spectrum
2.2. Hidden Markov Model
A hidden Markov model is a 5-tupleλ= (Q, V ,Π, A, B), where Q={q1,· · · , qn} is a set of hidden states with
st denoting the state at time t, V ={v1,· · ·, vm} is a set of observation symbols with ot denoting the symbol at time t, Π={π1,· · ·, πn} is a vector of initial probabilities with πi =P(s1=qi),Ais a matrix (aij)(n×n) of transition probabilities with each aij =
P(st+1=qjst=qi), 1≤i, j≤n, B is matrix (bij)(n×m) of observation probabilities with each bij =P(ot=vjst= qi). We also useπs1,astst+1andbstot to denoteπi,aij and
bij respectively.
3. Outlier Detection Based on Distance
3.1. Simple Distance to Neighbors
We use the Euclidean distance to calculate the distance between two multivariate data. Let Xi = (xih, xib, xis) andXj = (xjh, xjb, xjs) be sensor readings on timeiand j, the Euclidean distance betweenXiandXjis
dij=
q
(xih−xjh)2+ (xib−xjb)2+ (xis−xjs)2 (3)
Theknearest distance ofXiis calculate as follows.
dik= X
i−bk/2c≤j<i+dk/2e
wjdij (4)
wherewj is a weight. The distance ofXi to its left and right neighbors (the nearest distancefor short) is
di2=di(i−1)+di(i+1)
Given a time series of history training sensor readings, we firstly calculate the k nearest distance of each data Xi, then the univariate KDE is used to estimate the probability distribution of thesek nearest neighbors distance. For a recently produced sensor readingsXt, thek nearest neighbors distancedtk of Xt and the probability p of dtk is calculated by the KDE obtained by history training data. If p is less than a threshold, the the nearest distancedt2ofXtis calculated, if dt2 is greater than a pre-defined value, then Xt is diagnosed as an outlier.
If some error occurs at time t, then the k nearest distance data at time closing tot, e.g. timet−1 ort+ 1, may have a small probability. The similar condition exists in the nearest distance. This leads to that the average rate of outliers newly introduced will be high using the k nearest distance or the nearest distance based method alone for outlier detection. Thus, we use the combination of these two method for outlier detection in this paper.
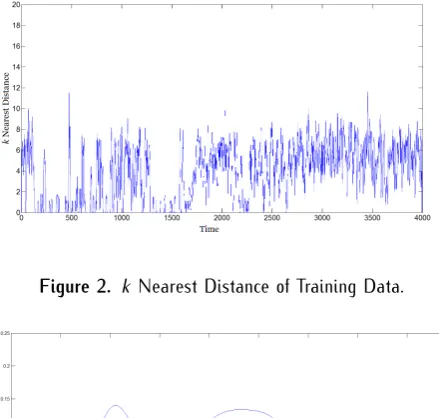
Fig. 4 shows a simulation result of 5000 HR data from a real medical dataset using the proposed outlier
Figure 2. k Nearest Distance of Training Data.
Figure 3. Probability Density Distribution of The k Nearest Distance.
Figure 4. Outlier Detection.
detection method. We use the first 4000 data to estimate the KDE. The k nearest distance of the 4000 training data is shown in Fig. 2, where k is selected as 2, and the kernel density estimation of the distance in Fig. 2 is depicted in Fig. 3. Then we inject 5% errors to the rest of 1000 data. The original data, the data with injected errors, and the data diagnosed as outlier are all marked in Fig. 4.
3.2. Distance to Neighbors of Sliding Window
For some condition like that the time series of sensor readings has too much successive outliers, then the detection method in the above subsection may have a poor performance. The reason is that the k nearest
3
EAI
European Alliancefor Innovation
EAI Endorsed Transactions on
Wireless Spectrum
neighbors of an outlier Xt may be contained in the successive outliers. This leads to theknearest distance ofXt having a normal probability, andXt is diagnosed as a normal data. To this problem, we improve the distance based outlier detection method on a sliding window.
A sliding window with width m at time t
contains Xt and its left m−1 nearest neighbors Xt−m+1, Xt−m+2,· · ·, Xt, that is
Bt =
x(t−m+1)h, x(t−m+1)b, x(t−m+1)s
x(t−m+2)h, x(t−m+2)b, x(t−m+2)s · · ·
xth, xtb, xts
We define a distanceDijbetween sliding windowBiand Bj as
Dij = 1 m
m−1
X
l=0
d(i−l)(j−l) (5)
whered(i−l)(j−l) is the Euclidean distance betweenXi−l and Xj−l, and the weighted average distance Dtk of sliding windowBtto itsknearest neighbors:
Dtk = X
t−bk/2c≤l<i+dk/2e
wlDtl (6)
where wj is a weight. We can see that the weighted average distanceDtkof sliding windowBtto itsknearest neighbors is the average of theknearest distance for all XiinBt.
Similarly, given a time series of sensor readings of history training data, we firstly calculate thek nearest distance of each sliding window to estimate a univariate KDE. For a recently produced sensor reading widow Bt, the k nearest distance Dtk of Bt is calculated. If the probability of Dtk calculated by the KDE is less than a pre-defined threshold, then we decide that there are some outliers in the window Bt. The next thing is to locate the outlier sensor reading. Since the sliding window Bt contains three time series–Bth for HR,Btb for BP andBts for SpO2, for each sensor readingyi in Bth,Btb orBts, if the nearest neighbor distance ofyi is greater than a pre-definedM, thenyiis diagnosed as an outlier.
3.3. Handling Error Training Data With HMMs
It is impossible to ensure that the history training data are all correct. The outliers in the training data can disrupt the estimated value of the KDE, and influence the performance of the proposed outlier detection method. To this issue, we use the HMM to estimate the most probable ground truth values which have the maximum probability to produce the training sensor readings.
Given a time series {y1,· · · , yn} of training sensor readings and a sensor error probability p, we select the first half dataO={y1,· · ·, yT=bn/2c}to estimate the parameters of an HMM λ by improving the Baum-Welch algorithm [?]. For HMMλand the rest training sensor readings O0={yT+1,· · ·, yn}, we can use the Viterbi algorithm [? ] to find the most likely ground truth vital sign values G of all possible G0
that can produceO0
.
Given the sensor reading sequence O, the Baum-Welch algorithm finds a local maximum
ζ= (Π, A, B) = max ζ0 P(O
|ζ0) (7)
for sequence O with random initial conditions. However, through our experiments, we find that the performance using the HMM with parameters being estimated by the Baum-Welch algorithm directly is poor. We improve Baum-Welch algorithm as the following steps.
Forward procedure: let
αt(i) =P(o1=y1,· · ·, ot=yt, st=qi|ζ) (8)
then
α1(i) =πqibqio1 (9)
αt+1(i) =bqiot+1
n
X
j=1
αt(j)aji (10)
Backward procedure: let
βt(i) =P(ot+1=yt+1,· · ·, oT =yT, st =qi|ζ) (11)
then
βT(i) = 1 (12)
βt(i) = n
X
j=1
βt+1(j)aijbqjot+1 (13)
Update: we can now calculate the temporary variables:
γt(i) =P(st=qi|O, ζ) =
αt(i)βt(i) n
P
j=1
αt(j)βt(j)
(14)
ξt(ij) = P(st=qi, st+1=qj|O, ζ)
= αt(i)anijβt+1(j)bqj ot+1 P
k=1
βt(k)αt(k)
(15)
ζcan now be updated:
π∗i =γ1(i) (16)
leta0ij =
T−1
P t=1
ξt(ij) T−1
P t=1
γt(i)
, then
a∗ij=
( a∗
ij =ε×a 0
ij+ (1−ε)/n if P(qi)<Θ
a∗ij =a0ij otherwise (17)
4
EAI
European Alliancefor Innovation
EAI Endorsed Transactions on
Wireless Spectrum
where 0< ε≤1 is a weighting, andΘ is a preselected threshold.
letbik0 =
T P t=1,Ot=vk
γt(i)
T P t=1
γt(i)
, then
b∗ik=
1−p if qi =vk
p∗ b 0
ik P vk,qi
b0
ik otherwise
(18)
These steps are now repeated iteratively until a desired level of convergence.
4. Simulation Results
In order to examine the performance of the proposed outlier detection method, we carry out some experi-ments on medical datasets from the PhysioNet database [?]. The dataset contains 7 attributes: BPmean, systolic BP, diastolic BP, HR, pulse, respiration rate, and SpO2. We only focus on three attributes: BPmean, HR, and SpO2. We use a data sequence of 5000 data, in which the first 4000 data are selected as the training data, and the last 1000 data with injecting faults as diagnosed data.
4.1. Performance Without Sliding Window
Since the 4000 training data are not injected faults, so we can estimate the KDE of thek nearest distance for each sensor reading. Given sensor error probabilities, we inject faults into the 1000 diagnosed data with the position and the value of the injected error all selected by random numbers. The simulation results are the average performance of 300 times randomized experiments.
Table I shows the performance of the k nearest distance based outlier detection method. In this simulation, if the probability of thek nearest distance calculated by the estimated KDE is less than a threshold δ= 0.001, then the diagnosed data is decided as an outlier. From Table I, we can see that the k nearest distance based method has a good outlier detection, but the false alarm rate is high, which leads to that the error rate after executing this method is enormous greater than the original error probability.
Table II shows the performance of the nearest distance based outlier detection method. If the nearest distance is greater than 4, then the diagnosed data is determined as an outlier. From Table II, we can see that the number of errors can be reduced by 50% approximately using this method.
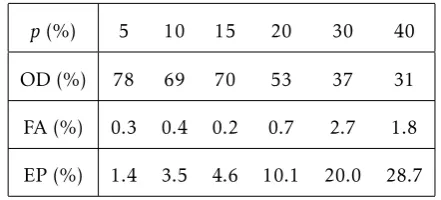
Table III shows the performance of the combination of theknearest distance and the nearest distance based outlier detection method. From this table, we can see the the performance is better than that of using k nearest distance and the nearest distance based method alone.
Table 1. k Nearest Distance Based Simulation Result (p Indicates Prior Error Probability), OD denotes Outlier Detection, FA denotes False Alarm and EP denotes Error Probability.)
p(%) 5 10 15 20 30 40
OD (%) 84 86 98 97 97 97
FA (%) 9.5 21.4 30.9 38 53.7 67.8
EP (%) 9.4 19.7 26.5 31 38.3 41.6
Table 2. The Nearest Distance Based Simulation Result (p Indicates Prior Error Probability), OD denotes Outlier Detection, FA denotes False Alarm and EP denotes Error Probability.)
p(%) 5 10 15 20 30 40
OD (%) 80 70 70 53 37 31
FA (%) 1.3 1.2 1.2 1.3 3.1 1.9
EP (%) 2.2 4.0 5.6 10.5 21.0 28.7
Table 3. The Combination Method Simulation Result (pIndicates Prior Error Probability, OD denotes Outlier Detection, FA denotes False Alarm and EP denotes Error Probability.)
p(%) 5 10 15 20 30 40
OD (%) 78 69 70 53 37 31
FA (%) 0.3 0.4 0.2 0.7 2.7 1.8
EP (%) 1.4 3.5 4.6 10.1 20.0 28.7
Table 4. The MD In [9] Based Simulation Result (p Indicates Prior Error Probability), OD denotes Outlier Detection, FA denotes False Alarm and EP denotes Error Probability.)
p(%) 5 10 15 20 30 40
OD (%) 72 71 69 72 70 71
FA (%) 0.95 0.93 0.98 0.96 0.83 0.92
EP (%) 2.3 3.8 5.5 6.4 9.6 12.2
As a comparison, Table IV gives the performance of the Mahalanobis distance (MD) and KDE based approach in [9] on the same dataset. In this method,
5
EAI
European Alliancefor Innovation
EAI Endorsed Transactions on
Wireless Spectrum
Figure 5. Comparison of Proposed Method and The Method in [9] On Probability of Errors Corrected.
Figure 6. Comparison of Proposed Method and The Method in [9] On Probability of Errors Introduced.
when a new data is obtained, the Mahalanobis distance is calculated between the current arrival data and the mean of training data, then KDE is used to estimate the probability of this distance, if it is less than threshold , then the current arrival data is diagnosed as an outlier. From table IV, we can see that the performance of the proposed method is not better than the method in [9]. The reason is that the simulation performance of the outlier detection process depends on the sensor error rate, besides, the range in which the injected errors must lie is another factor influences the outlier detection performance, the closer the outlier to the ground true value, the harder it is to be detected.
Figure 7. Comparison of Proposed Method and The Method in [9] On Probability of Errors after Executing the Detection Algorithm.
Figure 8. Comparison of With and Without Sliding Window On Probability of Errors Corrected.
In previous experiments, the range of injected errors is wider than the normal value of vital signs. Fig 5-7 give the comparison of the performance of the proposed method and the method in [9], in which range of injected errors is set as the same to the normal value range. From these figure, we can see that the proposed method has a better performance when the faults appear in the range of most normal vital sign data occurs.
4.2. Performance With Sliding Window
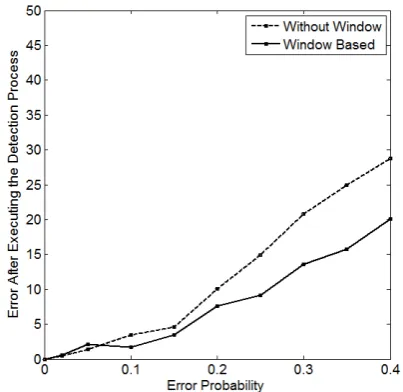
Fig. 8-10 show the comparison of the distance based method with and without sliding window. We can see
6
EAI
European Alliancefor Innovation
EAI Endorsed Transactions on
Wireless Spectrum
Figure 9. Comparison of With and Without Sliding Window On Probability of Errors Introduced.
Figure 10. Comparison of With and Without Sliding Window On Probability of Errors after Executing the Detection Algorithm.
that, the method with sliding window has a high outlier detection rate. Although its false alarm rate is a little higher, but the error rate after executing the outlier detection algorithm is obvious lower.
5. Conclusion
Outlier detection is very important for BSNs to avoid false medical diagnosis and false alarms. In this paper, we formalize a distance based method for outlier detection of BSNs. This method consider both distance to k nearest neighbors and to the left and right neighbors. To deal with the condition like successive
errors, we formalize a sliding widow based method to improve the performance of the outlier detection method. To handle errors in the training data, we introduce a Hidden Markov Model based method to estimate the most probable ground truth values which have the maximum probability to produce the training data. Simulation results show that the proposed method possesses a good performance.
6. Acknowledgment
Part of this work has been supported by the National Natural Science Foundation of China (NSFC, No. 61373043, 61372073, 61003079), and the Fundamental Research Funds for the Central Universities (No. JB140316).
References
[1] B. Krishnamachari and S. Iyengar, Distributed Bayesian Algorithms for Fault-Tolerant Event Region Dectection in Wireless Sensor Networks. IEEE Transactions on Computers, 53(3):241-250, 2004.
[2] X. Luo, M. Dong, and Y. Huang. On distributed fault-tolerant detection in wireless sensor networks. IEEE Transactions on Computers, 55(1): 58-70, 2006.
[3] W. Wu, X. Cheng, M. Ding, K. Xing, F. Liu, and P. Deng. Localized Outlying and Boundary Data Detection in Sensor Networks, IEEE Transactions on Knowledge and Data Engineering, 19(8): 1145-1157, 2007.
[4] A. Annichini, E. Asarin, A. Bouajjani. Symbolic Tech-niques for Parametric Reasoning about Counter and Clock Systems. The Proceeding of 12th International Confer-ence on Computer Aided Verification, LNCS 1855, pp. 419ĺC434, 2000.
[5] D.J. Kim and B. Prabhakaran. Motion fault detection and isolation in body sensor networks. IEEE International Conference on Pervasive Computing and Communica-tions, pp. 147-155, 2011.
[6] Y. Chen, Y. Zi, H. Cao, Z. He, H. Sun. A data-driven threshold for wavelet sliding window denoising in mechanical fault detection. Science China (Technological Sciences),03: 589-597, 2014.
[7] Jie Ying, T. Kirubarajan, Krishna R. Pattipati. A Hidden Markov Model-Based Algorithm for Fault Diagnosis with Partial and Imperfect Tests. IEEE Transactions on Systems, Man and Cybernetics, 30(4): 463-473, 2000. [8] O. Salem, A. Guerassimov, A. Mehaoua, A. Marcus and B.
Furht. Sensor Fault and Patient Anomaly Detection and Classification in Medical Wireless Sensor Networks. IEEE International Conference on Communications, pp. 4373-4378, 2013.
[9] O. Salem, Y. Liu and A. Mehaoua. Anomaly Detection in Medical Wireless Sensor Networks. Journal of Computing Science and Engineering, 7(4): 272-284, 2013.
[10] Physionet, http://www.physionet.org/cgi-bin/atm/ATM.
[11] M.M. Breunig, H.P. Kriegel, R.T. Ng, et al. LOF: Identifying Density-Based Local Outliers. ACM Sigmod Record. 29(2): 93-104, 2000.
7
EAI
European Alliancefor Innovation
EAI Endorsed Transactions on
Wireless Spectrum
[12] K. Niu, F. Zhao and X. Qiao. An Outlier Detection Algo-rithm in Wireless Sensor Network Based on Clustering. Proceedings of 15th IEEE International Conference on Communication Technology, 2013
[13] S. Rajasegarar, C. Leckie, M. Palaniswami, and J.C. Bezdek, Distributed Anomaly Detection in Wireless Sensor Networks, IEEE ICCS, 2006.
8
EAI
European Alliancefor Innovation
EAI Endorsed Transactions on
Wireless Spectrum
![Figure 5. Comparison of Proposed Method and The Method in[9] On Probability of Errors Corrected.](https://thumb-us.123doks.com/thumbv2/123dok_us/8432807.1698401/6.595.66.262.341.542/figure-comparison-proposed-method-method-probability-errors-corrected.webp)