R E S E A R C H
Open Access
Visualization of the 3D structures of small
organisms via LED-SIM
Yongying Ruan
1,3†, Dan Dan
2†, Mengna Zhang
1,3, Ming Bai
1*, Ming Lei
2, Baoli Yao
2and Xingke Yang
1*Abstract
Background:Innovative new techniques that aid in the visualization of microscopic anatomical structures have improved our understanding of organismal biology significantly. It is often challenging to observe internal 3D structures, despite the use of techniques such as confocal laser scanning microscopy (CLSM), micro-computed tomography (Micro-CT), magnetic resonance imaging (MRI), focused ion beam scanning electron microscopy (FIB-SEM) and others. In the current paper, we assess LED-SIM (DMD-based LED-illumination structured illumination microscopy), which facilitates the acquisition of nano- and micro-3D structures of small organisms in a
high-resolution format (500 nm in the XY-plane and 930 nm along the Z-axis).
Results:We compare other microstructural imaging techniques (involving conventional optical microscopy, CLSM and Micro-CT) with LED-SIM to assess the quality (e.g. resolution, penetration depth, etc.) of LED-SIM images, as well as to document the potential short-comings of LED-SIM. Based on these results we present an optimized set of protocols to ensure that LED-SIM arthropod and nematode samples with different cuticles or textures are prepared for analysis in an optimal manner. Six arthropod and nematode specimens were tested and shown to be suitable for LED-SIM imaging, which was found to yield high resolution 3D images.
Conclusions:Although LED-SIM still must be thoroughly tested before it is widely accepted and the Z-axis resolution still requires improvement, this technique offers distinct high quality 3D images. LED-SIM can be highly effective and may provide high quality 3D images for zoological studies following the guidelines of sample preparation presented in the current paper.
Keywords:3D imaging, Micro-structures, Structured illumination microscopy, LED illumination, Microscopy, Morphology
Background
Microscopy techniques have been playing an important role in modern zoology. In recent decades, varieties of sectioning technologies have emerged to improve the quality of microscopic images [1–9], which can be divided into non-optical and optical strategies. Non-optical strat-egies include micro-computed tomography (Micro-CT)/ nano-computed tomography (Nano-CT), magnetic reson-ance imaging (MRI), focus ion beam scanning electron microscopy (FIB-SEM)/serial block-face scanning electron microscopy (SBF-SEM) and so forth. Optical strategies involve confocal laser scanning microscopy
(CLSM)/two-photon excitation microscopy (TPEM), selective plane illumination microscopy (SPIM), structured illumination microscopy (SIM) and so forth.
Micro-CT is an extensively used 3D imaging technique in zoology. It derived from computed tomography (CT), which has been used as a medical diagnostic tool since the early 1970s [10, 11]. With maximum spatial resolution of about 0.5μm, it is routine to image hard and dry samples of approximately 1 ~ 200 mm in size. The imaging time usually takes a few hours. Other CT variants, such as Nano-CT, although capable of finer resolution (approxi-mately 0.1 μm) and faster scanning speed (generally less than 1 h, e.g., 10 ~ 30 min), the size of sample should be in hundreds of micrometers. Based on the principle of nuclear magnetic resonance (NMR), MRI is predominantly used to measure the distribution of hydrogen protons within a sample [12], which makes MRI a technique ideally suited * Correspondence:[email protected];[email protected]
†Equal contributors
1Key Laboratory of Zoological Systematics and Evolution, Institute of
Zoology, Chinese Academy of Sciences, Beijing 100101, China Full list of author information is available at the end of the article
for imaging soft tissues, in many cases without using contrast agents. That is the reason why it is widely applicable to human body or organism containing plenty of water. FIB-SEM and SBF-SEM are block face imaging tech-niques in the family of SEM. With astonishing high resolution of approximately 4 ~ 7 nm, they are usually only suitable for samples in size of less than 1 mm. However, it would take many hours to obtain image stacks, and high-energy electrons may invade and damage the samples during the imaging process. For SBF-SEM there is a option to collect the sections of samples, while in FIB-SEM the sample would be pulverized.
In the field of light microscopy, CLSM and TPEM are the most regularly used techniques for obtaining high quality of optically sectioned images, which can be recon-structed and rendered in 3D by computers [5, 6, 13, 14]. However, both of them involve raster point scanning using an excitation laser source, leading to the drawbacks of complex configuration and being time-consuming. With a maximum resolution of approximately 0.2μm, wide-field fluorescence microscopies with sectioning capability, in-cluding SPIM [7] and SIM [15–18], have recently met lots of interest due to the advantages of high spatial resolution, short image recording time and less photobleaching. SPIM utilizes a sheet beam to excite the fluorophores only in the small region around the in-focus plane. Since one sec-tioned slice can be obtained in only single shot, recording rapid process of animal’s retina and zebra-fish embryo have been reported and demonstrated by a few biological
researchers [7, 19, 20]. However, because of the geometry of perpendicular detection against the sheet plane, they are not competent for non-transparent specimens. SIM is a wide-field technique in which a grid pattern is superim-posed on the specimen while capturing images. The grid pattern is shifted in steps between the capture of each image set. The net result is the removal of out-of-focus fluorescence producing an increase in resolution beyond that of a general microscope, while allowing depth discrimination permitting 3D imaging. SIM has found numerous applications for time-lapse imaging of living tissues and cellular structures [21–23]. It was invented by Neil et al. [15] as a method of eliminating the out-of-focus background encountered in the wide-field microscopy. Furthermore, Gustafsson et al. [16–18] exploited the SIM to improve the spatial resolution based on a disparate theory, i.e. super-resolution SIM. In this paper, we only focus on the optical sectioning SIM.
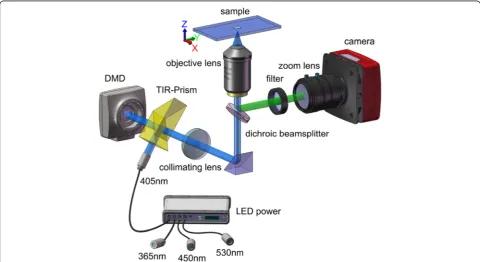
We assess LED-SIM (DMD-based LED-illumination structured illumination microscopy, Fig. 1) for zoological studies of 3D structures in invertebrates, including round-worms, crustaceans, mites and insects. LED-SIM was first introduced by Dan et al. [24]. It has fast recording speed, high imaging quality and a compact and low cost configur-ation compared to the traditional SIMs. In LED-SIM, grid-pattern shifting is done exceptionally fast (i.e., 100Hz) so that imaging is essentially instant. This enables one to acquire and display optical sectioning images in real time [24]. The critical benefits of LED-SIM are that low
illumination intensity light (1 w/cm2, less light than tech-niques such as CLSM) can be used, so fluorophores experi-ence less photobleaching and standard fluorophores such as GFP or even scattering samples can be used. Thus LED-SIM is ideal for imaging of 3D structures in zoological stud-ies. Here, we introduce LED-SIM and compare it to a few (not all of them) popular alternative techniques, involving conventional optical microscopy, CLSM and Micro-CT. We found that LED-SIM offered a distinct improvement over optical microscopes in terms of fast providing high-quality 3D images, as well as advantages over other advanced methods due to its affordability and ease of use. In addition, different preparation methods were also utilized to obtain better images according to the textures of
the samples. For example, samples that have a tough cuticle (e.g., leg of flea beetleClavicornalticasp.) were cleared in H2O2for better penetration, and samples with low
autoflu-orescence (e.g., water flea Daphnia sp.) were stained with Congo red for imaging. Several slide mounting media were used, such as Hoyer’s medium (spermatheca of feathering beetle Acrotrichis sp.), glycerin (e.g., parasitic wasp Aphitis
sp.) and methylcellulose (roundwormPanagrellus redivivus).
Results
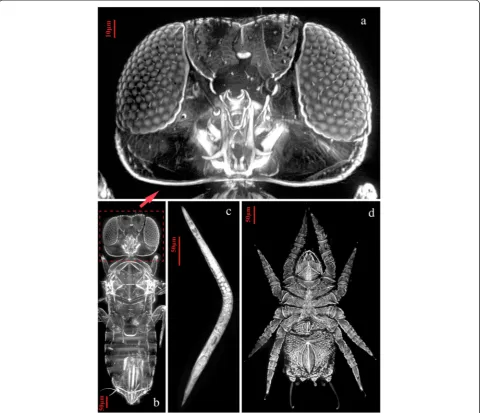
All the samples we tested have proven to be suitable for LED-SIM imaging. Structures of these small organisms are clearly illustrated (Figs. 2, 3 and 4). All samples for LED-SIM imaging in current paper were under the
Fig. 2LED-SIM images of different small organisms.aDetail of the head ofAphytissp. digitally zoomed from inset (b);bparasitic waspAphytis
excitation of 405 nm LED light and 20×/NA0.45 object-ive lens, which yielded a XY plane resolution of 500 nm and field-of-view (FOV) of 320 μm × 320μm. The num-ber of Z-stack images depended on the thickness of sam-ples. The Z-scanning step was set to 200 nm. For large size samples, several subviews were required in order to stitch them into an extended FOV. Images obtained by CLSM, Micro-CT and conventional optical microscope are also provided as comparisons with LED-SIM imaging (Figs. 3 and 4). The time cost of imaging is the main advantage of LED-SIM, and its imaging speed is faster than other routine methods. The performances of LED-SIM and other techniques for each sample are as following:
Sample No. 1 (Fig. 2a, b; Fig. 5): Aphytis sp. (Insecta: Hymenoptera). Imaging system: LED-SIM. X-Y plane resolution: 500 nm. Z-stack of images: 98 frames, 5 sub-view stacks. Time of imaging: 3.35 min. Ten frames are selected from 98 frames along the Z-axis and presented in Fig. 5. The last three frames present strong interfer-ences due to the thickness of the sample. Despite the
weak cuticle of this sample, penetration depth achieved is only approximately 100μm.
Sample No. 2 (Fig. 2c): Panagrellus redivivus (Nema-toda: Panagrolaimidae). Imaging system: LED-SIM. X-Y plane resolution: 500 nm. Z-stack of images: 26 frames, 1 view-stack. Time of imaging: 15.85 s. Many details (e.g. pharynx, intestine, ovary, etc.) of Panagrellus redivivus
with protein-abundant cuticle were shown clearly under LED-SIM (Fig. 2c), which indicates that this type of speci-mens are suitable for LED-SIM imaging.
Sample No. 3 (Fig. 2d): an unknown species of mite (Arachnida). Imaging system: LED-SIM. X-Y plane reso-lution: 500 nm. Z-stack of images: 89 frames, 6 subview-stacks. Time of imaging: 3.66 min. This mite species has strong cuticle, which limits light penetration, thus Fig. 2d presents very fine details on the surface of the specimen instead of internal structures.
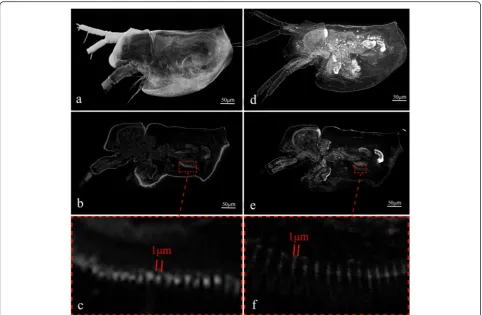
Sample No. 4–1 (Fig. 3a-c; Additional file 1: Movie S1):
Daphnia sp. (Crustacea, Cladocera). Imaging system: CLSM (Leica TCS SP8, Leica Inc., Solms, Germany). Light source: 561 nm. Objective lens: HCX IRAPO L 25×/0.95
WATER, Leica Inc., Solms, Germany. X-Y plane reso-lution: 1.213μm. Z-stack of images: 150 frames. Time of imaging: approximately 15 min.
Sample No. 4–2 (Fig. 3d-f; Additional file 2: Movie S2): the same sample as Sample 4–1. Imaging system: LED-SIM. Z-stack of images: 113 frames, 12 subview-stacks. Time of imaging: 18.32 min. Compared to CLSM image, LED-SIM images present a better resolution along the lateral axis (with the highest resolution of 500 nm), but a slight loss of resolution along the Z-axis (with the highest resolution of 930 nm). It can be seen from the movie (Additional file 2: Movie S2) that both CLSM and LED-SIM fail to illustrate details when imaging depth exceeds approximately 100μm.
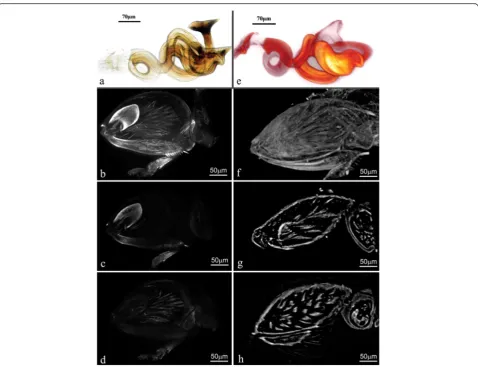
Sample No. 5–1 (Fig. 4b-d): meta-femur of Clavicornal-ticasp. (Insecta: Coleoptera). Imaging system: LED-SIM.
X-Y plane resolution: 500 nm. Z-stack of images: 67 frames, 3 subview-stacks. Time of imaging: 4 min. Although the meta-femur ofClavicornalticasp. is covered with extremely strong cuticle, the internal structures (e.g., muscles and metafemoral spring) can still be imaged with proper treat-ment (bleached in 30 % H2O2in present sample).
Sample No. 5–2 (Fig. 4f-h): Meta-femur of Clavicornal-tica sp. Imaging system: Micro-CT (MicroXCT-400, Carl Zeiss X-ray Microscopy, Inc., Pleasanton, USA). Light source: X-ray. Objective lens: 40×. X-Y plane resolution: 10μm. Z-stack of images: 1000 frames. Time of imaging: approximately 24 h. A comparison of LED-SIM and Micro-CT images is presented in Fig. 4b-d, f-h.
Sample No. 6–1 (Fig. 4e, Additional file 3: Movie S3): spermatheca of Acrotrichis sp. (Insecta: Coleoptera). Imaging system: LED-SIM. X-Y plane resolution: 500 nm.
Z-stack of images: 50 frames, 1 view-stack. Time of im-aging: 40.49 s.
Sample No. 6–2 (Fig. 4a): the same sample as Sample 6– 1. Imaging system: conventional microscope (Zeiss Axiostar plus, Zeiss Inc., Göttingen, Germany). Light source: visible light. Objective lens: (Zeiss A-Plan 20×/0.45, Zeiss Inc., Göttingen, Germany). X-Y plane resolution: approximately 1 μm. Z-stack of images: 20 frames. Time of imaging: approximately 10 min. A comparison of LED-SIM and conventional microscopy images is presented in Fig. 4a, c.
For LED-SIM imaging, various methods were utilized for the preparation of samples. All Arthropoda samples were absolute ethanol-preserved and the nematode was fixed in 4 % paraformaldehyde. Samples (No. 2, 3, 4) without high autofluorescence were stained with 0.15 % Congo red solu-tion. Sample No. 1, 5 and 6 were not stained as they already exhibit strong autofluorescence under LED light (405 nm). Sample No. 5 with strong exoskeleton was bleached by 30 % H2O2 before mounting. Samples were mounted in
glycerin, Hoyer’s medium or 3 % methylcellulose on a slide glass. The aim of using Hoyer’s mounting medium was to test whether this type of specimens are suitable for LED-SIM imaging, as a large number of museum-preserved specimens in modern zoological studies are mounted in Hoyer’s medium or neutral balsam (both with strong fluor-escence), including valuable type specimens.
Discussion
In the present study, there were only four different wave-lengths of high-power LED light available (365 nm, 405 nm, 450 nm, and 530 nm). These four different wave-lengths were all tested, and it turned out that 405 nm LED light is optimal for resilin-rich arthropod specimens. Thus it was employed for autofluorescent specimens in current study. Additionally, we found 405 nm LED light is also effectual for Congo red stained specimens when the opti-mal wavelength (561 nm [25]) is not available. The obtained images (Figs. 2, 3, 4 and 5) prove that the 405 nm LED light
is a good excitation source for both Congo red stained and autofluorescent specimens. As 405 nm laser source is unavailable in our CLSM system, we used 561 nm laser light in CLSM imaging to yield best images for comparison with LED-SIM.
The comparison (Fig. 4a, e) of a LED-SIM image and a traditional optical image of the same spermatheca of a feather-winged beetle indicated that the LED-SIM tech-nique had the ability to visualize internal structures of small organisms with good quality. LED-SIM, with higher reso-lution, showed more clear and distinct 3D structures, which can be important to taxonomists studying reproductive structures in small specimens. Many“non-destructive dis-sections” and “virtual dissections” [26] of slide-mounted specimens could be accomplished by LED-SIM. The spermatheca sample (with good autofluorescence) we use in this paper was mounted in Hoyer’s medium without staining. Most of the museum slides containing preserved structures or specimens were prepared in a similar way. LED-SIM could be useful to generate 3D computer images of valuable specimens that mounted in Hoyer’s medium, glycerin, or neutral balsam.
Most LED-SIM images we obtained presented a good resolution along the lateral axis (with the highest resolution of 500 nm), but with a slight loss of resolution along the Z-axis (with the highest resolution of 930 nm). Similar results were found in a previous study comparing commercial CLSM and SIM devices [27]. The suitable size (currently limited by the objective lens) for samples is less than one centimeter. Preferable thickness of samples is less than 100 μm. Although Dan et al. (2013) [24] found that a 200 μm penetration depth was reached at the imaging of the Golgi-stained neuron cells, our results demonstrated that LED-SIM images presented strong interference when the sample thickness exceeded approximately 100μm (e.g., Fig. 5). This may be due to the property of the samples that we used, most of which have strong cuticles and hard internal structures. Not only the property of samples, but also the mounting media and wavelength of LED light are important factors that could influence the penetration depth. Generally, LED-SIM is not able to compete with many techniques (such as SPIM, LSFM and OPT) in respect of penetration depth, but LED-SIM has preferable resolution in terms of lateral axis. Meanwhile, LED-SIM still has insuf-ficient axial resolution compared to some other techniques, such as SIM microscopy using three beams for interference illumination [20, 23, 28] or SR-SIM combining ultrathin planar illumination produced by scanned Bessel beams [29]. Dan et al. (2013) [24] proposed to combine a micro-optical sectioning tomography (MOST) system [30] with a LED-SIM system, in which case a nearly isotropic sub-micron spatial resolution in all three dimensions can be achieved.
As visualization becomes increasingly important in func-tional and evolutionary studies [31], resolution is one of the
most important features of imaging equipment, as well as related technical features such as imaging speed, data size, and penetration depth. The resolution of 500 nm in the XY-plane and 930 nm along the Z-axis was achieved with a 20× objective lens (Plan Fluor ELWD 20×/NA0.45, Nikon Inc., Tokyo, Japan) in the current study, while the finest XY-plane resolution of LED-SIM could approach 90 nm with a 100× objective lens (Apo TIRF, NA1.49, Nikon Inc., Tokyo, Japan) [24]. The imaging speed of a complete stack of images (for 3D representation) ranged from tens of seconds to a few minutes and was dependent on the reso-lution and the number of frames required.
Conclusion
The conventional optical microscopy is remains the imaging system that most researchers utilize, due to its affordability for small laboratories or small research groups. However, conventional microscopes have difficulties in visualizing internal structures of biological samples. Three-dimensional imaging is now possible due to innovative imaging tech-niques, as well as powerful computers and software to generate 3D renderings. The insights gained from these im-ages have advanced knowledge throughout the life sciences.
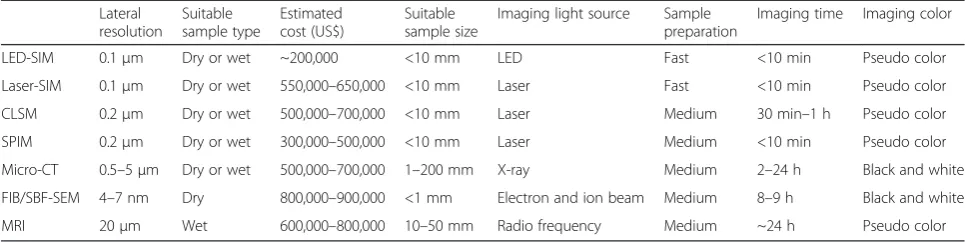
Research in many directions in comparative zoology has seen a surge in activity recently, enabled by the innovation of microscopic methods and techniques. These applications of innovative techniques include Micro-CT, CLSM, MRI, etc. (Table 1). LED-SIM can neither provide extraordinarily fine lateral resolution (such as FIB-SEM does) nor perfect isotropic resolution (such as Micro-CT does), and there are also difficulties in imaging of samples that exceed 100 μm in thickness. However, it might offer advantages for imaging of fluorescent signals (either labelled signals or autofluores-cence) in small animal samples due to its affordability and ease of use.
The remaining challenges for LED-SIM include providing more options of LED wavelength, advanced optimization and simplification of the imaging apparatus. Although the axial resolution of LED-SIM is currently not considered to be high, it hopefully will be improved by combining LED-SIM with other techniques (e.g., optical sectioning tomog-raphy technology).
Methods
Sample preparation
All specimens used in this study are housed in the Insti-tute of Zoology of the Chinese Academy of Sciences (IZAS).
in glycerin on a slide glass; subsequently, the margins of the cover glass were sealed by nail polish.
Sample No. 2 (Fig. 2c). Scientific name: Panagrellus redivivus (Nematoda: Panagrolaimidae). Specimens were obtained from an aquarium company in Shijiazhuang, Hebei, China. Sample preparation: live specimens were selected and fixed in 4 % paraformaldehyde for 1 h, stained in 0.15 % Congo red solution for approximately 5 min, and then mounted in 3 % methylcellulose (prevents soft samples from shrinking) on a slide glass; subsequently, the margins of the cover glass were sealed by nail polish.
Sample No. 3 (Fig. 2d). Scientific name: unknown spe-cies of mite (Arachnida). Specimens were collected from the Qinling Mountains, Shaanxi, China. Sample prepar-ation: absolute ethanol-preserved specimens were se-lected, stained in 0.15 % Congo red solution for approximately 5 min, and then mounted in glycerin on a slide glass; subsequently, the margins of the cover glass were sealed by nail polish.
Sample No. 4–1 (Fig. 3a-c), Sample No. 4–2 (Fig. 3d-f ). Scienti3d-fic name: Daphnia sp. (Crustacea, Cladocera). Specimens were obtained from an aquarium company in Putian, Fujian, China. Sample preparation: freshly hatched specimens were selected and then killed in ab-solute ethanol, stained in 0.15 % Congo red solution for approximately 5 min, and mounted in glycerin on a slide glass; subsequently, the margins of the cover glass were sealed by nail polish.
Sample No. 5–1 (Fig. 4b-d). Meta-femur of Clavicor-nalticasp. (Insecta: Coleoptera). Specimens were collected from a field in Fuan, Fujian, China. Sample preparation: absolute ethanol-preserved specimens were selected, the meta-femurs were carefully torn off, without staining, steeped in 30 % H2O2, heated for a few minutes to bleach
the cuticle, washed in distilled water for several times, and then mounted in glycerin on a slide glass; subsequently, the margins of the cover glass were sealed by nail polish.
Sample No. 5–2 (Fig. 4f-h). Meta-femur of Clavicornal-tica sp. (Insecta: Coleoptera). Specimens were collected from a field in Fuan, Fujian, China. Sample preparation:
absolute ethanol-preserved specimens were selected, the meta-femurs were carefully torn off and dried at the critical point (hcp-2, Hitachi Inc., Tokyo, Japan), and then glued to the tip of a micropipette using nail polish.
Sample No. 6–1 (Fig. 4e), Sample No. 6–2 (Fig. 4a). Spermatheca of Acrotrichis sp. (Insecta: Coleoptera). Specimens were collected from the Qinling Mountains, Shaanxi, China. Sample preparation: absolute ethanol-preserved specimens were selected, and the spermatheca were directly mounted in Hoyer’s medium on slide glass after dissection; subsequently, the margins of the cover glass were sealed by nail polish.
Congo red staining: The formulation of Congo red solution followed Michels and Buentzow (2010; 1.5 mg per milliliter of distilled water) [25]. After staining, the samples were washed in distilled water until no residual Congo red was present. The preparation and formulation of Hoyer’s medium followed Van der Meer (1977) [32].
These six different materials were selected from different invertebrate clades to represent a broad set of samples: e.g., roundworms (Nematoda) with protein-abundant cuticle and arthropods (Arthropoda) with cuticle dominated by chitin. First, amongst the arthropods, flea beetles (Insecta, Coleoptera, Clavicornaltica sp.) and mites (Arachnida, Acarina, unknown species) were selected to represent specimens with strong cuticle and limited light penetration. Second, water fleas (Crustacea, Cladocera, Daphnia sp.) and parasitoid wasps (Insecta, Hymenoptera, Aphytis sp.) were selected to represent specimens with weak cuticle and fragile internal structures. Third, a spermatheca of a feather-winged beetle (Insecta, Coleoptera, Acrotrichissp.) was selected to represent fine internal structures of invertebrates.
Imaging systems and image processing
The LED-SIM system (Xi’an Institute of Optics and Pre-cision Mechanics, Chinese Academy of Sciences) used in the current paper is illustrated in Fig. 1. A wavelength-switchable and high-power LED (UP314, UVATA Inc., China) was used as the light source. A digital micro-Table 1Comparison of the features of different major 3D imaging systems used in zoological studies. The features of the different methods are based on our knowledge of the different pieces of equipment established by our previous studies; various statistics from recent papers are also referenced
Lateral resolution Suitable sample type Estimated cost (US$) Suitable sample size
Imaging light source Sample preparation
Imaging time Imaging color
LED-SIM 0.1μm Dry or wet ~200,000 <10 mm LED Fast <10 min Pseudo color
Laser-SIM 0.1μm Dry or wet 550,000–650,000 <10 mm Laser Fast <10 min Pseudo color
CLSM 0.2μm Dry or wet 500,000–700,000 <10 mm Laser Medium 30 min–1 h Pseudo color
SPIM 0.2μm Dry or wet 300,000–500,000 <10 mm Laser Medium <10 min Pseudo color
Micro-CT 0.5–5μm Dry or wet 500,000–700,000 1–200 mm X-ray Medium 2–24 h Black and white
FIB/SBF-SEM 4–7 nm Dry 800,000–900,000 <1 mm Electron and ion beam Medium 8–9 h Black and white
mirror device (DMD) (1024 × 768 pixels, V-7000UV, ViALUX GmbH, Germany) modulated the incident light into structured sinusoidal patterns, which were then projected on the sample via an objective lens (Plan Fluor ELWD 20×/NA0.45, Nikon Inc., Tokyo, Japan). Fast phase-shifting was realized by refreshing the DMD chip. Through a 405 nm longpass filter, the excited fluorescence light was recorded by a highly dynamic and sensitive sCMOS camera (ORCA Flash 4.0, 2048 × 2048 pixels @ 100 fps, Hamamatsu Inc., Tokyo, Japan). In front of the camera, a zoom lens (70–300 mm, F/4-5.6, Nikon Inc., Tokyo, Japan) and an extender lens (N-AF 2× Teleplus MC4, Kenko Inc., Tokyo, Japan) were incorporated with the objective lens to produce variable magnification of the image. The sample was mounted on a manual XY and motorized Z-axis translation stage (M-405.PG, Physik Instrumente Inc., Karlsruhe, Germany) that was able to scan axially in minimum step of 50 nm. Automated data collection, DMD pattern generation, and motorized stage movement were implemented by custom software programmed in C++.
A commercial laser confocal system Leica TCS SP8 (Leica Inc., Solms, Germany) and a Micro-CT system MicroXCT-400 (Carl Zeiss X-ray Microscopy, Inc., Pleasanton, USA) (both in the Institute of Zoology, Chinese Academy of Sciences) were used to capture 3D images for comparison to LED-SIM.
Amira 5.4.1 (Visage Imaging, San Diego, USA) and Imaris 7.2.1 (Bitplane Inc., Zurich, Switzerland) software were used to produce 3D images. In addition, a conventional optical imaging system consisting of a Zeiss Axiostar plus micro-scope (Zeiss Inc., Göttingen, Germany), Nikon D300 digital camera (Nikon Inc., Tokyo, Japan) and Helicon Focus 6 software was used to capture and compose 2D images. The final figures were prepared with Photoshop CS5 (Adobe, San Jose, USA) and Illustrator CS5 (Adobe, San Jose, USA).
Additional files
Additional file 1: Movie S1.3D animation of the structures of a freshly hatched water fleaDaphniasp. obtained by CLSM (for comparison with LED-SIM). (MP4 8973 kb)
Additional file 2: Movie S2.3D animation of the structures of a freshly hatched water fleaDaphniasp. (the same sample used in movie S1) obtained by LED-SIM. (MP4 9282 kb)
Additional file 3: Movie S3.3D animation of the spermatheca of feather-winged beetleAcrotrichissp. obtained by LED-SIM. (MP4 19818 kb)
Acknowledgements
This research was supported by the National Natural Science Foundation of China (11404389, 3010300101, 31372239 and 81427802), the National Science Fund for Fostering Talents in Basic Research (Special Subjects in Animal Taxonomy, NSFC-J1210002), Research Equipment Development Project of Chinese Academy of Sciences (YZ201509), the Special Fiscal Funds of Shaanxi Province (No. 2013–19) and a Humboldt Fellowship (M.B.) from the Alexander von Humboldt Foundation. The authors thank Dr. Sean Schoville (University of Wisconsin-Madison, USA), Dr. Alexander Konstantinov
(National Museum of Natural History, USA) and Prof. Norman MacLeod (The Natural History Museum, London, UK) for providing suggestions in writing our manuscript and Zezhang Hu (Fujian Agricultural and Forestry University, China) for providingAphitissp. specimens.
Authors’contributions
YR and DD conceived the general idea of the study, and DD, YR and MZ conducted most of the laboratory work. YR drafted the manuscript, and MB, ML, BY and XY contributed to part of the design of experiments and revision of the manuscript. All authors read and approved the final manuscript.
Competing interests
The authors declare that they have no competing interests.
Author details
1Key Laboratory of Zoological Systematics and Evolution, Institute of
Zoology, Chinese Academy of Sciences, Beijing 100101, China.2State Key
Laboratory of Transient Optics and Photonics, Xi’an Institute of Optics and Precision Mechanics, Chinese Academy of Sciences, Xi’an 710119, China.
3University of Chinese Academy of Sciences, Beijing 100039, China.
Received: 5 January 2016 Accepted: 2 June 2016
References
1. Verdaasdonk JS, Stephens AD, Haase J, Bloom K. Bending the rules: widefield microscopy and the Abbe limit of resolution. J Cell Physiol. 2014; 229:132–8.
2. Weisshart K, Dertinger T, Kalkbrenner T, Kleppe I, Kempe M. Super-resolution microscopy heads towards 3D dynamics. Adv Opt Technol. 2013;2:211–31. 3. Inoué S. Foundations of confocal scanned imaging in light microscopy. In: Pawley JB, editor. Handbook of biological confocal microscopy. New York: Springer; 2006. p. 1–19.
4. Abbe E. Beitrage zur theorie des mikroskops und der mikroskop ischen wahrnehmung. Arch Mikroskop Anat. 1873;9:413–68.
5. Minsky M. Memoir on inventing the confocal scanning microscope. Scanning. 1988;10(4):128–38.
6. Amos WB, White JG. How the confocal laser scanning microscope entered biological research. Biol Cell. 2003;95:335–42.
7. Huisken J, Swoger J, Del Bene F, Wittbrodt J, Stelzer EHK. Optical sectioning deep inside live embryos by selective plane illumination microscopy. Science. 2004;305:1007–9. doi:10.1126/science.1100035.
8. Sharpe J, Ahlgren U, Perry P, Hill B, Ross A, et al. Optical projection tomography as a tool for 3D microscopy and gene expression studies. Science. 2002;296:541–5. doi:10.1126/science.1068206.
9. Wicker K, Heintzmann R. Resolving a misconception about structured illumination. Nature Photon. 2014;8(5):342–4.
10. Hounsfield GN. A method of and apparatus for examination of a body by radiation such as X- or gamma-radiation. British Patent No. 1.283.915, London. 1972.
11. Hounsfield GN. Computerized transverse axial scanning (tomography): Part 1. Description of system. British J Radiol. 1973;46(552):1016–22. 12. Ziegler A, Faber C, Mueller S, Bartolomaeus T. Systematic comparison and
reconstruction of sea urchin (Echinoidea) internal anatomy: a novel approach using magnetic resonance imaging. BMC Biol. 2008;6(33):1–15. doi:10.1186/1741-7007-6-33.
13. Denk W, Strickler JH, Webb WW. Two-photon laser scanning fluorescence microscopy. Science. 1990;248(4951):73–6.
14. So PTC, Dong CY, Masters BR, Berland KM. Two-photon excitation fluorescence microscopy. Annu Rev Biomed Eng. 2000;2(1):399–429. 15. Neil MAA, Juskaitis R, Wilson T. Method of obtaining optical sectioning by
using structured light in a conventional microscope. Opt Lett. 1997;22:1905–7. 16. Gustafsson MGL. Surpassing the lateral resolution limit by a factor of two
using structured illumination microscopy. J Microsc. 2000;198:82–7. 17. Gustafsson MGL. Nonlinear structured-illumination microscopy: wide-field
fluorescence imaging with theoretically unlimited resolution. Proc Natl Acad Sci. 2005;102:13081–6.
19. Huisken J, Stainier DYR. Selective plane illumination microscopy techniques in developmental biology. Development. 2009;136(12):1963–75.
20. Huisken J, Stainier DYR. Even fluorescence excitation by multidirectional selective plane illumination microscopy (mSPIM). Opt Lett. 2007;32(17):2608–10. 21. Kner P, Chhun BB, Griffis ER, Winoto L, Gustafsson MGL. Super-resolution
video microscopy of live cells by structured illumination. Nat Methods. 2009; 6(5):339–42.
22. Hirvonen LM, Wicker K, Mandula O, Heintzmann R. Structured illumination microscopy of a living cell. Eur Biophys J. 2009;38(6):807–12.
23. Shao L, Kner P, Rego EH, Gustafsson MGL. Super-resolution 3D microscopy of live whole cells using structured illumination. Nat Methods. 2011;8:1044–6. 24. Dan D, Lei M, Yao B, Wang W, Winterhalder M, Zumbusch A, et al.
DMD-based LED-illumination super-resolution and optical sectioning microscopy. Sci Rep. 2013;3(1116):1–7.
25. Michels J, Buentzow M. Assessment of Congo red as a fluorescence marker for the exoskeleton of small Crustaceans and the cuticle of Polychaetes. J Microsc. 2010;238:95–101.
26. Simonsen TJ, Kitching IJ. Virtual dissections through Micro-CT scanning: a method for non-destructive genitalia‘dissections’of valuable Lepidoptera material. Syst Entomol. 2014;39(3):606–18.
27. Weigel A, Schild D, Zeug A. Resolution in the ApoTome and the confocal laser scanning microscope: comparison. J Biomed Opt. 2009;14(1):014022. doi:10.1117/1.3083439.
28. Schermelleh L, Carlton PM, Haase S, Shao L, Winoto L, Kner P, Burke B., Cardoso MC, Agard DA, Gustafsson MGL., Leonhardt H, Sedat JW. Subdiffraction multicolor imaging of the nuclear periphery with 3D structured illumination microscopy. Science. 2008;320:1332–6.
29. Gao L, Shao L, Higgins CD, Poulton JS, Peifer M, et al. Noninvasive Imaging beyond the diffraction limit of 3D dynamics in thickly fluorescent specimens. Cell. 2012;151(6):1370–85.
30. Li A, Gong H, Zhang B, Wang Q, Yan C, et al. Micro-optical sectioning tomography to obtain a high-resolution atlas of the mouse brain. Science. 2010;330:1404–8.
31. Friedrich F, Matsumura Y, Pohl M, Bai M, Hörnschemeyer T, Beutel RG. Insect morphology in the age of phylogenomics: innovative techniques and its future role in systematics. Entomol Sci. 2014;17:1–24.
32. Van der Meer JM. Optical clean and permanent whole mount preparation for phase-contrast microscopy of cuticular structures of insect larvae. Dros Inf Serv. 1977;52:160.
• We accept pre-submission inquiries
• Our selector tool helps you to find the most relevant journal
• We provide round the clock customer support
• Convenient online submission
• Thorough peer review
• Inclusion in PubMed and all major indexing services
• Maximum visibility for your research
Submit your manuscript at www.biomedcentral.com/submit