Original Research Article
A study on the prevalence of acute and chronic malnutrition and
influence of feeding practices among 6 months to 2 years children in
rural field practice area of Kilpauk Medical College, Tamil Nadu
S. Dhanalakshmi, R. Selvaraj*
INTRODUCTION
Malnutrition is the major cause of mortality and morbidity among under five children in the form of permanent impairment of physical and mental growth of survivors.1 Globally, malnutrition affects nearly 150 million of under five children. Out of these, 120 million living in India, of which 75 million suffering from invisible PEM, which is difficult to monitor.1 For every diagnosed case of PEM, there are 10 others have
borderline malnutrition, which are undetected in the community.2 More than half (54%) of all deaths before age of five years in India due to malnutrition. Because of its extensive prevalence in India, mild to moderate malnutrition contributes to more deaths (43%) than severe malnutrition (11%).3 The NFHS-3 data shows that the prevalence of under nutrition rise up to two years of age thereafter more or less stabilizes.4 This indicates that first two years of life in children is most critical period. Under nutrition is substantially higher in rural than in
ABSTRACT
Background: In India, 54% of under five children death mainly due to under nutrition. First two years of age is most
critical. Nutritional status was assessed by using WHO standard growth chart. Wasting represents acute malnutrition, stunting with chronic, underweight represents both acute and chronic. Based on NFHS-3 data the prevalence of under nutrition rise up to 2 years of age, thereafter more or less stabilizes. Faulty feeding practices plays major role in under nutrition. Hence, this study carried out to assess nutritional status of 6 months to 2 years children in terms of acute and chronic malnutrition and to estimate the association of nutritional status with feeding practices.
Methods: Cross sectional study done during March to August 2016. Sample size estimated was 180. Stratified
random sampling method used to collect data among children in Peerkankaranai.
Results: Mean age of children was 15.82 months. About 61.2% belonged to 12 to 24 months age group. Sex
distributions were equal. About 55% belongs to middle socioeconomic status. The prevalence of underweight was 31.65, wasting 15%, stunting 45.6%. Male children affected by chronic malnutrition more than female children. Not initiating breast feeding within 4 hours of birth plays significant role in acute malnutrition. Prevalence of malnutrition was high among those not practising colostrum feeding and exclusive breast feeding. Only 15 mothers not influenced by formula feeding. Feeding frequency and traditional feeding practices had main role in chronic malnutrition.
Conclusions: The prevalence of under nutrition among study population was high among this area. Feeding practices
should be improved among the mothers.
Keywords: Underweight, Wasting, Stunting, Children, Feeding practices
Department of Community Medicine, Govt Mohan Kumaramangalam Medical College, Salem, Tamil Nadu, India
Received: 19 December 2018
Revised: 30 January 2019
Accepted: 02 February 2019
*Correspondence: Dr. R. Selvaraj,
E-mail: [email protected]
Copyright: © the author(s), publisher and licensee Medip Academy. This is an open-access article distributed under
the terms of the Creative Commons Attribution Non-Commercial License, which permits unrestricted non-commercial use, distribution, and reproduction in any medium, provided the original work is properly cited.
urban areas.4 Based on NFHS-3 report, among under three years children in rural area-stunted 47.2%, underweight 43%, wasting 24.1%.5 There is steep increase in prevalence of underweight from 27% at 6 months of age to 45% at 24 months of age. This mainly due to faulty infant and young child feeding practices in the community.6 The proportion of underweight for the first 20 months of age is 47% after that fluctuates.3 It has an adverse effects on economic growth of the country with an adult productivity loss of 1.4% of gross domestic product (GDP).7 Wasted children have 5-20 times higher risk of dying from common diseases like diarrhoea or pneumonia than normally nourished children.8 World health organization reported that malnutrition causes double burden. Across the world among under 5 years children, 156 million were stunted, 50 million wasted, 42 million have a problem of overweight.9 Hence this study was conducted to assess the nutritional status of 6 months to 2 years aged children in terms of acute and chronic malnutrition and to estimate the association of feeding practices on acute and chronic malnutrition among mothers.
METHODS
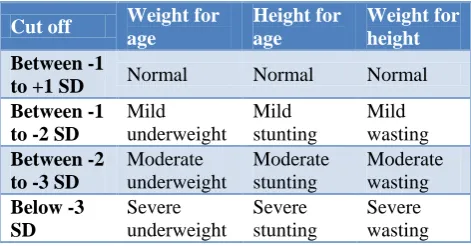
This cross sectional study was carried out among children aged 6 months to 2 years and their mothers of Peerkankaranai (rural field practice area of Kilpauk Medical College) during the period of March 2016 to August 2016. The sample size was 180, estimated by taking 95% confidence interval, z value of 1.96, and alpha error fixed at 5%, allowable error (absolute precision) 8%, the expected non response rate of 20%. The sampling procedure is stratified random sampling method, by using family register maintained by village health nurses. From each health sub centre 30 children were selected. The exclusion criteria was children with major congenital anomalies like cleft lip, cleft palate, and others and severe malnutrition due to chronic diseases. Data collection was done after getting approval for the study from Institutional Ethics Committee of Kilpauk Medical College. Data collection instrument was pretested structured survey questionnaire which contains (a) Socio demographic information including BG Prasad socioeconomic classification.10 (b) Anthropometric measurements like weight, height, mid-arm circumference. (c) Information regarding feeding practices. The physical instruments used in this study included were infantometer, digital salter weighing machine, flexible measuring tape and stethoscope. All these instruments and techniques were initially standardized during pilot study and were regularly calibrated throughout the period of data collection. Nutritional status was assessed based on WHO growth chart cut-off as in Table 1.
The data was analysed by using SPSS software version 23. All the categorical data like age, sex expressed as
proportion. Chi-square test was used to test the existence of significant association between the level of malnutrition and selected risk factors. The significant variables (p<0.05) observed in bivariate analysis were subsequently included in multivariate analysis.
Table 1: Assessment of malnutrition based on WHO growth chart.10,11
Cut off Weight for
age Height for age Weight for height Between -1
to +1 SD Normal Normal Normal
Between -1 to -2 SD
Mild underweight Mild stunting Mild wasting Between -2
to -3 SD
Moderate underweight Moderate stunting Moderate wasting Below -3 SD Severe underweight Severe stunting Severe wasting RESULTS
The present study was undertaken in the rural population of Peerkankaranai, Chennai. The study was conducted to find out the prevalence of acute and chronic malnutrition and its determinants like feeding practices among children of 6 months to 2 years. Table 2 shows the prevalence of under nutrition in this study was 31.6%. In this study, the main aim was to differentiate the prevalence of acute and chronic malnutrition separately. The prevalence of acute malnutrition was 15%, chronic 45.6%, both acute and chronic was 31.6%.
Table 2: Distribution of nutritional status among 6 months to 2 years children.
Nutritional status Weight for age N (%) Height for age N (%) Weight for height N (%)
Normal 98 (54) 76 (42.2 ) 90 (50)
High 25 (13.9) 22 (12.2) 63 (34.9)
Low
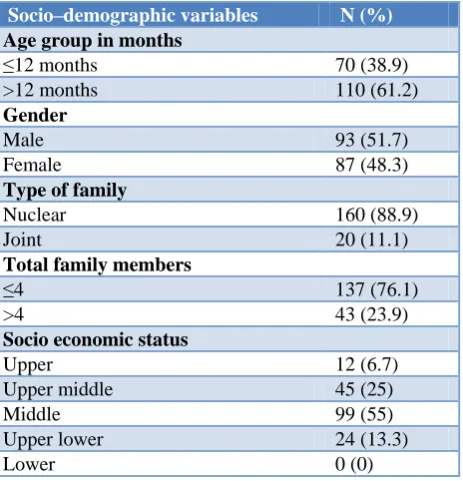
Table 3: Distribution of socio–demographic variables.
Socio–demographic variables N (%)
Age group in months
≤12 months 70 (38.9)
>12 months 110 (61.2) Gender
Male 93 (51.7)
Female 87 (48.3)
Type of family
Nuclear 160 (88.9)
Joint 20 (11.1)
Total family members
≤4 137 (76.1)
>4 43 (23.9)
Socio economic status
Upper 12 (6.7)
Upper middle 45 (25)
Middle 99 (55)
Upper lower 24 (13.3)
Lower 0 (0)
Table 5 shows, there was significant difference present in the acute malnutrition status among those mothers initiated breast feeding within 4 hours of birth. In this study, majority of mothers 157 (87.2%) initiated complementary feeding as semisolid food. Children who received liquid food in the initial period were affected more by acute malnutrition. Out of 180 children, only 15 mothers were not influenced by formula feeding. Also Self feeding practices improved the nutritional status of children. About 13% mothers acknowledged that they don’t feed their child as regular during illness. Only 36 mothers were aware of regular feeding during illness. Traditional feeding practices like gripe water and home available remedies were practiced by majority of mothers (97.8%) in the study group.
In Table 6, those factors which were statistically significant association in univariate analysis were subjected to multivariate analysis by logistic regression. After adjusting for all other covariates, those who were initiating complementary feeding ≤6 months of age had 14 times higher odds of developing acute malnutrition. Feeding frequency <3 times per day had 2.5 times higher odds of developing chronic malnutrition.
Table 4: Association of malnutrition across socio demographic variables.
Variables Total number Acute malnutrition Chronic malnutrition
N (%) P value N (%) P value
Age groups in months
≤12 70 6 (8.5)
0.054 25 (35.71) 0.034
>12 110 21 (19.09) 57 (51.82)
Gender
Male 93 11 (11.83)
0.218 52 (55.91) 0.004
Female 87 16 (18.39) 30 (34.48)
Type of family
Nuclear 160 23 (14.4)
0.507 74 (46.3) 0.597
Joint 20 4 (20.0) 8 (40.0)
Total no of family members
≤4 137 23 (14.6) 0.788 63 (45.99)
0.836
>4 43 4 (16.28) 19 (44.19)
Table 5: Distribution of nutritional status across feeding practices.
Breastfeeding practices Total number Acute malnutrition Chronic malnutrition
% P value % P value
Initiation of breast feeding with 4 hours given
Yes 138 10.87
0.01 44.2 0.509
No 42 28.57 50
Pre lacteal feeds given
Yes 77 19.5
0.146
55.84
0.017
No 103 11.65 37.86
Colostrum given
Yes 79 8.9 0.846 38
0.001
No 101 19.8 51.5
Exclusive breast feeding practiced
≤6 months 171 12.87
0.001 46.78 0.149
Breastfeeding practices Total number Acute malnutrition Chronic malnutrition
% P value % P value
Initiation of complementary feeding
≤6 months 175 19.7
0.179 46.97 0.772
>6 months 5 12.28 51
Type of complementary food initiated
Liquid 22 22.73
0.03
27.27
0.107
Semisolid 157 13.38 47.77
Solid 1 0 100
Frequency of complementary feed per day
<3 44 15.91 70.45
0.001 4
136
15.96
0.791
41.5
5 13.5 29.73
6 0 20
Self-feeding
Yes 70 20
0.134 50 0.34
No 110 11.8 42.73
Traditional feeding practices
Yes 176 14.2
0.047 46.6 0.064
No 4 50 0
Feeding during illness
Yes 167 15
0.968
45.5
0.964
No 13 15.38 46.15
Table 6: Association of malnutrition across feeding practices.
Risk factors for acute malnutrition Adjusted odds ratio 95% CI P value
Lower Upper
Age( ≤12 months) 0.33 0.11 0.99 0.04
Complementary feeding Initiation (≤6 months) 13.94 1.97 98.54 0.008
Complementary feeding other than milk (>6 months) 0.16 0.03 0.71 0.010
Exclusive breast feeding (≤6 months) 0.08 0.01 0.41 0.003
Traditional feeding practices present 0.10 0.01 0.81 0.031
Risk factors for chronic malnutrition
Age (>12 months) 0.52 0.26 1.02 0.05
Frequency of feed /day (<3 times) 2.59 1.17 5.70 0.018
Pre lacteal feeding 1.9 0.99 3.64 0.052
DISCUSSION
The prevalence of acute malnutrition was 15%, chronic malnutrition was 45.6%, and both acute and chronic malnutrition was 31.6%. From various studies the prevalence of malnutrition in India was distributed with the range from 29.2% to 63%. Stalein et al study reported that in rural area the prevalence of underweight among less than one year of age was 62.4%.12 Kumar et al stated that wasting was most prevalent among 37-48 months children.13 Sex distribution of children was almost equal. In this study population even though they had male children, they prefer female children. It was strange and encouraging trend of female child preference in the community. Kavosi et al study reports stunting was significantly associated with male children and this was similar to the present study.14 There was no variations across family size by the level of acute and chronic
malnutrition in the present study which was in contrast to Kavosi et al study.14 The present study showed that low socio economic status was significantly associated with undernutrition and this was similar to Sharma et al and Meshram et al.15,16
immunoglobulin.19 About 40% of infants 0-6 months old were exclusively breastfed in this study. In many countries less than fourth of infants 6-23 months of age meet the criteria of dietary diversity and feeding frequency that are appropriate for age.18 Children need extra food other than breast milk after 6 months. If complementary food not initiated after 6 months age, nutritional deprivation can occur. Gadappal et al reported the children who received complementary feeding at 9 months of age developed more severe acute malnutrition and this finding was similar to the present study.20
Type of food initiated in the weaning process also influences the nutritional status of children. Based on, NFHS–III (2005-06), In India, only 55% of children in the age of 6-8 months received complementary foods in the form of semisolid or solid, in addition to breast milk. A new baby friendly hospital initiative by WHO and UNICEF, for successively encourage proper infant feeding practices from the birth itself.21 In new born period not even sips of water was given. Type of current feeding practices plays an important role in development of acute and chronic malnutrition. About 77.2% received regular family food in this study. Only 10.6% received separate food for babies. Feeding frequency plays major role in malnutrition. Garg et al stated that meal-frequency and breast feeding frequency were significantly associated with under nutrition and this was similar to the present study.22 Self feeding was not significant with under nutrition in this study. In Sreedhara study early self-feeding improves nutritional status in infants.23 In this study showed traditional feeding practices had significant association with chronic malnutrition. Feeding during illness like respiratory and diarrhoea illness plays an important role. During illness, the body requires extra food for their metabolism. The present study stated that majority of people restrict food during illness or they give certain form of food only, they avoid regular food. Victoria et al study reported even mild degrees of malnutrition double the risk of mortality for respiratory and diarrhoeal diease.24
In final regression model after adjusting for all other covariate, those who were initiating the complementary feeding after 6 months of age protected from acute malnutrition. In this study, who were received pre lacteal feeds had 2 times higher odds of developing chronic malnutrition. The children who were feeds by the mother >3 times per day have a protective role in the development of chronic malnutrition. Those children not received pre lacteal feeds in the new born period had protected from chronic malnutrition.
CONCLUSION
The prevalence of chronic malnutrition among 6 months to 2 years children was 45.6%, compared to state average value of 30.9%. It was higher among this study. The prevalence of acute malnutrition was 15%, both acute and chronic malnutrition was 31.6%. Feeding practices plays
major role in acute and chronic malnutrition among study population. The prevalence of chronic malnutrition was higher in more than 12 months children. Therefore corrective efforts have to be started during first year of life itself. Surprisingly 35% of children have increased weight for height, reflects a tendency to become obesity. Majority (176 mothers out of 180) follows traditional feeding practices, so that further study required to analysis the safe feeding practices. The Influence of formula feeding among mothers was very high. Feeding practices among the community should be improved to prevent malnutrition among children.
Funding: No funding sources Conflict of interest: None declared
Ethical approval: The study was approved by the Institutional Ethics Committee
REFERENCES
1. Park K. Park's textbook of preventive and social medicine. 24th ed. Jabalpur; 2017: 689-690.
2. Elizabeth K. Nutrition & child development. 5th ed. Paras Medical Publishers; 2015: 209-210.
3. Fred A, Parasuraman S, Parokiasamy P, Kothari M. Nutrition in India. National Family Health Survey (NFHS-3) India, 2005-06. Mumbai: International Institute For Population Sciences; Calverton Maryland, USA: ICF Macro. 2006.
4. Young E. Food and development. London: Routledge; 2012.
5. National family health survey (Internet).Rchiips.org.2019 (cited on 25 Jan 2019. Available from: http://rchiips.org/nfhs/nfhs3.shtml 6. Manual A. Dietary guidelines for Indians. Nat Inst
Nutrition, Second edition. Hyderabad, India. 2011: 89-117.
7. National family health survey. Rchiips.org. 2019 Available at: http://rchiips.org/nfhs/nfhs4.shtml. Accessed on 25 January 2019.
8. Social and Economic consequences of malnutrition in ACP countries. Available at: http://www. europarl.europa./intcoop/acp/2014_strasbourg2/pdf/ 1042734en.pdf. Accessed on 25 January 2019. 9. Double burden of malnutrition.World health
organization. 2018. Available at: https://www.who. int/nutrition/double-burden-malnutrition/en.
Accessed on 25 January 2019.
10. Training Course on Child Growth Assessment. Geneva: WHO; 2008. Available at: https://www. who.int/childgrowth/training/ module/en. Accessed on 25 January 2019.
11. Child Growth Standards (Internet).World health organization. 2019. Available at: https://www. who.int/childgrowth/standards/en. Accessed on 25 January 2019.
Nadu, India. IOSR J Dental Med Sci. 2013;3(6):71-4.
13. Kumar D, Goel NK, Mittal PC, Misra P. Influence of Infant-feeding Practices on Nutritional Status of Under-five Children. Indian J Pediatr. 2006;73(5):417-21.
14. Kavosi E, Hassanzadeh Rostami Z, Nasihatkon A, Moghadami M, Heidari M. Prevalence and Determinants of Under-Nutrition Among Children Under Six: A Cross-Sectional Survey in Fars Province, Iran. Int J Health Policy Manag. 2014;3(2):71-6.
15. Sharma A, Yadav, A, Baig V, Swarnkar M, Singh R, Kumar S. Malnutrition & Associated Risk Factors among Under Five Children; A Study from Rural South-Eastern Rajasthan, India. Indian J Community Health. 2015;27,3:311-9.
16. Mallikharjun M, Meshram II. Prevalence of Under Nutrition and its Predictors among Under 5 Year Children in Surat Region, Gujarat, India. J Clin Nutr Dietetics. 2016;2(1):1-12.
17. Mahgoub S, Nnyepi M, Bandeke T. Extent types of and the factors related to malnutrition among children under three years of age in Botswana. African J Food Agriculture Nutr Develop. 2006;6(1).
18. Infant and young child feeding. Who.int. 2019. Available AT: https://www.who.int/en/news-room/ fact-sheets/detail/infant-and-young-child-feeding. Accessed on 25 January 2019.
19. Infant and young child feeding programming guide .Unicef.org. 2019. Available at:
https://www.unicef.org/nutrition/files/Final_IYCF_p rogramming_guide. Accessed on 25 January 2019. 20. Swati Mohan Gadappa, Manas Kumar Behera.
Nutritional status and feeding practices in relation to IYCN policy among children under 2 years of age in tertiary care centre. Int J Contemporary Med Res. 2016;3(6):1649-51.
21. Baby-friendly Hospital Initiative. World Health Organization. 2019. Available at: https://www.who.int/nutrition/bfhi/en/. Accessed on 25 January 2019.
22. Garg A, Chandha R. Index for Measuring the Quality of Complementary Feeding Practices in Rural India. J Health, Population Nutrition. 2010;27(6).763-71.
23. Sreedhara MS, Sudarshan KP, Kruthika K. A study of association between self-feeding practices and nutritional status of infants in a rural population. Int J Pediatr Res. 2016;3(7):513-6.
24. Victoria CG, Adair L, Fall C, Hallal PC, Martorell R, Richter. Maternal and child undernutrition 2: consequences for adult health and human capital. Child: Care, Health Develop. 2008;34(3):404-4.
Cite this article as: Dhanalakshmi S, Selvaraj R.A
study on the prevalence of acute and chronic