Original Research Article
A study to assess nutritional status and related factors among children
of 6 months to 5 years in residing at field practice area of B. J. Medical
Collage, Ahmedabad
Hely B. Patel, Vaishali C. Patel*, Hetal Y. Patel, Rajan K. Parmar, Alpesh Patel
INTRODUCTION
Malnutrition remains a major public health problem throughout the developing world and is an underlying factor in over 50% of the children deaths under 5 years who die each year of preventable causes.1,2 Malnutrition and poor diets constitute the number-one driver of the global burden of disease.3 Nearly half of all deaths in children under 5 are attributable to under nutrition. This translates into the unnecessary loss of about 3 million young lives a year.4 Worldwide more than 20 million children are affected by sever acute malnutrition majority of them live in Sub-Saharan African and South East Asia region.5, 6
Global Nutrition Report-2016 by WHO indicated India still lags behind in tackling malnutrition effectively. In terms of stunting, India ranks 114th out of 132 nations (incidence: 38.7%). For wasting, India ranks 120th among 130 countries (incidence: 15.1%).7 In India 20% of children less than 5 years of age suffer from wasting due to acute under-nutrition. More than one third of the world’s children who are wasted live in India.8
54 million (48%) children under-five years in India are stunted. India accounts for 33 per cent of stunted children in the world.8
In Gujarat, 12 lakhs of children are born each year and many mothers die during this process of pregnancy and child birth.9 Infant mortality rate and under 5 mortality
ABSTRACT
Background: Under nutrition continues to be an important public health problem, inspite of several nutrition intervention programs in India. The present study was carried out to know the prevalence of underweight, stunting and wasting among 6 months to 5 years children and to assess nutrition status and related factors among study population.
Methods: A community based cross sectional study using stratified random sampling. Total 165 samples were taken from 5 field practice area of B. J. Medical College, Ahmedabad. From each area 33 random samples were taken.
Results: Out of 165 children 80 and 85 were male and female. The prevalence of underweight, stunting and wasting was 45%, 46% and 29% respectively. SE class IV and V, low birth weight, higher birth order, late age of starting complementary feeding, parents education were significantly associated with undernutrition.
Conclusions: The risk of undernutrition is higher in field practice area of B. J. Medical College, Ahmedabad. There is a need to strengthen promotion of maternal nutrition; maternal education and improving household socio-economic condition along with health care services may improve nutritional status of children.
Keywords: Nutritional status, Related factors, 6 month to 5 year children, Field practice area Department ofCommunity Medicine, B. J. Medical College, Ahmedabad, Gujarat, India
Received: 09 July 2019
Accepted: 17 August 2019
*Correspondence:
Dr. Vaishali C. Patel,
E-mail: [email protected]
Copyright: © the author(s), publisher and licensee Medip Academy. This is an open-access article distributed under the terms of the Creative Commons Attribution Non-Commercial License, which permits unrestricted non-commercial use, distribution, and reproduction in any medium, provided the original work is properly cited.
rate is 34 and 43 respectively per 1000 live birth as per NFHS-4 Report.10 In 2014, prevalence of underweight (too thin for age) in Gujarat is estimated to be at 10.4% whereas wasting (too thin for height) is estimated to be at 11.4%. Stunting (too short for age) is estimated to be at 37.2%.11
The factors influencing and precipitating malnutrition are various and are multidimensional. Those factors can lead to serious consequences like diseases, development delay, deficiency, disability and death. Malnutrition can be
measured by different methods. Anthropometric
measurements and clinical examinations are essential parts of examination the children to know their nutritional status. Integrated management of malnourished children is done through -3 tier approach.12 Assessment of malnutrition is based on objective anthropometric measurements such as weight-for-height, height-for-age, weight-for-age.13,14
METHODS
A community based cross sectional study was conducted during August 2018 to October 2018 at field practice areas of B. J. Medical College, Ahmedabad that include 6 months to 5 years children. There were total 165 participants taken from 5 field practice areas of B. J. Medical College, Ahmedabad. I selected 165 participants from field practice area purposively. From each area 33 random samples were taken. Interview was done by using pre-tested semi- structured questionnaire. Use of WHO classification for measurement of malnutrition was done. The height and weight of each child was compared with WHO growth reference data (2006) for that particular age and sex to get for-age, height-for-age and weight-for-height indices. Children below-2 SD of the reference median on any of these indices was considered as undernourished and termed as underweight, stunted and
wasted respectively. Children below-3 SD was
considered to be severely undernourished and children with weights above +2 SD according to weight-for-height criteria were considered over weight. The study included as factors affecting malnutrition was gender of children, education of parents, socio-economic class, birth weight of children, birth order of children, types of family. Parents were interviewed by house to house visit. The results were expressed in percentages represented by tables and analysis was done by Ms Excel. Informed verbal consent was taken from the parents.
RESULTS
In the present study comprising of 165 children aged 6months to 5 years, 48% were males and 52% were female’s children. With regards to age distribution it was observed that highest children were found in 49 to 60 months 35.15%. Out of total children 50.9% children belonged to the joint family, 21.21% children belonged to the extended family and only 27.8% children belonged to nuclear family.
With regards to socio-economic status, majority 57.5% of children belonged to class IV according to modified B. G. Prasad’s classification, 8.48% children belonged to class II, 23.03% children from class III and 10.9% of the children belonged to class V. There were no children in the class I.
In context to literacy status of parents, literacy rate among mothers were 82.43% and in fathers were 90.31%. Further among literate mothers, 40% had primary education, 36.96% had secondary and higher secondary education and only 5.45% had graduated.
Out of 165 children 56.3% children were found with low birth weight that was less than 2.5kg. 41.21% children had 1st birth order, 40% children had 2nd birth order, 12.72% children had 3rd birth order and 6.06% children had >3rd birth order.
Figure 1: Prevalence of malnutrition.
As shown in Figure 1, according to WHO growth chart standard, out of total 165 involved children in study, percentage of underweight (low weight-for-age) was 29.69% and percentage of sever underweight was
15.75%. So prevalence of underweight (acute
malnutrition) was 45.44%. The prevalence of stunting (low height-for-age) and sever stunting was 20% and 26.06% which reflected the problem of chronic malnutrition. Wasting (low weight-for-height) was present in 15.75% of children and proportion of sever wasting was 14%.
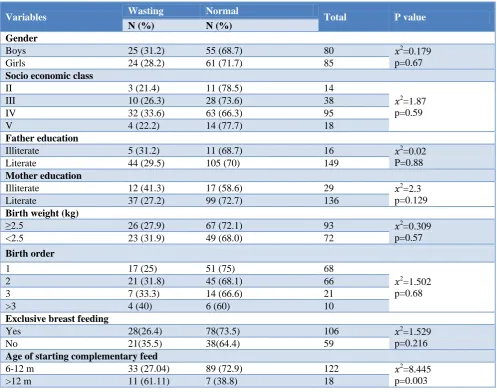
Prevalence of wasting was more among those children whose complementary feeding was started after 12 month than whose complementary feeding was started between 6-12 months. Wasting and late age of starting complementary feeding was statistically significant (Table 1).
Table 2 shows association between V socio-economic class, illiteracy of father education, low birth weight, higher birth order and stunting was statistically significant.
29.69
15.75 20
15.75 14
26.06 45
29
46
0 10 20 30 40 50
Under weight Wasting Stunting
%
Table 1: Association between wasting and related factors.
Variables Wasting Normal Total P value
N (%) N (%) Gender
Boys 25 (31.2) 55 (68.7) 80 𝑥2
=0.179 p=0.67
Girls 24 (28.2) 61 (71.7) 85
Socio economic class
II 3 (21.4) 11 (78.5) 14
𝑥2
=1.87 p=0.59
III 10 (26.3) 28 (73.6) 38
IV 32 (33.6) 63 (66.3) 95
V 4 (22.2) 14 (77.7) 18
Father education
Illiterate 5 (31.2) 11 (68.7) 16 𝑥2
=0.02 P=0.88
Literate 44 (29.5) 105 (70) 149
Mother education
Illiterate 12 (41.3) 17 (58.6) 29 𝑥2=2.3
p=0.129
Literate 37 (27.2) 99 (72.7) 136
Birth weight (kg)
≥2.5 26 (27.9) 67 (72.1) 93 𝑥2
=0.309 p=0.57
<2.5 23 (31.9) 49 (68.0) 72
Birth order
1 17 (25) 51 (75) 68
𝑥2
=1.502 p=0.68
2 21 (31.8) 45 (68.1) 66
3 7 (33.3) 14 (66.6) 21
>3 4 (40) 6 (60) 10
Exclusive breast feeding
Yes 28(26.4) 78(73.5) 106 𝑥2
=1.529 p=0.216
No 21(35.5) 38(64.4) 59
Age of starting complementary feed
6-12 m 33 (27.04) 89 (72.9) 122 𝑥2
=8.445 p=0.003
>12 m 11 (61.11) 7 (38.8) 18
Table 2: Association between stunting and related factors.
Variables Stunting Normal Total P value
N (%) N (%)
Gender
Boys 34 (42.5) 46 (57.5) 80 𝑥2
=29.98 p=4.8
Girls 71 (83.5) 14 (16.4) 85
Socio economic class
II 5 (35.7) 9 (64.28) 14 𝑥2
=12.12 p=0.006
III 9 (23.6) 29 (76.3) 38
IV 51 (53.6) 44 (46.3) 95
V 11 (61.1) 7 (38.8) 18
Father education
Illiterate 12 (75) 4 (25) 16 𝑥2
=5.973 p=0.01
Literate 64 (42.9) 85 (57.0) 149
Mother education
Illiterate 18 (62.0) 11 (37.9) 29 𝑥2
=2.973 p=0.08
Literate 60 (44.1) 75 (55.1) 136
Birth weight (kg)
≥2.5 34 (36.5) 59 (63.4) 93 𝑥2
=7.74 p=0.0053
<2.5 42 (58.3) 30 (41.6) 72
Variables Stunting Normal Total P value
N (%) N (%)
Birth order
1 21 (30.8) 47 (69.1) 68
𝑥2
=14.55 p=0.0022
2 38 (57.5) 28 (42.4) 66
3 9 (42.8) 12 (57.1) 21
>3 8 (80) 2(20) 10
Exclusive breast feeding
Yes 47 (44.3) 59 (55.6) 106 𝑥2
=0.353 p=0.552
No 29 (49.1) 30 (50.8) 59
Age of starting complementary feed
6-12 m 57 (46.7) 65 (53.2) 122 𝑥2
=1.136 p=0.286
>12 m 6 (33.3) 12 (66.6) 18
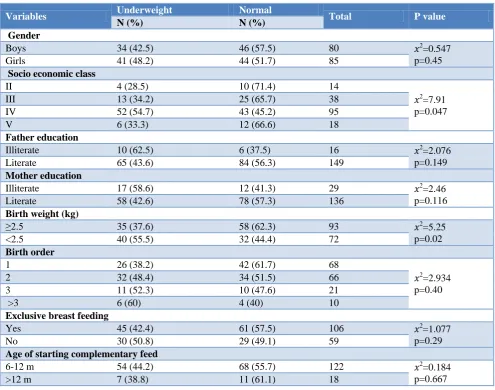
Table 3: Association between underweight and related factors.
Variables Underweight Normal Total P value
N (%) N (%)
Gender
Boys 34 (42.5) 46 (57.5) 80 𝑥2
=0.547 p=0.45
Girls 41 (48.2) 44 (51.7) 85
Socio economic class
II 4 (28.5) 10 (71.4) 14
𝑥2
=7.91 p=0.047
III 13 (34.2) 25 (65.7) 38
IV 52 (54.7) 43 (45.2) 95
V 6 (33.3) 12 (66.6) 18
Father education
Illiterate 10 (62.5) 6 (37.5) 16 𝑥2
=2.076 p=0.149
Literate 65 (43.6) 84 (56.3) 149
Mother education
Illiterate 17 (58.6) 12 (41.3) 29 𝑥2
=2.46 p=0.116
Literate 58 (42.6) 78 (57.3) 136
Birth weight (kg)
≥2.5 35 (37.6) 58 (62.3) 93 𝑥2=5.25
p=0.02
<2.5 40 (55.5) 32 (44.4) 72
Birth order
1 26 (38.2) 42 (61.7) 68
𝑥2
=2.934 p=0.40
2 32 (48.4) 34 (51.5) 66
3 11 (52.3) 10 (47.6) 21
>3 6 (60) 4 (40) 10
Exclusive breast feeding
Yes 45 (42.4) 61 (57.5) 106 𝑥2=1.077
p=0.29
No 30 (50.8) 29 (49.1) 59
Age of starting complementary feed
6-12 m 54 (44.2) 68 (55.7) 122 𝑥2
=0.184 p=0.667
>12 m 7 (38.8) 11 (61.1) 18
Prevalence of underweight was more in low birth weight children 55.5% as compared to normal birth weight children that was 37.6% same as prevalence of underweight was 54.7% in IV socio-economic class that more than in II and III socio-economic class (28.5% and 34.2%) (Table 3).
DISCUSSION
Prevalence of malnutrition was higher as compare to Gujarat in which 37.2% of children under five years of age were stunted, 11.4% were wasted and 10.4 % children were underweight.11 Another study conducted by Ratnu et al, has estimated prevalence of underweight (26.4%), stunting (49%) and wasting (10.7%) in 0-5 year children of Junagadh district of Gujarat.15 Rao et al in a study conducted for Regional Medical Research Center for tribals (ICMR study), Jabalpur, India revealed that 61.6% of preschool children were underweight, 51.6% were stunted and 32.9% were wasted.16 The study also revealed that severe degree (below-3 SD) of underweight, stunting and wasting in 27.8%, 30.3% and 6.5% children respectively.
Problem of chronic malnutrition was higher among the children in our study which might be the effect of poor education of parents, low birth weight, higher birth order and poor economic condition. Prevalence of acute malnutrition was lower than chronic malnutrition.
In our study prevalence of underweight and stunting was higher in female and prevalence of wasting was higher in male but this difference was not statistically significant. This higher prevalence of acute and chronic malnutrition in female children might be due to some negligence at level of care in terms of less attention towards diet of female children as compared with male children. Similarly in another study conducted by Sengupta et al, in urban slums of Ludhiana. Significantly more females than males were found to be underweight. More females were also found to be stunted and wasted though the gender differences here were not statistically significant.17 Meshram et al has concluded that male under-five children are more prone for underweight, stunting and wasting when compared to girl children.18 There was no statistically significant difference in prevalence of malnutrition and education status of mother in our study. Nationwide shows that maternal education has a strong inverse relationship with all three measures of nutritional status according to NFHS-3, also Meshram et al has reported increased risk of malnutrition in children of illiterate mothers.22,18 In another study carried out by Mittal et al, in urban slums of Tripura, Patiala overall 70.75% of the mothers was literate though up to different levels. Prevalence was the highest where mothers were illiterate (60.9%) vs value of 21.2% where mother had education more than high school. Similarly, figures for stunting were 65.25% where mother was illiterate and 31.3% where education level was more than high school. Differences were statistically significant for both the cases.19 That all due to better health care practices in terms of proper exclusive breast feeding, in-time complementary feeding and quality and quantity of complementary feeding among literate mothers as compared to illiterate mothers. The female literacy status was higher in our study as compared to national average of 72.9% female and state average of 70.7%.
Children of families belonging to V and IV SES were at increased risk of malnutrition when compared to children of II and III SES. The results were similar to studies done by Harishankar et al and Reddy et al in Uttar Pradesh.20,21 The association of low birth weight with malnutrition is very much significant in our study which was statistically significant. Our findings are concordant with NFHS-3 which reveals that children with a history of low birth weight.22
Similar to low birth weight, the association of higher birth order and stunting was statistically significant. According to NFHS-3 data, children of higher birth orders are much more likely to be underweight than children of lower birth orders.22
CONCLUSION
The risk of undernourishment is higher in our study population. Chronic malnutrition was more in our study. No child was found to be overweight or obese. Low socio-economic class, low birth weight, higher birth order, parent’s education and late age of starting complementary feeding were affecting malnutrition. Low birth weight was found to have adverse effect on nutritional status of children and that was statistically significant with underweight and stunting.
Recommendations
There is a need to strengthen promotion of maternal nutrition; maternal education and improving household socio-economic condition along with health care services may improve nutritional status of children. There is important to focus on malnutrition because “a weak child today will make a weak nation tomorrow”.
Funding: No funding sources Conflict of interest: None declared
Ethical approval: The study was approved by the Institutional Ethics Committee
REFERENCES
1. Black RE, Morris SS, Bryce J. Where and why are 10 million children dying every year? Lancet. 2003;361(9376):2226-34.
2. Caulfield LE, de Onis M, Blössner M, Black RE. Undernutrition as an underlying cause of child deaths associated with diarrhea, pneumonia, malaria, and measles. Amer J Clin Nutr. 2004;80(1):193-8.
3. UNICEF: Global Nutrition Report 2016: Last
assessed 10 August 2017. Available at:
https://data.unicef.org/wp-content/uploads/2016/06/ 130565-1.pdf. Accessed on 15 November 2017. 4. UNICEF. Undernutrition contributes to nearly half
.org/topic/nutrition/malnutrition/. Accessed on 15 August 2017.
5. WHO. Global database on child growth and
malnutrition. Available at: http://www.who.int/nut growthdb/estimates/en/. Accessed on 15 November 2017.
6. WHO. A joint statement by the Word Health Organization, word food programs, the united nation system standing committee on nutrition and the united nation children fund: community-based management of severe acute malnutrition. Geneva: World health organization; 2007.
7. WHO. Global nutrition report by WHO, 2016. Available at: www.globalnutritionreport.org/the-report-2016/. Accessed on 18 October 2017. 8. UNICEF. India. Introduction Stunting reflects
chronic undernutrition during the most critical periods of growth and development in early life. Available at: http://unicef.in/Whatwedo/10/Stunting. Accessed on 10 November 2017.
9. National health mission: state health society, health and family welfare department, government of Gujarat. Available at: https://nrhm.gujarat.gov.in/ bal-sakha-yojana.htm. Accessed on 18 November 2017.
10. Ministry of health and family welfare. Government of India. National family health survey- 2015-16. Available at: http://rchiips.org/NFHS/pdf/NFHS4/ GJ_FactSheet.pdf. Accessed on 15 November 2017. 11. Gujarat CSR society. Malnutrition information
pack. Available at: http://gcsra.org/writereaddata/ images/pdf/IP-Malnutrition.pdf. Accessed on 18 November 2017.
12. Government of Gujarat. Mission Balam Sukham. Available at: https://nrhm.gujarat.gov.in/mission-balam-sukham.htm. Accessed on 10 November 2017.
13. Mehta NM, Corkins MR, Lyman B, Malone A, Goday PS, Carney L, et al. American society for parenteral and enteral nutrition (ASPEN) Board of Directors. Defining pediatric malnutrition: a paradigm shift toward etiology related definitions. J Parent Enter Nutr. 2013;37(4):460-81.
14. Saeidlou NS, Babaei F, Ayremlou P. Malnutrition, overweight, and obesity among urban and rural children in north of west Azerbijan. Iran J Obesity. 2014;2014:541213
15. Ratnu AN, Verma RP, Jissa M, Kutty R, Ravindran S, Sankara P. Prevalence of under nutrition in 0-5 year children of Junagadh District, Gujarat. Sree Chitra Tirunal Institute Med Sci Tech. 2013.
16. Rao VG, Yadav R, Dolla CK, Kumar S, Bhondeley
MK, Ukey M. Undernutrition and childhood morbidities among tribal preschool children. Indian J Med Res. 2005;122(1):43.
17. Sengupta P, Philip N, Benjamin AI.
Epidemiological correlates of under-nutrition in under-5 years children in an urban slum of Ludhiana. Health and Population: Perspect Issues. 2010;33(1):1-9.
18. Meshram II, Arlappa N, Balakrishna N, Rao KM, Laxmaiah A, Brahmam GN. Trends in the prevalence of undernutrition, nutrient and food intake and predictors of undernutrition among under five year tribal children in India. Asia Pacific J Clin Nutr. 2012;21(4):568-76.
19. Mittal A, Singh J, Ahluwalia S. Effect of maternal factors on nutritional status of 1-5-year-old children in urban slum population. Ind J Commun Med. 2007;32:264-7.
20. Harishankar. Nutritional status of children under 6 years of age. Indian J Prev Soc Med. 2004;35:3-4. 21. Reddy DCS, Singh K, Tiwari IC. Epidemiology of
Nutritional deficiency disorders among tribal preschool children around Manikpur, Banda district, Uttar Pradesh. Indian J Prevent Social Med. 1984;15(1-2):57-62.
22. National Family Health Survey (NFHS-3), 2005-06. Mumbai: National Report, International Institute of Population Sciences.