Risk based Test Case Prioritization using UML State
Machine Diagram
Gufran Ahmad Ansari,
PhD
Assistant Professor,
Department of Information
Technology, College of
Computer, Qassim University,
Al-Qassim, Kingdom of Saudi
Arabia(KSA)
Wasiur Rhmann
Department of Computer
Science, Babasaheb Bhimrao
Ambedkar University (A
Central University), Lucknow,
India
Vipin Saxena
Department of Computer
Science, Babasaheb Bhimrao
Ambedkar University (A
Central University), Lucknow,
India
ABSTRACT
Time and budget constraints are two main factors which affect the quality of software products. Testing is the last activity that performed in the software development life cycle which suffers more. Test cases are designed to find the bugs in the software. Prioritization of test cases is used to execute test cases earlier which are of high probability of finding bugs. Testing with all possible test cases is not possible even for trivial software. Testing of safety critical systems require more effort to identify the critical components. In the present work, authors proposed, a novel technique of test cases prioritization from UML state diagram by taking account risk. State machine diagram is transformed into WEFSM (Weighted Extended Finite State Machine) and a case study of ATM system is used to evaluate the proposed approach. A new metric based on risk called APRC (Average Percentage of Risk Covered) is proposed and used to demonstrate the effectiveness of proposed approach.
Keywords
Software Testing, Test Cases, State Diagram, Risk Exposure, UML
1.
INTRODUCTION
Now a day’s safety critical systems are heavily used in different domain of life like health, real-time embedded and financial systems. Some functions of these critical systems are more important and error prone than other and these critical functions are needed to be tested properly to ensure the correctness of the functionality. Test cases should be designed in such a way that can expose the defects in these critical functions of the software. Software testing is a validation activity of the software product. Test cases are designed with the intention of fault detection. Test case is defined [1] as triplet [I, S, O] where I is input to the system, S is state of the system at which input is given and O is expected output. Test cases can be designed from either code of the software or design and specification documents. As software testing is usually last activity performed in the software development process and it is often performed in the pressure. Risk management process which takes earlier the preventive measures cost negligible compared to huge cost that may incurred when use of proper risk management techniques is neglected [2]. Risk based testing considers both time and risk related to the software component. It focuses on the activities of the functionality of the software which can trigger hazard condition for a software system [3]. Risk based testing is emphasized on allocation of large time in testing of critical
components of the software [4]. Unified modeling language is process-independent standard language for modeling object-oriented systems. It has become standard for designing high quality software and it is also used for security analysis along with the designing the software systems [5]. Different UML diagrams are used to model different views of the system. State machine represents the sequences of states of an object in which it goes through during its lifetime in response to events together with its responses to those events [6]. State diagram consists of states and transitions between different states. States are represented by rounded rectangle and transition between different states is represented by arrow connecting them. Objects which behave differently based on its state can be suitably model with the state diagram [7]. Prioritization of test cases schedules the execution of test cases in such a way that test cases with high probability of fault detection are executed first. Test cases prioritization can detect fault earlier. UML models are used by researchers and industry person in different domains for different purpose. In [8-9] UML models are used for effort estimation and in [10-11] risk estimation is performed. In this article, we used UML state diagram to model the software system and attached risk information associated with different states of the system. The risk information is calculated based on risk exposure. Each risk is associated with different state. After that UML state diagram is converted into weighted extended finite state machine (WEFSM) and prioritized test cases are generated using risk exposure information.
2.
RELATED WORK
diagram as specification of the system. State diagram is used to represent the dynamic aspect of the system. Authors converted the diagram into extended flow graph and from extended flow graph feasible paths are generated using genetic algorithm. Mohanty et al. [16] presented a regression test case prioritization technique for component based software using models. Authors used state chart diagram for representation of components and changes of components. State chart diagram is converted into component interaction graph (CIG). CIG and old test suite is taken as input and used information about total state changes direct and indirect access of database from test cases is used for test cases prioritization. Proposed approach minimized the cost of system testing. Samuel et al. [17] have presented an approach of automatic test cases generation from UML state diagram. Authors utilized the control and data flow information of the state diagram. State diagram is traversed and conditional nodes are selected. Functional minimization technique is used for generation of test data from the selected conditional nodes. Cluster level behavior can be tested with the generated test cases.
3.
BACKGROUND
3.1
Risk Measurement
Risk is an expectation of loss that may or may not occur for any project. Software risk is due to the possibility of suffering loss in software projects. Loss can result the poor quality product, high cost and delay in completion of projects. In risk assessment different situations of systems and risk associated with those situations is determined. For quantitative calculation of risk, probability of a risk occurrence (P) and possible loss (L) due to that risk are use.
Mathematically risk exposure is calculated by the following formula:
RE=P*L (1)
Where RE is risk exposure, P is probability of risk/ hazard occurrence and L is loss due to hazard.
Some risks are tolerable as damage caused by that risk is less compared to applying effective measure to tackle that risk. In similar way some function or component of the software may be more prone to risk. Risk with high probability of occurrence and damage cost are treated in different way in comparison to lower probability of occurrence and damage cost.
Risk assessment categorized the following processes: Identify the risks, Analyze the risk, Evaluate and prioritize the risk and Tackle the risk.
a. Identify the risks In this phase, external and internal events that can pose threat to projects are identified.
b. Analyze the risks Analyze various factors contributing to the risks.
c. Evaluate and prioritize the risks Prioritize and characterize risk in different categories.
d. Tackle the risks Identify different options to tackle the risk and implement the best one with the available resources.
3.2
UML Elements used for Risk
Information Representation
It is not possible from limited elements of UML to facilitate the sufficiently express the entire model across different domain. UML provides mechanism to extend the vocabulary of UML for creation of new model elements. These new elements are derived from exiting elements of UML and are very useful for particular domain. There are three types of extensible mechanism in UML namely: Stereotype, Tags and Constraints. In the present work Stereotype and Tag values are used for representation of risk information.
3.2.1 Stereotypes
Unified Modeling Language provides the concept of stereotypes which can be used to modify the meaning of an element in UML and assign it to new role. It helps to create new types of building blocks from existing. Different stereotypes are used to represent different category of risk.
3.2.2 Tag Values
Properties of a UML building block can be extended with the tagged value. New information in an element specification can be created by tagged value. In the presented work probability of risk occurrence and damage cost is represented in tag values for each category of risk.
3.3
Weighted Extended Finite State
Machine (WEFSM)
A WEFSM (Weighted Extended Finite State Machine) is in which nodes are used to represent states of the system and edges represent the transition between states. A WEFSM consists of the following elements:
States- States are conditions of the system
Extended States- States with associated variable or memory is extended state.
Guards-Guards are Boolean conditions attached with transitions which enable the change of states.
Events- Events are incidents which change the state of the system.
Actions- Actions are performed when an event occurs.
Transitions-Transitions from one state to other state occur due to events and may have guards.
Weights- A weight (risk exposure) is associated with each transition edge.
4.
PROPOSED METHODOLOGY
The presented approach is summarized in the following steps: 1. Draw a UML state diagram of the software system; 2. Identify the states of UML state diagram from which risk
may be associated and identify the risk;
3. Categorize the risk and compute the risk exposure for each risk;
4. Redraw the UML state diagram and attach the risk associated with each state using tags and stereotypes of the UML diagram.
Risk information is used to assign weights to the WEFSM.
6. From the weighted extended finite state machine draw weighted state transition table. Weighted State Transition Table (WSTT) contains the risk exposure information for each state.
7. Use the weighted state transition table (WSTT) for generation of test cases.
8. Sort the test cases in descending order of risk exposure.
5.
A CASE STUDY: ATM
In the present work we skipped the normal UML state diagram without the risk information and UML state diagram with risk information attached with different state is presented in Figure 1. Risk information attached with different states is represented with Stereotypes and Tags. Customer can enquiry balance and withdraw balance.
In the Table 1. risk is categorized based on Schaefer [18]. Risk types are written in descending order of severity [19]. If system is not performing balance enquires then it will be least damaging and risk will be attached with the state balance enquiry. If someone other than customer withdraws money for customer account above the withdrawal limit then it will be of highest severity and customer will be highly affected by it and such types of risk will be associated with the verifying balance state. Similarly, Normal withdrawal and Invalid ATM and Pin entry failure are categorized in Damaging and hindering type of risk.
Table 1. Representation of risk and risk type associated with the state
Risk Type Risk State
Catastrophic Invalid withdrawal Verifying balance
Damaging Normal
withdrawal
Process transaction
Hindering Invalid ATM, Pin entry failure
Request pin, verify card
Annoying Balance enquires Balance enquiry
High damaging cost is assigned to catastrophic risk and low cost is assigned for annoying risk while probability of occurrence of catastrophic risk is low and high for annoying risk types. In Table 2. different states with associated risks and their risk exposure is calculated, probability of risk occurrence is given as 2, 3, 3, 4 and cost of damage is given as 10, 7, 5, 3 for catastrophic, damaging, hindering and annoying.
Table 2. Representation of state and associated risk with state with risk exposure
State Risk types RE=P*C
Verifying balance Catastrophic 2*10=20
Process transaction Damaging 3*7=21
Request pin, verify card
Hindering 3*5=15
Balance enquiry Annoying 4*3=12
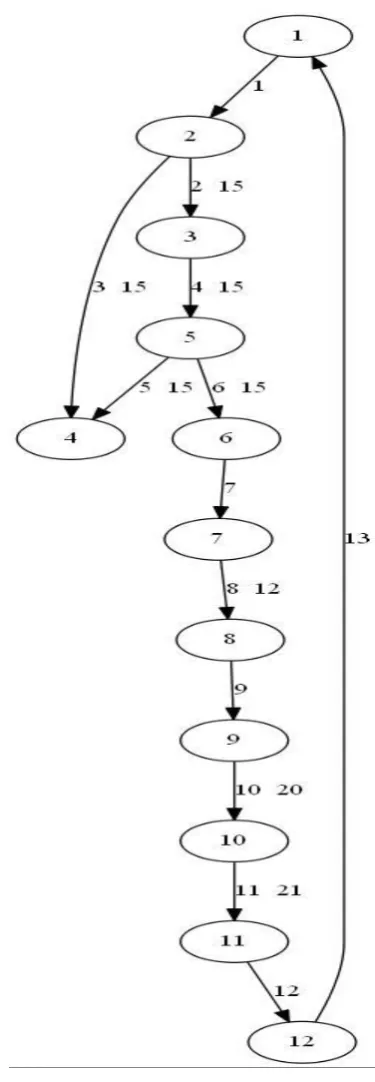
Figure 2 represents the WEFSM (Weighted Extended Finite State Machine). It is a directed graph drawn from UML State Diagram of Figure 1. For each state of the state diagram there is a node in WEFSM and edge represents the events that trigger the transfer from one state to other state. Edges of the directed graph are assigned weight based on risk exposure value of the states. There are 12 states in the state diagram in Figure. 1 these states are represented as nodes of the directed graph. States 2 and 5 contains two outgoing edges so in WEFSM there are two nodes with out-degree of 2.
Figure 2. Weighted Extended Finite State Machine (WEFSM)
Table 3. Weighted State Transition Table (WSTT)
Events 1 2 3 4 5 6 7 8 9 10 11 12 13 RE
States Next States
1 2 0
2 3 4 15
3 5 15
4 0
5 4 6 15
6 7 0
7 8 12
8 9 0
9 10 20
10 11 21
11 12 0
12 1 0
Test cases are designed from WSTT and presented in Table 4. Each test case consists of test case id, state, Event and next state and output of the next state and weight of each test case.
Table. 4 Test Cases
Test case
State Event\State Output Next
State
Weight
TC1 1 1 2 0
TC2 2 2 3 15
TC3 2 3 Please
enter valid card
4 15
TC4 3 4 Please
enter valid pin
5 15
TC5 5 5 6 15
TC6 5 6 4 15
TC7 6 7 7 0
TC8 7 8 8 0
TC9 8 9 9 12
TC10 9 10 10 20
TC11 10 11 Collect
cash and receipt
11 21
TC12 11 12 12 0
TC13 12 13 Collect
card
1 0
Prioritized order of test cases will be T11, T10, T2, T3, T4, T5, T6, T9, T1, T7, T8, T12, andT13.
A new metric called APRC (Average Percentage of Risk Covered) is proposed to demonstrate the effectiveness of the proposed approach and given below;
𝐴𝑃𝑅𝐶 = 1 −𝑇𝑅1+𝑇𝑅2+⋯𝑇𝑅𝑚
𝑛𝑚 +
1
2𝑛 (2)
Where m-> Total number of risk
n-> Number of test cases, TRi ( The position of first test that
covers the risk i)where i=1, 2,..,m
APFC (Average Percentage of Risk Covered For Prioritized Test Suite)
n=13, m=8
APFC=1 −1+2+3+4+5+6+7+88∗13 +261=0.6153 (3)
APFC (Average Percentage of Risk Covered For Non-Prioritized Test Suite)
APFC=1 −11+10+2+3+4+5+6+98∗13 +261=0.480769 (4)
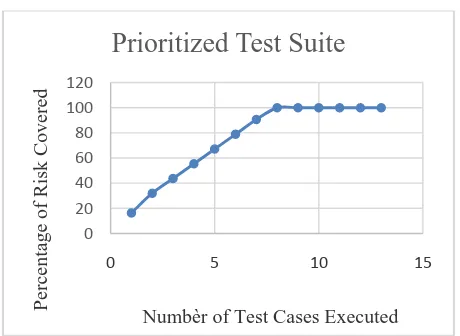
Figure 3. Number of test cases executed vs. risk covered for prioritized test suite
Figure 3. and Figure 4. represent the number of test cases executed and percentage of risk covered by executed test cases in the graphical form. In case of prioritized test suite total risk is covered by executing only 8 test cases while in case of non-prioritized test suite, total risk is covered with the execution of 11th test case. Figure 3 shows that risk is covered earlier in comparison to non-prioritized test suite which is presented in Figure 4.
Figure 4. Number of test cases executed vs. risk covered for non-prioritized test suite
6.
CONCLUSIONS
Risk analysis is inevitable for safety critical applications. If risk analysis can be done earlier in the development process then suitable risk mitigation approach can be applied to reduce the damage. UML is used by software engineer to design high quality software and risky components can easily identify by using UML. In the present work UML state machine diagram is used represent various states of the system. Various researchers used UML state diagram for test cases generation but very few work has been reported by taking into account the risk associated with the project. Risk is identified for each state and these risks are attached with those states and risk exposure values are computed for each those state. Test cases with higher risk are given higher priority. Results indicate that risk covered by test cases generated by presented approach is higher than the non-prioritized test suite. Identification of risky components earlier will boost the confidence of tester and also improve the reliability of the software. Proposed approach will be suitable for testing safety critical applications and application in which some functions
are more error and risk prone. This technique may also helpful for health related software where hazard may injure patient and sometime life may be put in danger. In future cluster level test cases from UML interaction diagram with consideration of risk may be designed and a fully automatic tool may also be design.
7.
REFERENCES
[1] Mall, R. 2009. Fundamental of Software Engineering, 3rd Edition, Prentice Hall.
[2] McManus, J. 2004. Risk Management in Software Development Projects, First Edition, Elsevier.
[3] Amland, S. 2000. Risk Based Testing: Risk Analysis Fundamentals and Metrics for Software Testing including a Financial Application Case Study, Journal of Systems and Software, Vol. 53, No. 3, pp. 287-295. [4] Wendland, M. F., Kranz, M. and Schieferdecker, I. 2012.
A Systematic Approach to Risk-Based Testing Using Risk-annotated Requirements Models, International Conference on Software Engineering Advances, pp. 636-642.
[5] Bar, T., Strohmeier, A., Moreira, A. and Mellor, S. J. 2004. The Unified Modeling Language: Modeling languages and applications, International Conference on Lisbon, Portugal, Springer.
[6] Booch, G., Raumbagh, J. and Jaobson, I. 1998. The Unified Modeling Language User Guide, Addison Wesley.
[7] Hamilton, K. and Miles, R. 2006. Learning UML 2.0, O Reilly.
[8] Zivkovic, A., Rozman, I. and Hericko, M. 2005. Automated Software Size Estimation Based on Function Points using UML Models, Information and Software Technology, Vol. 47, pp. 881–890.
[9] Hakim, A. S. H., Abran, A. and Abdallah, H. B. 2015. A Measurement Method for Sizing the Structure of UML Sequence Diagrams, Information and Software Technology, Vol. 59, pp. 222-232.
[10]Popstoiannova, K. G., Hassan, A., Guedem, A., Abdelmoez, W., Nassar, D. E. M., Ammar, H. and Milli, A. 2003. Architecture Level Risk Analysis using UML, IEEE Transaction on Software Engineering, Vol. 29, No. 10, pp. 2003.
[11]Wang, T., Hassan, A., Guedem, A., Popstojanaova, K. G. and Ammar, H. 2003. Architectural Level Risk Assessment Tool Based on UML Specification, International Conference on Software Engineering, IEEE, pp. 808-809.
[12]Hettiarachichi, C., Do, H. and Choi, B., 2016. Risk Based Test Case Prioritization Using a Fuzzy Expert System, Information and Software Technology, Vol. 69, pp. 1-15.
[13]Stallbaum, H., Metzqer, A. and Pohl, K. 2008. An Automated Technique for Risk-Based Test Case Generation and Prioritization, Proceedings of 3rd International Workshop on Automation of Software Test, pp. 67-70. 0 20 40 60 80 100 120
0 5 10 15
Percentage of Ris k Cove red
Numbèr of Test Cases Executed
Prioritized Test Suite
0 20 40 60 80 100 120
0 5 10 15
Percen
ta
ge
of
Ri
sk
Cov
ered
[14]Gebizi, C. S., Metin, D. and Sozer, H. 2015. Combining Model Based Testing and Risk Based Testing for Effective Test Case Generation, Eighth International Conference on Softwate Testing, Verification and Validation Workshop, pp. 1-4.
[15] Shirole, M., Suthar, A. and Kumar, R. 2011. Generation of Improved Test Cases from UML State Diagram using Genetic Algorithm, Proceeding of Indian Software Engineering Conference, ACM, pp. 125-134.
[16] Mohanty, S., Acharya, A. A. and Mohpatra, D. P. 2011. A Model Based Prioritization Technique for Component Based Software Retesting using UML State Chart
Diagram, International Conference on Electronics Computer Technology, pp. 364-368.
[17]Samuel, P., Mall, R. and Bothra, A. K. 2008. Automatic Test Cases Generation From Unified Modeling Language (UML) State Diagrams, IET Software, Vol. 2, No. 2, pp. 79-93.
[18]Schaefer, H., Risk Based Testing, Strategies for Prioritizing Tests against Deadlines, Software Test Consulting, http://home.c2i.net/schaefer/testing.html, 2005.