R E S E A R C H A R T I C L E
Open Access
ACSC Indicator: testing reliability for
hypertension
Robin L. Walker
1, William A. Ghali
1,2,3, Guanmin Chen
1,2, Tej K. Khalsa
3, Birinder K. Mangat
3,
Norm R. C. Campbell
1,3,4, Elijah Dixon
1,5, Doreen Rabi
1,2,3, Nathalie Jette
1,2,6, Robyn Dhanoa
7and Hude Quan
1,2*Abstract
Background:With high-quality community-based primary care, hospitalizations for ambulatory care sensitive conditions (ACSC) are considered avoidable. The purpose of this study was to test the inter-physician reliability of judgments of avoidable hospitalizations for one ACSC, uncomplicated hypertension, derived from medical chart review.
Methods:We applied the Canadian Institute for Health Information’s case definition to obtain a random sample of patients who had an ACSC hospitalization for uncomplicated hypertension in Calgary, Alberta. Medical chart review was conducted by three experienced internal medicine specialists. Implicit methods were used to judge avoidability of hospitalization using a validated 5-point scale.
Results:There was poor agreement among three physicians raters when judging the avoidability of 82 ACSC hospitalizations for uncomplicated hypertension (κ= 0.092). Theκalso remained low when assessing agreement between raters 1 and 3 (κ= 0.092), but theκwas lower (less than chance agreement) for raters 1 and 2 (κ= -0.119) and raters 2 and 3 (κ= -0.008). When the 5-point scale was dichotomized, there was fair agreement among three raters (κ= 0.217). The proportion of ACSC hospitalizations for uncomplicated hypertension that were rated as avoidable was 32.9%, 6.1% and 26.8% for raters 1, 2, and 3, respectively.
Conclusions: This study found a low proportion of ACSC hospitalization were rated as avoidable, with poor to fair agreement of judgment between physician raters. This suggests that the validity and utility of this health indicator is questionable. It points to a need to abandon the use of ACSC entirely; or alternatively to work on the development of explicit criteria for judging avoidability of hospitalization for ACSC such as hypertension.
Keywords:Ambulatory care sensitive conditions, Reliability, Quality indicator, Primary care, Avoidable hospitalizations
Background
Internationally, there is widespread interest in the pro-mise of ambulatory care sensitive conditions (ACSC). ACSC are chronic conditions that should be effectively managed in the community with appropriate medical screening, monitoring and follow-up.
Health care leaders are driven to reduce waste and in-efficiency through eliminating unnecessary hospital admissions. Reducing avoidable hospitalizations is a lea-ding healthcare reform in many provinces across Canada and internationally [1, 2]. Avoidable hospitalizations are a
common and costly occurrence and policymakers have identified them as a quick and easy way to curb healthcare costs. In Canada, initiatives reducing ACSC are often referred to as "right care in the right place at the right time” [3–6].
Hospitalization rates for ACSC have been used in many jurisdictions as a proxy for the presence or ab-sence of appropriate primary and preventive care; more physician visits within a community should result in fewer hospitalizations for ACSC [7]. A lower rate of ACSC is often interpreted as being indicative of better access to primary care, or better quality of primary care services, resulting in prevention of hospitalizations. As a healthcare system performance indicator, ACSC have been used to inform health policy by assessing the * Correspondence:[email protected]
1Department of Community Health Sciences, University of Calgary, 3280
Hospital Dr. NW, Calgary, AB T2N 4Z6, Canada
2O’Brien Institute for Public Health, University of Calgary, Calgary, Canada
Full list of author information is available at the end of the article
primary health care system (including funding models), improving our understanding of the factors that influen-ce health and by identifying gaps in health status and outcomes for specific populations [8]. In Canada, indi-viduals who experience an ACSC hospitalization repre-sent 6.0% of all hospitalized Canadians, and account for nearly 11.0% of all hospital days [9]. However, the varia-tion in ACSC rates across provinces or regions could be caused by true quality of care differences, differences in data quality or other social factors.
Initially ACSC were developed using hospitalization data to identify hospitalizations in the general United States population that could potentially have been avoided with adequate access to appropriate ambulatory or primary care in the community [8, 10]. Since their in-ception in 1993, hospitalization rates for ACSC have provided the basis for measuring adequacy of ambulatory and primary health care performance in many regions and countries [11–15]. In its national health indicators report, the Canadian Institute for Health Information (CIHI) re-ports age-standardized hospitalization rates for seven ACSC: angina, asthma, chronic obstructive pulmonary disease, diabetes, epilepsy, heart failure, and hypertension.
Administrative hospital discharge abstract database (DAD) is the only data source for producing and repor-ting national and provincial rates of ACSC in Canada. Reasons for the widespread use of ACSC are that the DAD is ready to be analyzed and has wide geographic coverage. The DAD is generated by trained medical coders and includes information about all patients ad-mitted to hospital. Each discharge record contains a unique identification number for each admission, loca-tion of residence, physician specialty, up to 25 coded diagnoses recorded using the International Classification of Disease 10th Revision, Canadian Modification(ICD-10-CA) coding system, and an indicator flagging the oc-currence of death during a hospitalization. To identify ACSC hospitalizations for each of the seven ACSC con-ditions, CIHI searches the most responsible diagnosis coding field in the DAD using specific ICD codes (e.g. ICD-10-CA codes I10.0, I10.1, I11 for uncomplicated hypertension) [16]. Exclusion criteria include those who died before discharge, individuals aged 75 years and older and admissions recorded as newborn or stillbirth.
Despite widespread use, it is unclear if ACSC is a re-liable and valid indicator that accurately measures the performance of the primary health care system. ACSC hospitalization rates can potentially be used as a marker of access to and quality of primary care, however, only if a significant proportion of them are deemed avoidable and judgments of avoidability have high inter-rater re-liability (i.e. judgments of avoidability are reproducible). Thus, the reliability of physician judgment of avoidable hospitalizations for ACSC derived from medical chart
review needs to be evaluated. If the ratings of avoidable hospitalizations cannot be reproduced reliably between physicians, the validity and utility of this health indicator are questionable. If assessments of avoidable hospitaliza-tions for ACSC derived from medical chart review are (reproducible) reliable between-physician, it will provide a methodological foundation for determining the pro-portion of ACSC hospitalizations that are truly avoidable based on medical charts. Thus, the purpose of this re-search was to test the inter-physician reliability (repro-ducibility) of judgments of avoidable hospitalizations for one ACSC, uncomplicated hypertension, derived from medical chart review. We chose hypertension as it is a highly prevalent condition affecting more than 20% of Canadians [17], the number one reason for primary care physician visits in Canada [18], and the management of hypertension and related complications is estimated to consume 10% of all health care spending [19, 20].
Methods
Data sources
We used administrative health data, specifically the DAD from the province of Alberta, Canada from fiscal years 2012/13 to 2014/15. The DAD is generated by trained coders and includes information about all pa-tients admitted to hospital primarily for monitoring Canadian national health services utilization. Each DAD record contains a unique identification number for each admission, a patient chart number, date of admission, date of discharge, location of residence, physician spe-cialty, diagnoses (up to 25 coded diagnoses are recorded using the International Disease Classification 10th Revi-sion, Canadian Modification (ICD-10-CA) coding sys-tem), procedures (up to 20), and an indicator flagging the occurrence of death during a hospitalization. The DAD also has a ‘diagnosis-type’ indicator. The coders assign a one digit ‘diagnosis-type’ code to specify the timing of diagnosis. Type M is the most responsible diagnosis, which is defined in Canada as the condition responsible for the greatest resource use during the hospital stay [21].
Identifying ACSC hospitalization for uncomplicated hypertension in the major diagnosis field
excluded patients who underwent cardiac procedure, died in hospital, or those younger than age 20 or older than age 75 at the time of hospitalization. If a patient experienced more than one ACSC hospi-talization in the study period only the first admission was selected.
Expert medical chart review
In the period of April 1, 2012 and Aug 1, 2014, a total of 238 patients with an ACSC hospitalization for un-complicated hypertension were identified in the DAD at the Foothills Medical Centre in Calgary, Alberta. A random number was assigned to each patient and the number shorted decently. We selected the first 82 patient medical charts as the sample. To reach an inter-rater agreement of 0.75 among the three inter-raters, 75 charts needed to be reviewed. To ensure stability of the kappa statistic, we selected 82 charts to be reviewed by 3 raters.
Chart review was conducted by three experienced physicians. We chose general internal medicine spe-cialists as they typically have more experience with hypertension-related hospital admissions compared to other specialties (i.e. surgeons). The three physicians routinely worked at hospitals and ambulatory care clinics, and had significant experience admitting pa-tients. All physicians underwent training, including a discussion of data extraction, the definition of compli-cations and avoidability (defined as a hospitalization that might ordinarily have been prevented [23]), and the use of implicit methods for judging avoidability [24]. We did not provide specific diseases for defining vascular complications given that the nature of physi-cian’s judgement is implicit. During training the phy-sician raters reviewed 10 charts together.
The physicians used a questionnaire for the medical chart review that included items to confirm the inclu-sion and excluinclu-sion criteria (see Additional file 2). Once the physicians had gone over all aspects of the chart (including cover page, emergency department notes, narrative summaries, admission notes, consul-tation reports, surgery/operative reports, physician daily progress notes, physician orders and discharge summaries) they used their professional judgment to implicitly judge the avoidability of the hospitalization using a validated 5-point scale [25–27] (see Table 1). Experts commonly use implicit methods for clinical judgment, which rely on the subjective opinion of the individual judge; no predetermined criteria or factors are used [24]. Implicit methods have traditionally been used to rate avoidability of hospital readmissions [28] and are also commonly used during medical panel ratings or Delphi processes [29–32].
ACSC hospitalization for uncomplicated hypertension in coding fields 2 to 25
In addition to searching the major diagnosis field for un-complicated hypertension as reason for admission as per CIHI’s methodology, we search the secondary diagnosis coding fields (2 to 25) in the DAD using ICD-10 codes I10.0x, I10.1x, I11.x between April 1, 2012 and Aug 1, 2014. We did this to assess coding misclassification of uncomplicated hypertension (i.e. non-coding of uncom-plicated hypertension in the major diagnosis code). In Canada, the most responsible diagnosis coding field is defined as the condition responsible for the greatest resource use during the hospital stay whereas in the United States it is defined as the reason for hospital ad-mission [21]. Thus, searching secondary diagnosis co-ding fields allows us to determine if patients were admitted to hospital for hypertension and had a subse-quent condition such as pneumonia that resulted in long length of stay at hospital. For those patients the pneu-monia was likely to be coded as the most responsible condition and uncomplicated hypertension is likely to be coded as secondary diagnosis.
A total of 12,917 patients with a secondary diagnosis of uncomplicated hypertension were identified in the DAD at the Foothills Medical Centre in Calgary, Alberta. A random sample of 320 medical charts were selected and reviewed by 2 trained nurses. The nurses reviewed the discharge summaries. If uncomplicated hypertension was mentioned or listed as a most responsible diagnosis, the chart was flagged. All of the flagged charts were then reviewed by the same three physicians as per the metho-dology described above.
Other study variables
The DAD was used to determine all other study va-riables: age, sex, income quintile, region, and Charlson Comorbidity. A measure of socioeconomic status and in-come quintile was assigned using the 2001 Statistics Canada Census data. Specifically, median household in-come for each Census dissemination area, the smallest Table 1Instruction and validated 5-point scale given to physician raters to judge avoidability of ACSC* hospital admission for uncomplicated hypertension, using implicit judgment
After due consideration of the clinical details of the patient’s medical chart, rate, on a 5-point scale, your confidence in the evidence for avoidability of the hospitalization:
1. Virtually no evidence of avoidability of hypertension admission
2. Slight to modest evidence of avoidability of hypertension admission
3. Evidence of avoidability of hypertension admission is a“close call” (50/50)
4. Strong evidence of avoidability of hypertension admission
5. Virtually certain evidence of avoidability of hypertension admission
geographic unit for which Census data are released, was linked to each patient’s postal code assigned using the Statistics Canada Postal Code Conversion file [33] Rural and urban status was also defined using postal code. Charlson comorbidities [34] were derived from the DAD and three categories of comorbidity were considered: (1) no comorbidity; (2) vascular risk-related comorbidity (myocardial infarction, congestive heart failure, peri-pheral vascular disease, cerebrovascular disease, diabetes with and without complications and renal disease); and (3) unrelated comorbidity (ie, unrelated to vascular risk including dementia, chronic pulmonary obstructive di-sease, connective tissue didi-sease, rheumatic didi-sease, pep-tic ulcer disease, paraplegia/hemiplegia, liver disease, cancer/metastatic carcinoma, and AIDS/HIV).
Statistical analysis
Reproducibility on the 5-point scale across raters was assessed. The reason for using the scale is that avoidable hospitalization is determined by multiple factors, inclu-ding disease severity (such as acuity of disease), family support to patients, self-management of disease, health-care system or continuity of health-care planning (from primary care to tertiary care and vice versa), geographic location, and socio-economic status [35]. There are no objective clinical criteria to determine appropriateness of admission. Then, the scale was dichotomized and assessed using the following cut point: not-avoidable points 1-3 and avoi-dable points 4-5 for easy interpretation. Fleiss’s kappa statistics for the 5-point scale and Cohen’s kappa statistic (κ) for the dichotomized variable and theirp-value were used to assess agreement among the physician raters [36]. Theκwas interpreted as follows: a near perfect agreement (0.81≤κ< 1.0), substantial agreement (0.61≤κ< 0.80), moderate agreement (0.41≤κ< 0.60), fair agreement (0.21≤κ< 0.40), slight agreement (0.01≤κ< 0.20), and less than chance agreement (κ< 0) [37]. Analyses were per-formed with SAS statistical software version 9.3 (SAS Institute Inc, Cary, North Carolina). The institutional ethics review board for the University of Calgary ap-proved the study.
Results
ACSC hospitalization for uncomplicated hypertension in the major diagnosis field
In total, 238 ACSC hospital admissions for uncompli-cated hypertension were identified in the most respon-sible diagnosis coding field at the Foothills Medical Centre in fiscal years 2012 to 2014. Among the 82 pa-tients whose medical charts were reviewed, 34.2% were younger than 50, 36.6% were aged 50 to 64 years, and 46.3% were male. Most patients resided in an urban setting (95.1%), and 45.1% had no Charlson comor-bidities (Table 2). The average length of stay for an
ACSC hospitalization for uncomplicated hypertension was 4.5 days.
Using the validated 5-point scale, there was poor agreement among the three physician raters when jud-ging the avoidability of ACSC hospitalization (κ= 0.092, Table 3). The κ remained low level when assessing agreement between raters 1 and 3 (κ= 0.092), but the κ was lower (less than chance agreement) for raters 1 and 2 (κ= -0.119) and raters 2 and 3 (κ= -0.008). When the 5-point scale was dichotomized, there was fair agreement Table 2Characteristics of patients with an ACSC* hospitalization for uncomplicated hypertension (aged 20 to 74, fiscal years 2012 to 2014)
Study Population
n %
Age (years)
20-49 28 34.2
50-64 30 36.6
65-74 24 29.2
Sex
Female 44 53.7
Male 38 46.3
Adjusted household income (quintiles)
1 (lowest) 12 14.6
2 14 17.1
3 9 11.0
4 14 17.0
5 (highest) 15 18.3
Missing 18 22.0
Region
Rural 4 4.9
Urban 78 95.1
Charlson Comorbidity
None 37 45.1
Vascular related 43 52.4
Not related 2 2.4
*ACSCambulatory care sensitive condition
Table 3Kappa agreement (and P-value) between the three raters by score 1 to 5 and score 1-3, 4-5
Score 1, 2, 3, 4, 5 1-3, 4-5
Rater 2 3 2 3
1 -0.119
(0.972)*
0.093 (0.057)
-0.009 (0.530)
0.388 (<0.001)
2 - -0.008
(0.551)
- 0.157
(0.077)
All 3 raters 0.093
(0.057)
0.217 (0.001)
among three raters (κ= 0.217) and among rater 1 and 3 (κ= 0.388). The agreement was very low for raters 2 and 3 (κ= 0.157), and raters 1 and 2 (κ= -0.009).
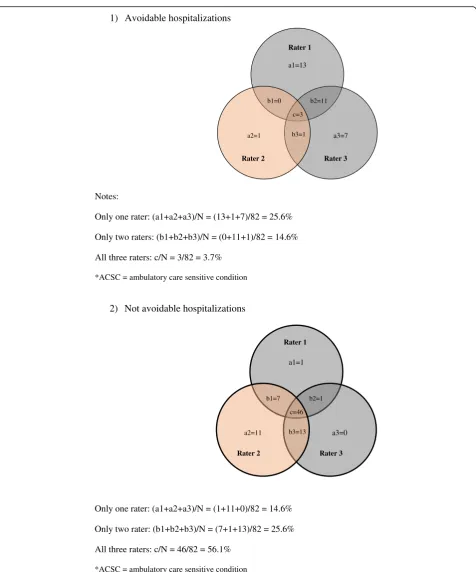
The proportion of ACSC hospitalizations for uncom-plicated hypertension that were rated as avoidable was 32.9%, 6.1% and 26.8% for raters 1, 2, and 3, respectively (Table 4). The Venn diagram (Fig. 1) describes the agree-ment between raters, showing that 3 cases (3.7%) were rated as avoidable by all 3 raters, 12 cases (14.6%) by only 2 raters, and 21 cases (25.6%) by only 1 rater. The number of cases rated as not avoidable by all 3 re-viewers, by only 2 and by only 1 rater was 46 (56.1%), 21 (25.6%) and 12 (14.6%), respectively.
ACSC hospitalization for uncomplicated hypertension in coding fields 2 to 25
There were 12,917 hospital admissions with uncompli-cated hypertension listed as a secondary diagnosis (co-ding fields 2 to 25 in the DAD) at the Foothills Medical Centre and the Peter Lougheed Centre in Calgary, Alberta
during the study period. Among the randomly chosen 320 medical charts reviewed by 2 nurses, 14 (4.4%) were flagged as admissions where uncomplicated hypertension was potentially the most responsible diagnosis. After reviewing the medical charts the three physicians agreed that 6 of the 14 (42.8%) admissions were actually ACSC hospital admissions for uncomplicated hypertension. When the 5-point scale was dichoto-mized, one physician rated one chart as an avoidable hospitalization. All other charts were rated as not avoidable by all three physician raters.
Discussion
Internationally, ACSC hospitalization rates are being used as a quality-of-care measure. Indeed ACSC admis-sions may indicate challenges with access to or signal sub-optimal primary care quality, but only if these ACSC admissions are truly avoidable. This study assessed the reliability of specialist ratings of avoidable ACSC hospi-talizations for uncomplicated hypertension derived from medical chart review. Importantly, this study found a low proportion of hospitalizations rated as avoidable, and poor to fair agreement of judgment between phy-sician raters. Given that the ratings of avoidability were low and were poorly reproduced, the study findings sug-gest that the validity (both face and construct) and utility of this health indicator is questionable. Therefore it may be unlikely that ACSC rates would significantly decrease with improved primary care management of uncompli-cated hypertension as this health indicator may be too “soft”to measure performance of the primary healthcare system.
Although our study findings question the premise of the ACSC indicator, it may only be true at the level of implicit judgment of medical charts. In implicit review, sometimes termed peer review, the reviewer judges what is being studied (i.e. avoidability of hospitalization) against his/her own clinical knowledge, opinions and be-liefs. Thus, implicit review may be biased by reviewers’ experience, consistency, attention to detail, and harsh-ness of judgment [38]. This begs the question: Can mul-tiple physician reviewers judge avoidability of ACSC hospitalizations in the same way based on their own clinical experience? Our findings clearly demonstrate that this is difficult to do, which reflects findings from other studies assessing avoidability of hospital readmis-sions and quality of care [24, 39–41].
One potential reason for the low ratings of avoidability and the poor to fair agreement of judgment between re-viewers may be due to the definition of ACSC; the con-cept of ACSC is clear (i.e. no need to be hospitalized if the patient receives appropriate out-patient care), but it is hard to operationalize in practice. Another reason is that a medical chart may be insufficient to judge Table 4Proportion of ACSC* hospital admission for uncomplicated
hypertension rated asa“avoidable”by patient characteristics (aged 20 to 74, fiscal years 2012 to 2014) and by physician raters
Rater 1 Rater 2 Rater 3
n (%) n (%) n (%)
Avoidable Hospitalization 27 (32.9) 5 (6.1) 22 (26.8)
Age (years)
20-49 14 (51.9) 2 (40.0) 12 (54.5)
50-64 5 (18.5) 1 (20.0) 6 (27.3)
65-74 8 (29.6) 2 (40.0) 4 (18.2)
Sex
Female 13 (48.2) 1 (20.0) 9 (40.9)
Male 14 (51.8) 4 (80.0) 13 (59.1)
Adjusted household income (quintiles)
1 (lowest) 3 (11.1) 0 (0.0) 1 (4.5)
2 2 (7.4) 1 (20.0) 4 (18.2)
3 4 (14.8) 0 (0.0) 4 (18.2)
4 5 (18.5) 1 (20.0) 4 (18.2)
5 (highest) 8 (29.7) 1(20.0) 5 (22.7)
Missing 5 (18.5) 2 (40.0) 4 (18.2)
Region
Rural 1 (3.7) 1 (20.0) 1 (4.6)
Urban 26 (96.3) 4 (80.0) 21 (95.4)
Charlson Comorbidity
None 14 (51.9) 2 (40.0) 9 (40.9)
Vascular related 12 (44.4) 2 (40.0) 12 (54.6)
Not related 1 (3.7) 1 (20.0) 1 (4.5)
*ACSCambulatory care sensitive condition a
avoidability, which requires comprehensive information such as primary care visits, hypertension management, diagnoses/investigations, drug adherence and patient
self-management. When this information is not docu-mented in the medical chart, judging the avoidability of a hospital admission poses a great challenge. In the
1) Avoidable hospitalizations
Notes:
Only one rater: (a1+a2+a3)/N = (13+1+7)/82 = 25.6%
Only two raters: (b1+b2+b3)/N = (0+11+1)/82 = 14.6%
All three raters: c/N = 3/82 = 3.7%
*ACSC = ambulatory care sensitive condition
a1=13 Rater 1
Rater 2 Rater 3
Rater 1
Rater 2 Rater 3 a3=7 a2=1
b1=0 b2=11
c=3
b3=1
b1=7 b2=1
c=46
b3=13
2) Not avoidable hospitalizations
Only one rater: (a1+a2+a3)/N = (1+11+0)/82 = 14.6%
Only two rater: (b1+b2+b3)/N = (7+1+13)/82 = 25.6%
All three raters: c/N = 46/82 = 56.1%
*ACSC = ambulatory care sensitive condition
a1=1
a3=0
a2=11
future, seamless health data exchange between in-patient and out-patient providers will likely provide a more comprehensive resource to assess these important fac-tors. Another potential reason is differing views of the definition of avoidability. For example, one rater could view lack of drug adherence as a patient issue and judge the hospital admission as unavoidable whereas another rater may believe it is amenable to intervention by the physician and hence judge the admission as avoidable. Lastly, there are no clear clinical guidelines for hospital admissions for patients with uncomplicated hyperten-sion, making judgments of avoidability challenging.
One way to improve agreement of judgment of avoi-dability of ACSC hospitalizations for uncomplicated hypertension would be to develop explicit criteria. Expli-cit judgments rely on predetermined criteria set by group agreement. Explicit review has a certain “ boiler-plate” character because the same standards are applied to every case [41] and the burden of accuracy falls on the criteria, not on the reviewer. Unfortunately, such cri-teria for judging avoidable hospitalization due to ACSC are not available. To increase reproducibility of ratings explicit methods to guide judgment of avoidable hospi-talizations based on medical charts (i.e. tools such as a checklist or decision tree) need to be developed.
Currently the DAD is the only data source for produ-cing and reporting on ACSC statistics. In Canada, the most responsible diagnosis coding field is defined as the condition responsible for the greatest resource use du-ring the hospital stay whereas in the United States it is defined as the reason for hospital admission [21]. Thus, we completed a medical chart review where uncompli-cated hypertension was listed in the secondary diagnosis field to determine if patients were admitted to hospital for hypertension and had a subsequent complication such as stroke or congestive heart failure. We did this because for those patients the complication was likely to be coded as the most responsible condition. Our fin-dings show that only a small proportion (1.6%) of charts were such cases. Further, it has been shown that coding hypertension in the DAD is done reasonably well. Quan et al. assessed hypertension coding accuracy using ICD-10 and reported sensitivity 68.3%, specificity 97.8%, posi-tive predicposi-tive value 93.1%, and negaposi-tive predicposi-tive value 87.7%. Overall it appears that coding misclassification does not significantly affect ACSC hospitalization rates.
Our study has limitations. First, medical chart review was conducted using only hospital medical records as linked hospital and outpatient medical records were not available. Second, we assessed only one of the seven ACSC reported by CIHI. However the ACSC that was chosen, hypertension, is a highly prevalent and high im-pact chronic condition commonly encountered within all clinical settings and is of major interest from a public
health perspective. It is unclear if the results of this study are also applicable to the other ACSC conditions. Third, we reviewed medical charts in Calgary and did not assess for potential differences between tertiary care and community hospitals. Fourth, Canada has very high treatment and control rates for hypertension relative to other countries [17, 42]. Thus, these finding may only relate to Canada. In countries with low control rates of hypertension, the proportion of hospitalizations rated as avoidable may be higher.
Conclusions
In conclusion, this study found a low proportion of ACSC hospitalizations for uncomplicated hypertension were rated as avoidable. Assessments of avoidability were not reliably reproduced between physician raters, with only poor to fair agreement. These findings either points to a need to abandon the use of the ACSC en-tirely (since the notion of avoidable hospital stays is so central to the concept of ACSC); or alternatively a need to work on the development of more explicit criteria for judging avoidability (i.e. a Q&A checklist for physician reviewers, or a decision-tree logic model to aid deci-sions). As it stands currently, the validity and reliability of this health indicator are questionable and it is poten-tially dangerous to link ACSC hospitalization rates to primary care funding models. As ACSC is a potential tool to trigger positive cases for further exploration, we recommend future research to develop explicit criteria for judging avoidability of ACSC hospitalizations.
Additional files
Additional file 1:Canadian Institute for Health Information methodology to identify ACSC hospitalizations for uncomplicated hypertension in the discharge abstract database. (DOC 33 kb)
Additional file 2:Questionnaire used by physicians when reviewing medical charts. (DOC 144 kb)
Abbreviations
ACSC:Ambulatory care sensitive conditions; CIHI: Canadian Institute for Health Information; DAD: Discharge abstract database; ICD-10-CA: International Classification of Disease 10thRevision, Canadian Modification
Acknowledgements
None to declare.
Availability of data and materials
Data will be available upon request from the corresponding author.
Authors’contributions
RW, WG, GC, ED, DR, NJ and HQ designed the study. TK, BM, NC, and RD collected the data. RW, GC and HQ analyzed the findings. RW and HQ drafted the paper. All authors critically revised the paper and approved of the final version of the manuscript.
Competing interests
Consent for publication
Not applicable.
Ethics approval and consent to participate
This study was approved by the University of Calgary’s Conjoint Health Research Ethics Board (REB15-1180).
Publisher’s Note
Springer Nature remains neutral with regard to jurisdictional claims in published maps and institutional affiliations.
Author details
1Department of Community Health Sciences, University of Calgary, 3280
Hospital Dr. NW, Calgary, AB T2N 4Z6, Canada.2O’Brien Institute for Public
Health, University of Calgary, Calgary, Canada.3Department of Medicine,
University of Calgary, Calgary, Canada.4Department of Physiology and Pharmacology, University of Calgary, Calgary, Canada.5Department of
Surgery, University of Calgary, Calgary, Canada.6Department of Clinical
Neurosciences, Hotchkiss Brain Institute, University of Calgary, Calgary, Canada.7Faculty of Nursing, University of Calgary, Calgary, Canada.
Received: 23 November 2016 Accepted: 13 June 2017
References
1. Ajmera M, Wilkins TL, Sambamoorthi U. Dual Medicare and Veteran Health Administration use and ambulatory care sensitive hospitalizations. J Gen Intern Med. 2011;26 Suppl 2:669–75.
2. Tian Y, Dixon A, Gao H. Emergency hospital admissions for ambulatory care-sensitive conditions: identifying the potential for reductions. The King's Fund. 2012;1-13.
3. Saskatoon Health Region. Complex Continuing Care Strategy 2010-2021.2010. https://www.saskatoonhealthregion.ca/locations_services/Services/Senior-Health. Accessed 12 Nov 2014.
4. Meloche J. Primary Health Care and Health System Design. Ontario Local Health Integration Network; 2012. http://www.lhins.on.ca. Accessed 3 Nov 2015.
5. Government of Saskatchewan. Ministry of Health and Health System Plan for 2015/16. 2014. http://www.finance.gov.sk.ca/PlanningAndReporting/ 2015-16/HealthPlan1516PRINT.pdf. Accessed 3 Jan 2015.
6. Alberta Government. Alberta's Primary Health Care Strategy. 2014. 2012. http://www.health.alberta.ca/documents/Primary-Health-Care-Strategy-2014. pdf. Accessed 2 Feb 2015.
7. Cloutier-Fisher D, Penning MJ, Zheng C, Druyts EB. The devil is in the details: trends in avoidable hospitalization rates by geography in British Columbia, 1990-2000. BMC Health Serv Res. 2006;6:104.
8. Brown AD, Goldacre MJ, Hicks N, Rourke JT, McMurtry RY, Brown JD, et al. Hospitalization for ambulatory care-sensitive conditions: a method for comparative access and quality studies using routinely collected statistics. Can J Public Health. 2001;92:155–9.
9. Sanmartin C, Khan S. Hospitalizations for Ambulatory Care Sensitive Conditions: The factors that matter. Ottawa: Statistics Canada; 2011. Report No.: 82-622-X.
10. Pappas G, Hadden WC, Kozak LJ, Fisher GF. Potentially avoidable hospitalizations: inequalities in rates between US socioeconomic groups. Am J Public Health. 1997;87:811–6.
11. Nyweide DJ, Weeks WB, Gottlieb DJ, Casalino LP, Fisher ES. Relationship of primary care physicians' patient caseload with measurement of quality and cost performance. JAMA. 2009;302:2444–50.
12. Rizza P, Bianco A, Pavia M, Angelillo IF. Preventable hospitalization and access to primary health care in an area of Southern Italy. BMC Health Serv Res. 2007;7:134.
13. Paramore LC, Elixhauser A. Assessment of quality of care for managed care and fee-for-service patients based on analysis of avoidable hospitalizations. Value Health. 1999;2:258–68.
14. Backus L, Moron M, Bacchetti P, Baker LC, Bindman AB. Effect of managed care on preventable hospitalization rates in California. Med Care. 2002;40:315–24.
15. Laditka SB, Laditka JN. Geographic variation in preventable hospitalization of older women and men: implications for access to primary health care. J Women Aging. 1999;11:43–56.
16. Canadian Institute for Health Information. Health Indicators 2013. Ottawa: Canadian Institute for Health Information; 2013.
17. McAlister FA, Wilkins K, Joffres M, Leenen FH, Fodor G, Gee M, et al. Changes in the rates of awareness, treatment and control of hypertension in Canada over the past two decades. CMAJ. 2011;183:1007–13.
18. Hemmelgarn BR, Chen G, Walker R, McAlister FA, Quan H, Tu K, et al. Trends in antihypertensive drug prescriptions and physician visits in Canada between 1996 and 2006. Can J Cardiol. 2008;24:507–12.
19. World Health Organization. World Health Organization 2008-2013 action plan for global strategy for the prevention and control of
noncommunicable diseases: prevent and control cardiovascular diseases, cancers, chronic respiratory diseases and diabetes. Geneva: World Health Organization; 2008.
20. Cecchini M, Sassi F, Lauer JA, Lee YY, Guajardo-Barron V, Chisholm D. Tackling of unhealthy diets, physical inactivity, and obesity: health effects and cost-effectiveness. Lancet. 2010;376:1775–84.
21. Quan H, Parsons GA, Ghali WA. Assessing accuracy of diagnosis-type indicators for flagging complications in administrative data. J Clin Epidemiol. 2004;57:366–72.
22. Canadian Institute for Health Information. Health Indicators 2011. Ottawa; Canadian Institute for Health Information; 2011.
23. Guo L, MacDowell M, Levin L, Hornung RW, Linn S. How are age and payors related to avoidable hospitalization conditions? Manag Care Q. 2001;9:33–42.
24. Brook RH, Appel FA. Quality-of-care assessment: choosing a method for peer review. N Engl J Med. 1973;288:1323–9.
25. Forster AJ, Murff HJ, Peterson JF, Gandhi TK, Bates DW. Adverse drug events occurring following hospital discharge. J Gen Intern Med. 2005;20:317–23. 26. Barbara O, Jose SM, Jayna HL, Ward F, Maeve O, Deborah W, et al. A
framework to assess patient-reported adverse outcoms stemming from hospitalization. BMC Health Serv Res. 2016;16:357.
27. Baker GR, Norton PG, Flintoft V, Blais R, Brown A, Cox J, et al. The Canadian Adverse Events Study: the incidence of adverse events among hospital patients in Canada. CMAJ. 2004;170:1678–86.
28. Yam CH, Wong EL, Chan FW, Wong FY, Leung MC, Yeoh EK. Measuring and preventing potentially avoidable hospital readmissions: a review of the literature. Hong Kong Med J. 2010;16:383–9.
29. Jette N, Quan H, Tellez-Zenteno JF, Macrodimitris S, Hader WJ, Sherman EM, et al. Development of an online tool to determine appropriateness for an epilepsy surgery evaluation. Neurology. 2012;79:1084–93.
30. Quan H, Drosler S, Sundararajan V, Wen E, Burnand B, Couris CM, et al. Adaptation of AHRQ Patient Safety Indicators for Use in ICD-10 Administrative Data by an International Consortium. Advances in Patient Safety: New Directions and Alternative Approaches. Rockville, MD: Agency for Health Care Research and Quality. 2008. http://www.ahrq.gov/qual/ advances2/. Accessed 2 May 2014.
31. Kennedy J, Quan H, Feasby TE, Ghali WA. An audit tool for assessing the appropriateness of carotid endarterectomy. BMC Health Serv Res. 2004;4:17. 32. Feasby TE, Quan H, Tubman M, Pi D, Tinmouth A, So L, et al. Appropriateness
of the use of intravenous immune globulin before and after the introduction of a utilization control program. Open Med. 2012;6:e28–34.
33. Statistics Canada. Postal code converstion file (PCCF), Reference guide. 2006. https://www.google.ca/?gws_rd=ssl#q=Statistics+Canada.+Postal+code +conversion+file+(PCCF),+Reference+guide.+2006. Accessed 29 Jan 2015. 34. Quan H, Sundararajan V, Halfon P, Fong A, Burnand B, Luthi JC, et al. Coding
algorithms for defining comorbidities in ICD-9-CM and ICD-10 administrative data. Med Care. 2005;43:1130–9.
35. Muenchberger H, Kendall E. Predictors of preventable hospitalization in chronic disease: priorities for change. J Public Health Policy. 2010;31:150–63. 36. Chen B, Zaebst D, Seel L. A macro to calculate kappa statistics for categorizations
by multiple raters. Philadelphia: Sugi, editor. 2005. SAS. 11-5-2014. 37. Landis JR, Koch GG. The measurement of observer agreement for
categorical data. Biometrics. 1977;33:159–74.
38. Weingart SN, Davis RB, Palmer RH, Cahalane M, Hamel MB, Mukamal K, et al. Discrepancies between explicit and implicit review: physician and nurse assessments of complications and quality. Health Serv Res. 2002;37:483–98. 39. Goldfield N. How important is it to identify avoidable hospital readmissions
with certainty? CMAJ. 2011;183:E368–9.
41. Ashton CM, Kuykendall DH, Johnson ML, Wray NP. An empirical assessment of the validity of explicit and implicit process-of-care criteria for quality assessment. Med Care. 1999;37:798–808.
42. Statistics Canada. Blood pressure of adults, 2012 to 2013. Health Fact Sheets. Statistics Canada Catelogue no. 82-625-X. 2014. http://www.statcan.gc.ca/ pub/82-625-x/2016001/article/14657-eng.htm. Accessed 8 Mar 2015.
• We accept pre-submission inquiries
• Our selector tool helps you to find the most relevant journal
• We provide round the clock customer support
• Convenient online submission
• Thorough peer review
• Inclusion in PubMed and all major indexing services
• Maximum visibility for your research
Submit your manuscript at www.biomedcentral.com/submit