M E T H O D O L O G Y
Open Access
Could the clinical interpretability of subgroups
detected using clustering methods be improved
by using a novel two-stage approach?
Peter Kent
1*, Mette Jensen Stochkendahl
2, Henrik Wulff Christensen
2and Alice Kongsted
1,2Abstract
Background:Recognition of homogeneous subgroups of patients can usefully improve prediction of their outcomes and the targeting of treatment. There are a number of research approaches that have been used to recognise homogeneity in such subgroups and to test their implications. One approach is to use statistical clustering techniques, such as Cluster Analysis or Latent Class Analysis, to detect latent relationships between patient characteristics.
Influential patient characteristics can come from diverse domains of health, such as pain, activity limitation, physical
impairment, social role participation, psychological factors, biomarkers and imaging. However, such‘whole person’
research may result in data-driven subgroups that are complex, difficult to interpret and challenging to recognise clinically.
This paper describes a novel approach to applying statistical clustering techniques that may improve the clinical interpretability of derived subgroups and reduce sample size requirements.
Methods:This approach involves clustering in two sequential stages. The first stage involves clustering within health domains and therefore requires creating as many clustering models as there are health domains in the available data. This first stage produces scoring patterns within each domain. The second stage involves clustering using the scoring patterns from each health domain (from the first stage) to identify subgroups across all domains. We illustrate this using chest pain data from the baseline presentation of 580 patients.
Results:The new two-stage clustering resulted in two subgroups that approximated the classic textbook descriptions of musculoskeletal chest pain and atypical angina chest pain. The traditional single-stage clustering resulted in five clusters that were also clinically recognisable but displayed less distinct differences.
Conclusions:In this paper, a new approach to using clustering techniques to identify clinically useful subgroups of patients is suggested. Research designs, statistical methods and outcome metrics suitable for performing that testing are also described. This approach has potential benefits but requires broad testing, in multiple patient samples, to determine its clinical value. The usefulness of the approach is likely to be context-specific, depending on the characteristics of the available data and the research question being asked of it.
Keywords:Stratified health care, Clustering, Latent class analysis, Subgroups, Chest pain, Low back pain
* Correspondence:[email protected] 1
Department of Sports Science and Clinical Biomechanics, University of Southern Denmark, Campusvej 55, Odense M 5230, Denmark Full list of author information is available at the end of the article
Background
There is increasing interest in stratified health care that targets treatments to individuals or homogenous sub-groups of patients. The potential benefits of stratified health care are better treatment effects and reduced harm through a more precise matching of therapy to in-dividual patients, and improved health system efficiency through more appropriate resource allocation [1]. This is especially the case in health conditions with high diag-nostic and therapeutic uncertainty, where randomised
controlled trials of a‘one size fits all’treatment approach
have yielded disappointing effect sizes [2].
It is usual for patients to vary in their outcomes, due to prognostic diversity and differences in their treatment response, even when their condition may appear to be similar at the initial consultation. Using knowledge of the predictability of that diversity, stratified health care attempts to use baseline information about likely prog-nosis and likely treatment response to assist in the tailoring of treatment decisions [1]. Under that model,
clinical decisions are based onpredictions of likely
out-comes. In contrast, there are other models of care that
use the patient’sactualresponse to treatment and initial
outcomes to tailor subsequent treatment decisions, such as stepped care and adaptive treatment [3, 4].
Stratified health care requires prognostic models with sufficient predictive accuracy to be clinically useful. Such predictive accuracy either comes from an in-depth, al-though often elusive, understanding of what determines the variability in the outcomes of individual patients or more commonly, from recognising a sufficient amount of homogeneity in subgroups of patients that can use-fully improve prediction of their outcomes [5].
There are a number of approaches that have been used to recognise homogeneity in subgroups of patients and to test its implications. The classic data-driven approach is to work backwards from an outcome in longitudinal data, such as people classified as responders or non-responders to a treatment regimen. As these techniques use the outcome to determine the derived subgroups,
statisticians refer to these approaches as ‘supervised’
techniques [6, 7]. Such supervised statistical techniques include: regression analysis, discriminant function ana-lysis, recursive partitioning anaana-lysis, and classification and regression trees. An example of a study using regression analysis to create a clinical prognostic tool is that per-formed by Schellingerhout et al. 2010 [8], who created a score chart to estimate the probability of non-recovery at 6-month follow-up in patients with non-specific neck pain. The other main approach used in data-driven
sub-grouping is called‘unsupervised’[6] [7] because instead of
working backwards from an outcome, these statistical techniques look for latent relationships between charac-teristics in cross-sectional data, usually baseline data.
The main limitation of supervised techniques is that subgroup formation is usually based on the prediction of one single outcome that may not be a comprehensive measure of the behaviour of the condition (for example, predictors of return-to-work may not be the same as predictors of recovery from pain). In contrast, unsuper-vised subgroup formation is based on baseline data only, and such subgroups are not dependent on one outcome or the efficacy of current treatments. Therefore, an advantage of this approach is that subgroups detected in this way can later be studied against a range of treat-ments and outcomes. The major disadvantage of this method is that because subgroups are not modelled using a clinical outcome, subgroups derived using un-supervised techniques may have no clinical relevance [9]. Therefore, such subgroups need to be rigorously tested for predictive validity. Two examples of studies that used unsupervised clustering techniques to derive subgroups from baseline psychological data and then investigate their predictive validity in longitudinal data are those conducted by Beneciuk et al. 2012 [10] and Westman et al. 2011 [11].
There is an increasing recognition that achievement of high predictive accuracy is likely to require prognostic models derived from patient characteristics that cover all influential domains of health [12]. For example, in mus-culoskeletal conditions, there is compelling evidence that psychological and social factors play important prognos-tic roles [13, 14]. Increasingly therefore, prognosprognos-tic re-search includes factors from such diverse domains as pain, activity limitation, physical impairment, work and social role participation, psychological factors, and bio-medical testing (biomarkers and imaging).
However, such‘whole person’prognostic research may
result in data-driven subgroups that are complex, diffi-cult to interpret and challenging to recognise clinically. It would be useful if there were methodological ap-proaches that harnessed the explanatory potential of that complexity while also facilitating clinical interpretability. An additional consideration is that modelling larger numbers of potentially predictive factors from multiple health domains requires larger patient sample sizes to
avoid ‘overfitting’. Overfitting is present when an
ana-lysis excessively fits the available data and therefore has limited generalisability outside the available sample [15]. So, it would also be useful if there were methodological approaches that harnessed the explanatory potential of many predictive variables while also minimising the need for very large patient samples.
as an exemplar statistical clustering technique and non-specific low back pain as an exemplar health condition when explaining the conceptual approach. We chose low back pain because the potential usefulness of
subgroup-ing in this condition is well recognised [17–19].
Subse-quently, we used real chest pain data to illustrate a worked example, and chose these chest pain data be-cause we had a suspicion that these data were likely to contain two latent subgroups. However, the approach may have potential application to other health condi-tions as well. The paper also suggests a framework for testing whether such subgroups are clinically important. The description of this novel approach is suggested as an option for researchers who use clustering tech-niques on complex clinical data and who have the intention of interpreting results in ways that are clinic-ally meaningful.
Methods
Traditional approach to using statistical clustering techniques (low back pain example)
The traditional approach to using statistical clustering techniques to identify subgroups of patients is to enter selected clinical characteristics into a clustering model
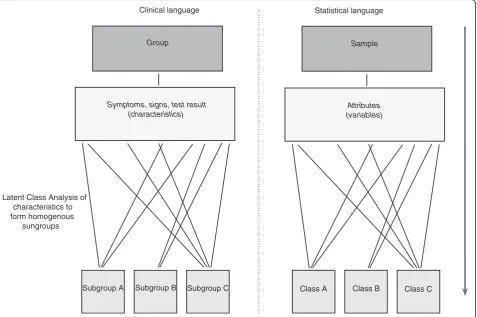
and then determine post-hoc in what ways the derived subgroups differ from each other. This general approach is illustrated in Fig. 1, which also shows how the same concept or attribute is named differently in clinical lan-guage and statistical lanlan-guage. To aid interpretability by clinically-orientated readers, this paper favours clinical language wherever possible.
For example, in a group of people with non-specific low back pain, we might select measures of various constructs such as pain (e.g. pain intensity, duration, number of previous episodes), activity limitation (diffi-culty in sit to stand, walking, lifting, rolling over in bed), physical impairments (lumbar spine movement, neurological signs), participation (sick leave, type of work), psychological factors (expectations of recovery, fear of movement, self efficacy, catastrophisation, de-pression), and social factors (income, partner support, social isolation). In this hypothetical example, the re-sults might indicate that there are three subgroups that best explain how people in the sample scored on these characteristics (these clustering techniques aim to iden-tify the subgroup structure that minimises the within-subgroup variability and maximises the between-within-subgroup variability).
Statistical language
Group Clinical language
Subgroup A Subgroup B Subgroup C
Sample
(characteristics)
Class A Class B Class C
Attributes (variables)
Latent Class Analysis of characteristics to form homogenous
sungroups
Symptoms, signs, test result
This approach is straightforward but as the number of clinical characteristics increases, interpretation and nam-ing of the subgroup patterns of scornam-ing can become more challenging. This is because with increasing com-plexity, the patterns may no longer be clinically recog-nisable. Moreover, the statistically optimal number of subgroups may become so high that it does not make practical sense.
Novel approach of using statistical clustering techniques (low back pain example)
The novel approach we suggest seeks to improve clinical interpretability and reduce sample size requirements by performing statistical clustering in two sequential stages. The first stage involves clustering using only clinical
characteristics from within each health domain and
therefore requires creating as many clustering models as there are health domains in the available data. This first stage produces scoring patterns within each domain. The second stage involves clustering using the scoring patterns from each health domain to identify subgroups across all the domains. Therefore, the scoring patterns identified in the first stage are treated as manifest cat-egorical variables in the second stage. This principle is illustrated in Fig. 2.
First stage clustering
Initially, the researcher needs to classify each available clinical characteristic as belonging exclusively to one health domain. The International Classification of Func-tioning, Disability and Health from the World Health Organisation is an example of a classification tool that can guide this process [20]. Some clinical characteristics may be ambiguous to classify and in such cases, classifi-cation decisions will necessarily be arbitrary.
Next, clustering is performed using only clinical char-acteristics from within each health domain. So extending our example, Latent Class Analysis could be initially per-formed using only the pain characteristics (pain inten-sity, duration and number of previous episodes). The results of the Latent Class Analysis would identify how many discrete patterns of scoring on the pain character-istics best explained the variance in the whole sample.
For example, one scoring pattern might be labelled‘high
pain intensity/short duration’if it mainly varied from the
other patterns on these two pain characteristics. This process of Latent Class Analysis, interpretation and la-belling of results would then be repeated for each health domain.
Then, new categorical variables would be formed, one for each domain, with the categories (values) in each variable corresponding to the number of scoring pat-terns in that domain. For example, a new pain variable might be formed containing three categories that are
labelled ‘high pain intensity/short duration’,‘high pain
intensity/constant pain’, and ‘low pain intensity/long
duration’.
One benefit of this first stage is potentially enhanced clinical interpretability of the results because the label-ling only describes clinical characteristics from within one health domain and therefore each scoring pattern may be more recognisable. A second likely benefit is reduced sample size requirements because clustering within domains can be a powerful data-reduction tech-nique. In our simple example, this first stage would have reduced the number of clinical characteristics (variables) being modelled from 16 (pain intensity, pain duration, pain behaviour, activity limitation, lumbar spine move-ment, neurological signs, sick leave, type of work, num-ber of previous episodes, expectations of recovery, fear of movement, self efficacy, catastrophisation, depression, partner support and social isolation) to six (the domains of pain, activity limitation, participation, physical impair-ment, psychology, and social factors). That is because only the number of variables within each domain would be clustered during the first stage and only the number of variables that equals the number of domains would be clustered in the second stage. This data reduction would potentially be even greater in circumstances where some of the constructs are multi-dimensional and where greater numbers of clinical characteristics are being modelled.
Second stage clustering
The second stage involves clustering, using the categorical variables derived from the first stage, to identify subgroups across all the domains. So, in our example, we would perform a second Latent Class Analysis modelling the six variables that each repre-sents the scoring patterns within one health domain. It is likely that, relative to the traditional method for per-forming statistical clustering, the clinical interpretabil-ity of the results would be enhanced because the subgroups would be formed from fewer variables that already contain values (scoring patterns) that have clinically interpretable labels.
In summary, the potential advantages of this novel approach are enhanced clinical interpretability of data-derived subgroups and reduced sample size require-ments. Potential disadvantages of this method are: (i) that it is more time-consuming to build separate clus-tering models for each included health domain and perform statistical clustering in two stages, (ii) the first stage clustering may hide potentially important inter-actions between factors from different domains.
Assessing clinical importance
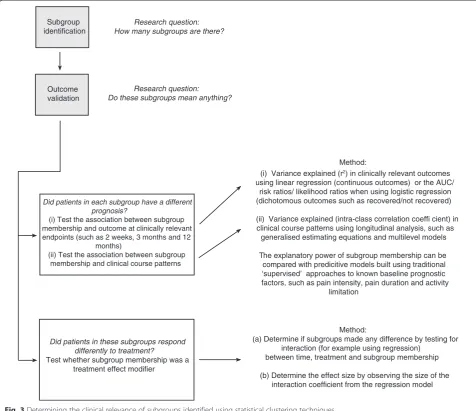
To determine if these subgroups are clinically important due to their having prognostic or treatment effect implica-tions, they would need to be tested for their association with clinical outcomes and some methods for doing so are shown in Fig. 3. Those methods are divided into three lines of inquiry: (i) did patients in each subgroup have different prognoses?, (ii) did patients in these sub-groups respond differently to treatment?, and (iii) how Group
(sample)
Clinical language
Domains of health
Pain Activity limitation
Physical impairment
Psycho-logical etc ...
Subgroup A Subgroup B Subgroup C
Stage 2: Latent Class Analysis
subgroups
Stage 1: Latent Class Analysis of variables within each domain of
health to recognise patterns of scoring within each domain
There are many variables at this level, and they are manually classified into mutually exclusive domains of health
Consolidation of scoring patterns in each domain into a single categorical variable There are only as many variables at this level, as there are health domains, and the categories (values) in each variable
correspond to the number of scoring patterns in that domain
Pain pattern 1 Pain pattern 2
Activity Lim. pattern 1 Activity Lim. pattern 2 Activity Lim. pattern 3 Physical imp. pattern 1 Physical imp. pattern 2 Physical imp. pattern 3 Physical imp. pattern 4 Psychological pattern 1 Psychological pattern 2
etc ...
(patterns)
Letters
Words
Sentences Latent
story
Statistical approach Language
analogy
Clinical characteristics (symptoms, signs, test results)
Pain
Pattern 1 Pattern 2
Activity limitation
Pattern 1 Pattern 2 Pattern 3
Physical impairment
Pattern 1 Pattern 2 Pattern 3 Pattern 4
Psycho-logical
Pattern 1 Pattern 2
etc ...
(variables)
Explained story
(variables)
(classes)
across health domains to form
did the performance of this subgroup classification compare with other classification methods? This novel approach for applying statistical clustering techniques to identify clinically useful subgroups has potential ben-efits, but for any particular patient sample, the added value compared to the traditional approach needs to be evaluated. This can be tested by analysing the data using both approaches and comparing the interpretability of their results and the strength of their predictive cap-acity. For instance, either the traditional approach or the novel approach may explain more variance in clinic-ally relevant outcomes and allow greater predictive accuracy when estimating the prognosis or treatment response of individual patients. So, all of the statistical approaches described in Fig. 3 can be used to also test whether one method for applying statistical clustering
techniques is more useful in a given dataset. In the case of the chest pain data used as an example in the current study, we do not report whether the subgroups had prognostic or treatment effect implications, because the outcomes in the two data sources differed.
If statistically-derived subgroups show predictive valid-ity at a clinically useful level, it can be helpful to then construct a clinical prediction rule that will allow clini-cians to easily identify the subgroup membership of indi-vidual patients. This process requires identification of the most suitable set of clinical characteristics and creation of a scoring algorithm capable of allocating patients to the correct subgroup, while balancing operational simplicity with classification accuracy. There are a number of methods for doing this. Three examples of these methods are (i) the use of receiver operating characteristic (ROC) Outcome
validation Subgroup identification
Research question: How many subgroups are there?
Research question: Do these subgroups mean anything?
Did patients in each subgroup have a different prognosis?
(i) Test the association between subgroup membership and outcome at clinically relevant endpoints (such as 2 weeks, 3 months and 12
months)
(ii) Test the association between subgroup membership and clinical course patterns
(i) Variance explained (r2) in clinically relevant outcomes
using linear regression (continuous outcomes) or the AUC/ risk ratios/ likelihood ratios when using logistic regression (dichotomous outcomes such as recovered/not recovered)
(ii) Variance explained (intra-class correlation coeffi cient) in clinical course patterns using longitudinal analysis, such as
generalised estimating equations and multilevel models
The explanatory power of subgroup membership can be compared with predicitive models built using traditional ‘supervised’ approaches to known baseline prognostic factors, such as pain intensity, pain duration and activity
limitation
Did patients in these subgroups respond differently to treatment?
Test whether subgroup membership was a treatment effect modifier
Method: Method:
(a) Determine if subgroups made any difference by testing for interaction (for example using regression)
between time, treatment and subgroup membership
(b) Determine the effect size by observing the size of the interaction coefficient from the regression model
curve analysis and contingency tables [9], (ii) the use of logistic regression and scoring tables [8], and (iii) the use of more automated techniques such as Classification and Regression Tree Analysis [21].
Lastly, the type of clustering approaches described in this paper are hypothesis-setting, even when predictive accuracy has been demonstrated in an initial patient sample. There are subsequent stages of research needed to externally validate new subgrouping tools and adequately test their capacity to improve clinical effects and/or increase health system efficiency [9, 22].
Results
Example of this method applied (non-specific chest pain example)
Identical baseline variables from two clinical trials of non-specific chest pain in Denmark were combined to create test data on which to apply this method of analysis. The researchers working with these data had a suspicion that there may be two latent subgroups, one subgroup representing predominantly cardiogenic chest pain, and the other representing predominantly muscu-loskeletal chest pain.
One clinical trial was of two treatments for acute musculoskeletal chest pain undertaken in an emergency cardiology department and four chiropractic clinics, and the data from evaluating 305 prospective participants was included in the current study. Full details of the study design and recruitment procedures have been pub-lished previously [23, 24]. The other clinical trial was of manual therapy for chest pain in people diagnosed with or without cervico-thoracic angina, and the data from evaluating 275 prospective participants was included in
the current study. Full details of that study’s design and
recruitment procedures have also been published previ-ously [25, 26]. Permission was obtained from the custo-dians (MJS and HWC) of each of these datasets for secondary use of the data within this project. Under Danish law, the secondary analysis of such de-identified data does not require separate ethics approval (The Act on Processing of Personal Data, December 2012, Section 5.2; Act on Research Ethics Review of Health Research Projects, October 2013, Section 14.2).
For both the single-stage and two-stage clustering, 69 variables were selected that traversed the health domains of demographics, previous history, psychological percep-tion and coping, pain, activity limitapercep-tion, diagnostic clas-sification and musculoskeletal palpation findings, so as to illustrate data-derived subgroups that were identified using information across health domains. The number of variables differed across domains and also contained a variety of metrics. A detailed description of all variables is shown in Table 1. All variables contained 1 % or less missing data, except for the CCS angina classification
variable (1.6 %), SF36 physical function sum score (3.5 %) and average chest pain episode duration (21.9 %). However, no data were imputed, as Latent Class Analysis copes with missing data.
Latent Class Analysis was performed using Latent
Gold (version 4.5, Statistical Innovations, Belmont MA,
USA), and as use of a random seed start-point in the
data can produce some slight variability in results, all analyses were performed five times. The appropriate number of clusters (subgroups) was chosen from the model with the lowest and most consistent Bayesian Information Criterion (BIC) across the five repetitions.
All subgroups and scoring patterns were independ-ently named by two researchers (MJS and HWC) with content expertise and then a consensus was reached by discussion. The two experts had conducted the clinical trials and were very familiar with both the variables and the clinical context in which the trials occurred.
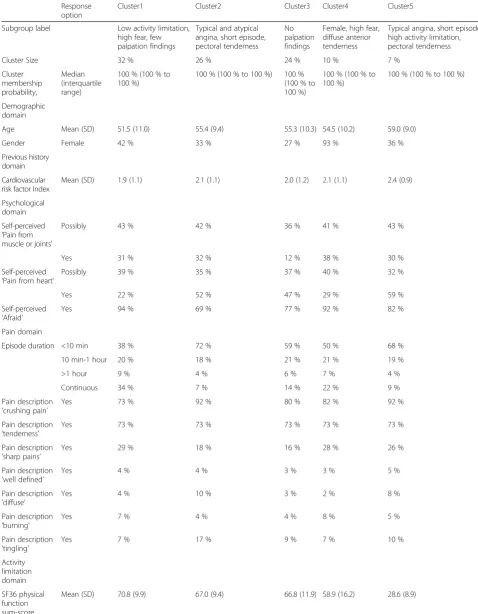
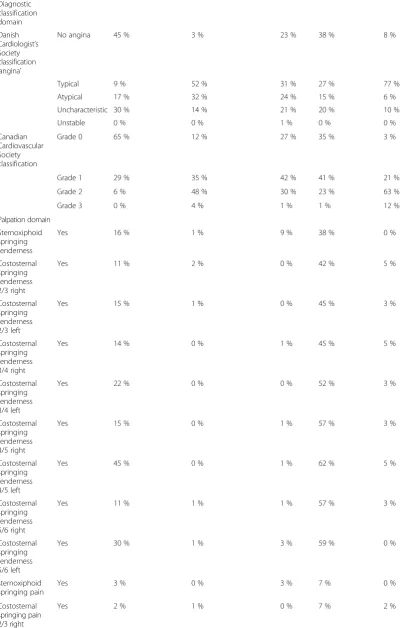
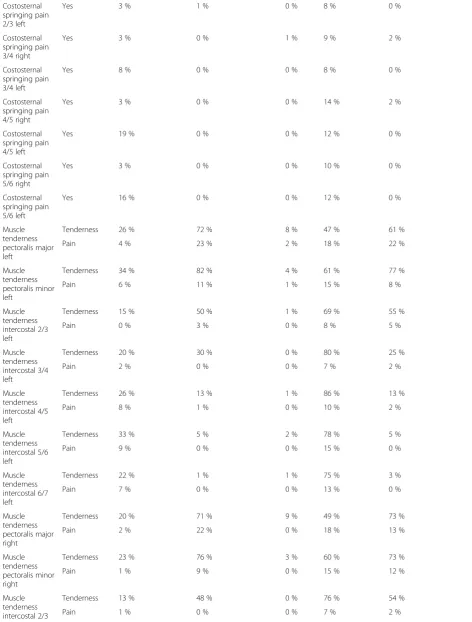
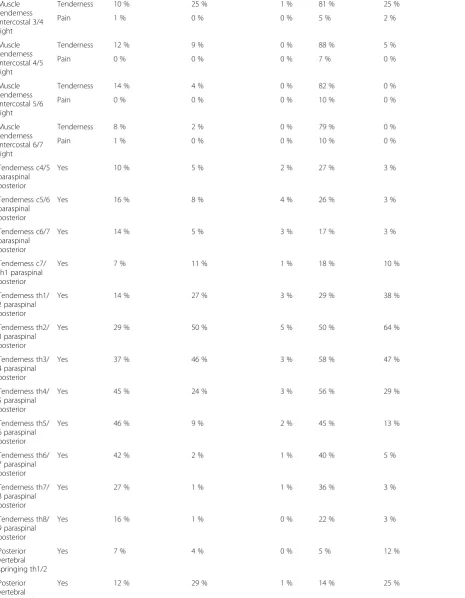
The results from the single-stage clustering are shown
in Table 2. Five subgroups were identified which were
subsequently named: (i)Low activity limitation, high fear
and few palpation findings (32 % of sample), (ii)Typical and atypical angina, short episode, with pectoral tender-ness (26 %), (iii) no palpation findings (24 %), (iv) Fe-male, high fear, diffuse anterior tenderness (10 %), and (v)Typical angina, short episode, high activity limitation, with pectoral tenderness (7 %).
The results from the first stage of the two-stage
clus-teringare shown in Table 3, including the names of the two to six scoring patterns that were identified within each health domain. The results from the second stage are shown in Tables 4 and 5, which identified two
sub-groups which were subsequently named: (i)Uncertain of
cause and fearful, but not heart-related - with local thor-acic 5/6 palpation findings (51 % of sample), and (ii) Believes pain to be heart- or musculoskeletal-related with crushing pain, local thoracic 2/3 signs, and pectoral tenderness (49 %). In Table 4, these two subgroups are described using the proportions of individuals in each of the first stage subgroups. In Table 5, these two sub-groups are described in the measurement units of the original variables.
A cross-tabulation of the cluster membership between the five subgroups from single-stage clustering and the two subgroups from two-stage clustering is shown in Table 6. One of the subgroups from the single-stage clustering was split across the two subgroups from two-stage clustering, but the rest of the single-stage subgroups were largely represented in only one of the two-stage subgroups.
Discussion
We have introduced a novel approach to using statistical
Table 1Description of variables
Response options Missing-ness
Demographics domain
Age Years of age 0 %
Gender Female/male 0 %
Previous history domain
Risk factors for cardiovascular disease sum score of hypercholesterolemia, hypertension, diabetes, family history of cardiac disease, previous or current smoking (all scored yes/no)
0 to 5 0 %
Psychological domain (patient perception and coping)
Does the pain originate from the heart? Yes/possibly/no 0.4 %
Does the pain originate from the muscles and joints? Yes/possibly/no 0.2 %
Are you afraid? Yes/no 0.2 %
Pain domain
Average chest pain episode duration <10 min/10 min-1 hour/> 1 hour/continuous 21.9 %
Pain description‘crushing pain’ Yes/no 0 %
Pain description‘tenderness’ Yes/no 0 %
Pain description‘sharp pains’ Yes/no 0 %
Pain description‘well defined’ Yes/no 0 %
Pain description‘diffuse’ Yes/no 0 %
Pain description‘burning’ Yes/no 0 %
Pain description‘tingling’ Yes/no 0 %
Activity limitation domain
SF36 physical function sum score 0 to 100 scale (high scores better) 3.5 %
Diagnostic classification domain
Danish Cardiologist’s Society classification‘angina’ No angina/typical/atypical/ uncharacteristic/ unstable
0.2 %
Canadian Cardiovascular Society classification Grades 0 to 3 1.6 %
Palpation domain
Anterior
Springing - tenderness sterno/xiphoid junction Yes/no <1 %
Springing - tenderness costosternal 2–3 right Yes/no <1 %
Springing - tenderness costosternal 2–3 left Yes/no <1 %
Springing - tenderness costosternal 3–4 right Yes/no <1 %
Springing - tenderness costosternal 3–4 left Yes/no <1 %
Springing - tenderness costosternal 4–5 right Yes/no <1 %
Springing - tenderness costosternal 4–5 left Yes/no <1 %
Springing - tenderness costosternal 5–6 right Yes/no <1 %
Springing - tenderness costosternal 5–6 left Yes/no <1 %
Springing - provoked pain sterno/xiphoid junction Yes/no <1 %
Springing - provoked pain costosternal 2–3 right Yes/no <1 %
Springing - provoked pain costosternal 2–3 left Yes/no <1 %
Springing - provoked pain costosternal 3–4 right Yes/no <1 %
Springing - provoked pain costosternal 3–4 left Yes/no <1 %
Springing - provoked pain costosternal 4–5 right Yes/no <1 %
subgroups of patients. It has been described using the hypothetical example of low back pain and then illus-trated using an applied example of chest pain data. From those cross-sectional chest pain data, we reported the baseline subgroups detected using the traditional ap-proach and the baseline subgroups detected using the novel approach.
We anticipated that two-stage clustering might result in more clinically interpretable subgrouping than trad-itional one-stage clustering, due to its giving equal potential weight to variables from each domain. In this chest pain sample, the two approaches resulted in two and five subgroups respectively, both of which appeared clinically interpretable and reasonably recognisable. The
Table 1Description of variables(Continued)
Springing - provoked pain costosternal 5–6 right Yes/no <1 %
Springing - provoked pain costosternal 5–6 left Yes/no <1 %
Muscle tenderness/pain pectoralis maj. left No tenderness/tenderness/pain <1 %
Muscle tenderness/pain pectoralis min. left No tenderness/tenderness/pain <1 %
Muscle tenderness/pain intercostalis 2–3 left No tenderness/tenderness/pain <1 %
Muscle tenderness/pain intercostalis 3–4 left No tenderness/tenderness/pain <1 %
Muscle tenderness/pain intercostalis 4–5 left No tenderness/tenderness/pain <1 %
Muscle tenderness/pain intercostalis 5–6 left No tenderness/tenderness/pain <1 %
Muscle tenderness/pain intercostalis 6–7 left No tenderness/tenderness/pain <1 %
Muscle tenderness/pain pectoralis maj. right No tenderness/tenderness/pain <1 %
Muscle tenderness/pain pectoralis min. right No tenderness/tenderness/pain <1 %
Muscle tenderness/pain intercostalis 2–3 right No tenderness/tenderness/pain <1 %
Muscle tenderness/pain intercostalis 3–4 right No tenderness/tenderness/pain <1 %
Muscle tenderness/pain intercostalis 4–5 right No tenderness/tenderness/pain <1 %
Muscle tenderness/pain intercostalis 5–6 right No tenderness/tenderness/pain <1 %
Muscle tenderness/pain intercostalis 6–7 right No tenderness/tenderness/pain <1 %
Posterior
Tender c4-5 paraspinalpost either left or right Yes/no 1 %
Tender c5-6 paraspinalpost either left or right Yes/no 1 %
Tender c6-7 paraspinalpost either left or right Yes/no 1 %
Tender c7-th1 paraspinalpost left or right Yes/no 1 %
Tender th1-2 paraspinalpost left or right Yes/no 1 %
Tender th2-3 paraspinalpost left or right Yes/no 1 %
Tender th3-4 paraspinalpost left or right Yes/no 1 %
Tender th4-5 paraspinalpost left or right Yes/no 1 %
Tender th5-6 paraspinalpost left or right Yes/no 1 %
Tender th6-7 paraspinalpost left or right Yes/no 1 %
Tender th7-8 paraspinalpost left or right Yes/no 1 %
Tender th8-9 paraspinalpost left or right Yes/no 1 %
Vertebral springing th1-2 Yes/no 1 %
Vertebral springing th2-3 Yes/no 1 %
Vertebral springing th3-4 Yes/no 1 %
Vertebral springing th4-5 Yes/no 1 %
Vertebral springing th5-6 Yes/no 1 %
Vertebral springing th6-7 Yes/no 1 %
Vertebral springing th7-8 Yes/no 1 %
Table 2Results of the single-stage clustering of chest pain data
Response option
Cluster1 Cluster2 Cluster3 Cluster4 Cluster5
Subgroup label Low activity limitation, high fear, few palpation findings
Typical and atypical angina, short episode, pectoral tenderness
No palpation findings
Female, high fear, diffuse anterior tenderness
Typical angina, short episode, high activity limitation, pectoral tenderness
Cluster Size 32 % 26 % 24 % 10 % 7 %
Cluster membership probability,
Median (interquartile range)
100 % (100 % to 100 %)
100 % (100 % to 100 %) 100 % (100 % to 100 %)
100 % (100 % to 100 %)
100 % (100 % to 100 %)
Demographic domain
Age Mean (SD) 51.5 (11.0) 55.4 (9.4) 55.3 (10.3) 54.5 (10.2) 59.0 (9.0)
Gender Female 42 % 33 % 27 % 93 % 36 %
Previous history domain
Cardiovascular risk factor Index
Mean (SD) 1.9 (1.1) 2.1 (1.1) 2.0 (1.2) 2.1 (1.1) 2.4 (0.9)
Psychological domain
Self-perceived ‘Pain from muscle or joints’
Possibly 43 % 42 % 36 % 41 % 43 %
Yes 31 % 32 % 12 % 38 % 30 %
Self-perceived ‘Pain from heart’
Possibly 39 % 35 % 37 % 40 % 32 %
Yes 22 % 52 % 47 % 29 % 59 %
Self-perceived ‘Afraid’
Yes 94 % 69 % 77 % 92 % 82 %
Pain domain
Episode duration <10 min 38 % 72 % 59 % 50 % 68 %
10 min-1 hour 20 % 18 % 21 % 21 % 19 %
>1 hour 9 % 4 % 6 % 7 % 4 %
Continuous 34 % 7 % 14 % 22 % 9 %
Pain description ‘crushing pain’
Yes 73 % 92 % 80 % 82 % 92 %
Pain description ‘tenderness’
Yes 73 % 73 % 73 % 73 % 73 %
Pain description ‘sharp pains’
Yes 29 % 18 % 16 % 28 % 26 %
Pain description ‘well defined’
Yes 4 % 4 % 3 % 3 % 5 %
Pain description ‘diffuse’
Yes 4 % 10 % 3 % 2 % 8 %
Pain description ‘burning’
Yes 7 % 4 % 4 % 8 % 5 %
Pain description ‘tingling’
Yes 7 % 17 % 9 % 7 % 10 %
Activity limitation domain
SF36 physical function sum-score
Table 2Results of the single-stage clustering of chest pain data(Continued)
Diagnostic classification domain
Danish Cardiologist’s Society classification ‘angina’
No angina 45 % 3 % 23 % 38 % 8 %
Typical 9 % 52 % 31 % 27 % 77 %
Atypical 17 % 32 % 24 % 15 % 6 %
Uncharacteristic 30 % 14 % 21 % 20 % 10 %
Unstable 0 % 0 % 1 % 0 % 0 %
Canadian Cardiovascular Society classification
Grade 0 65 % 12 % 27 % 35 % 3 %
Grade 1 29 % 35 % 42 % 41 % 21 %
Grade 2 6 % 48 % 30 % 23 % 63 %
Grade 3 0 % 4 % 1 % 1 % 12 %
Palpation domain
Sternoxiphoid springing tenderness
Yes 16 % 1 % 9 % 38 % 0 %
Costosternal springing tenderness 2/3 right
Yes 11 % 2 % 0 % 42 % 5 %
Costosternal springing tenderness 2/3 left
Yes 15 % 1 % 0 % 45 % 3 %
Costosternal springing tenderness 3/4 right
Yes 14 % 0 % 1 % 45 % 5 %
Costosternal springing tenderness 3/4 left
Yes 22 % 0 % 0 % 52 % 3 %
Costosternal springing tenderness 4/5 right
Yes 15 % 0 % 1 % 57 % 3 %
Costosternal springing tenderness 4/5 left
Yes 45 % 0 % 1 % 62 % 5 %
Costosternal springing tenderness 5/6 right
Yes 11 % 1 % 1 % 57 % 3 %
Costosternal springing tenderness 5/6 left
Yes 30 % 1 % 3 % 59 % 0 %
sternoxiphoid springing pain
Yes 3 % 0 % 3 % 7 % 0 %
Costosternal springing pain 2/3 right
Table 2Results of the single-stage clustering of chest pain data(Continued)
Costosternal springing pain 2/3 left
Yes 3 % 1 % 0 % 8 % 0 %
Costosternal springing pain 3/4 right
Yes 3 % 0 % 1 % 9 % 2 %
Costosternal springing pain 3/4 left
Yes 8 % 0 % 0 % 8 % 0 %
Costosternal springing pain 4/5 right
Yes 3 % 0 % 0 % 14 % 2 %
Costosternal springing pain 4/5 left
Yes 19 % 0 % 0 % 12 % 0 %
Costosternal springing pain 5/6 right
Yes 3 % 0 % 0 % 10 % 0 %
Costosternal springing pain 5/6 left
Yes 16 % 0 % 0 % 12 % 0 %
Muscle tenderness pectoralis major left
Tenderness 26 % 72 % 8 % 47 % 61 %
Pain 4 % 23 % 2 % 18 % 22 %
Muscle tenderness pectoralis minor left
Tenderness 34 % 82 % 4 % 61 % 77 %
Pain 6 % 11 % 1 % 15 % 8 %
Muscle tenderness intercostal 2/3 left
Tenderness 15 % 50 % 1 % 69 % 55 %
Pain 0 % 3 % 0 % 8 % 5 %
Muscle tenderness intercostal 3/4 left
Tenderness 20 % 30 % 0 % 80 % 25 %
Pain 2 % 0 % 0 % 7 % 2 %
Muscle tenderness intercostal 4/5 left
Tenderness 26 % 13 % 1 % 86 % 13 %
Pain 8 % 1 % 0 % 10 % 2 %
Muscle tenderness intercostal 5/6 left
Tenderness 33 % 5 % 2 % 78 % 5 %
Pain 9 % 0 % 0 % 15 % 0 %
Muscle tenderness intercostal 6/7 left
Tenderness 22 % 1 % 1 % 75 % 3 %
Pain 7 % 0 % 0 % 13 % 0 %
Muscle tenderness pectoralis major right
Tenderness 20 % 71 % 9 % 49 % 73 %
Pain 2 % 22 % 0 % 18 % 13 %
Muscle tenderness pectoralis minor right
Tenderness 23 % 76 % 3 % 60 % 73 %
Pain 1 % 9 % 0 % 15 % 12 %
Muscle tenderness intercostal 2/3 right
Tenderness 13 % 48 % 0 % 76 % 54 %
Table 2Results of the single-stage clustering of chest pain data(Continued)
Muscle tenderness intercostal 3/4 right
Tenderness 10 % 25 % 1 % 81 % 25 %
Pain 1 % 0 % 0 % 5 % 2 %
Muscle tenderness intercostal 4/5 right
Tenderness 12 % 9 % 0 % 88 % 5 %
Pain 0 % 0 % 0 % 7 % 0 %
Muscle tenderness intercostal 5/6 right
Tenderness 14 % 4 % 0 % 82 % 0 %
Pain 0 % 0 % 0 % 10 % 0 %
Muscle tenderness intercostal 6/7 right
Tenderness 8 % 2 % 0 % 79 % 0 %
Pain 1 % 0 % 0 % 10 % 0 %
Tenderness c4/5 paraspinal posterior
Yes 10 % 5 % 2 % 27 % 3 %
Tenderness c5/6 paraspinal posterior
Yes 16 % 8 % 4 % 26 % 3 %
Tenderness c6/7 paraspinal posterior
Yes 14 % 5 % 3 % 17 % 3 %
Tenderness c7/ th1 paraspinal posterior
Yes 7 % 11 % 1 % 18 % 10 %
Tenderness th1/ 2 paraspinal posterior
Yes 14 % 27 % 3 % 29 % 38 %
Tenderness th2/ 3 paraspinal posterior
Yes 29 % 50 % 5 % 50 % 64 %
Tenderness th3/ 4 paraspinal posterior
Yes 37 % 46 % 3 % 58 % 47 %
Tenderness th4/ 5 paraspinal posterior
Yes 45 % 24 % 3 % 56 % 29 %
Tenderness th5/ 6 paraspinal posterior
Yes 46 % 9 % 2 % 45 % 13 %
Tenderness th6/ 7 paraspinal posterior
Yes 42 % 2 % 1 % 40 % 5 %
Tenderness th7/ 8 paraspinal posterior
Yes 27 % 1 % 1 % 36 % 3 %
Tenderness th8/ 9 paraspinal posterior
Yes 16 % 1 % 0 % 22 % 3 %
Posterior vertebral springing th1/2
Yes 7 % 4 % 0 % 5 % 12 %
Posterior vertebral springing th2/3
two subgroups described by the two-stage approach approximated classic textbook descriptions of the com-mon diagnostic criteria for musculoskeletal chest pain (cluster 1) and atypical angina chest pain (cluster 2), and suggest that our suspicion that these data contained two subgroups may have been correct. An advantage of this approach was that two fairly distinct groups emerged that could be conceptualised as representing two different conditions. In addition, these two data-driven subgroups also differed quite markedly on pa-tient beliefs about the anatomical cause of their condi-tion. Such an additional finding could motivate a new view on these classic descriptions.
In comparison, the five subgroups described by the single-stage approach displayed less distinct differ-ences. However, our overall subjective impression was that these five subgroups might also be clinically rec-ognisable, as non-specific chest pain is a very complex complaint caused by a range of life-threatening and non-life threatening conditions. A high level of com-plexity in symptom presentation is in good concord-ance with our clinical experience that chest pain episodes are often multi-dimensional experiences ac-companied by strong emotional response, that are not very well described by only the commonly defined text-book categories.
The cross-tabulation of the cluster membership between the five subgroups from single-stage clustering and the two subgroups from two-stage clustering showed evidence that both approaches seemed to reflect a similar latent data structure. However, as the single-stage clustering approach models the latent data struc-ture of the whole data and the two-stage approach initially models the latent data structure within each
domain, differences in subgroup membership across these approaches are to be expected. It should be recog-nised that the two-stage approach is not intended to find the identical cluster structure, but is a way to explore an alternative cluster structure. It is possible that the novel approach that we have presented may, in some circum-stances, not closely mimic the data structure identified with single-stage clustering, but the results may none-theless be more clinically useful. So it is important that clinical researchers who use two-stage clustering should judge, on a dataset by dataset basis, whether single or two-stage clustering provides more clinically interpretable subgroups that have better face validity and predictive validity.
Two-stage clustering is a form of variable reduction, as the second stage clustering involves fewer variables than the first stage. There are other methods available for variable reduction, such as Principal Components Analysis and Factor Analysis [27]. Those methods seek uni-dimensionality by identifying variables of the whole dataset that are highly correlated. However, many health domains are multi-dimensional and there may be clinical merit in retaining that knowledge. Therefore, LCA within health domains is not seeking uni-dimensionality but is identifying different within-domain scoring pat-terns and preserving those patpat-terns with a new synthetic domain variable. Similarly, Principal Components Analysis
and Factor Analysis are ‘variable-centered’ in that they
seek to identify highly correlated variables, whereas LCA
is ‘patient-centered’ in that it seeks to identify people
whose scoring patterns are similar. Variable reduction can also be based on content, where content experts select the variables that are the most representative for each health domain and only use those selected
Table 2Results of the single-stage clustering of chest pain data(Continued)
Posterior vertebral springing th3/4
Yes 18 % 37 % 0 % 31 % 25 %
Posterior vertebral springing th4/5
Yes 15 % 19 % 0 % 31 % 20 %
Posterior vertebral springing th5/6
Yes 19 % 6 % 0 % 16 % 10 %
Posterior vertebral springing th6/7
Yes 18 % 1 % 1 % 16 % 2 %
Posterior vertebral springing th7/8
Yes 14 % 1 % 1 % 14 % 0 %
Posterior vertebral springing th8/9
2 clusters Cluster1 Cluster2
Scoring pattern label Older Younger
Cluster Size 51 % 49 %
Cluster membership probability
Median (interquartile range)
90 % (79 % to 96 %) 93 % (78 % to 100 %)
Age (years) Mean (SD) 62.6 (5.2) 45.3 (6.3)
Gender Female 43 % 39 %
Domain: Previous history
1 cluster Previous history did not discriminate subgroups in two-stage clustering
Domain: Psychological
5 clusters Cluster1 Cluster2 Cluster3 Cluster4 Cluster5
Scoring pattern label Uncertain of cause of
pain and fearful
Believes cause from heart
Believes both from heart and musculoskeletal
Believes cause from musculoskeletal and less fearful
Believes cause from other cause and less fearful
Cluster Size 44 % 23 % 16 % 11 % 6 %
Cluster membership probability
Median (interquartile range)
100 % (92 % to 100 %) 99. % (99 % to 100 %) 100 % (100 % to 100 %) 95 % (95 % to 96 %) 77 % (77 % to 100 %)
Self-perceived‘Pain from muscle or joints’
No 10 % 100 % 0 % 0 % 75 %
Possibly 85 % 0 % 1 % 13 % 25 %
Yes 5 % 0 % 99 % 87 % 0 %
Self-perceived‘Pain from heart’
No 15 % 0 % 0 % 99 % 94 %
Possibly 83 % 1 % 1 % 1 % 6 %
Yes 3 % 99 % 99 % 0 % 0 %
Self-perceived‘Afraid’ Yes 99 % 71 % 83 % 56 % 50 %
Domain: Pain
2 clusters Cluster1 Cluster2
Scoring pattern label Crushing pain Not crushing pain
Cluster Size 77 % 23 %
Cluster membership probability, median (interquartile range)
97 % (94 % to 97 %) 99 % (96 % to 99 %)
tic
&
Manual
Therapi
es
(2015) 23:20
Page
15
of
> 1 hour 5 % 7 %
Continuous 16 % 24 %
Pain description‘crushing pain’
Yes 100 % 25 %
Pain description ‘tenderness’
Yes 3 % 3 %
Pain description‘sharp pains’
Yes 14 % 52 %
Pain description‘well defined’
Yes 3 % 6 %
Pain description‘diffuse’ Yes 6 % 5 %
Pain description‘burning’ Yes 4 % 8 %
Pain description‘tingling’ Yes 8 % 19 %
Domain: Activity limitation
3 clusters Cluster1 Cluster2 Cluster3
Scoring pattern label None or light activity
limitation
Moderate activity limitation
Severe activity limitation
Cluster Size 82 % 11 % 8 %
Cluster membership probability, median (interquartile range)
100 % (100 % to 100 %)
86 % (86 % to 86 %) 99 % (82 % to 100 %)
SF36 physical function sum-score
Mean (SD) 71.2 (7.4) 49.0 (4.6) 27.1 (6.9)
Domain: Diagnostic classification
3 clusters Cluster1 Cluster2 Cluster3
Scoring pattern label Not heart Typical angina Maybe angina
Cluster Size 37 % 35 % 28 %
Cluster membership probability
Median (interquartile range)
100 % (94 % to 100 %)
100 % (85 % to 100 %) 97 % (81 % to 100 %)
Danish Cardiologist’s Society
No angina 64 % 3 % 2 %
tic
&
Manual
Therapi
es
(2015) 23:20
Page
16
of
Uncharacteri-stic 34 % 0 % 29 %
Unstable 0 % 1 % 0 %
Canadian Cardiovascular Society
Grade 0 87 % 0 % 8 %
classification Grade 1 13 % 17 % 84 %
Grade 2 0 % 76 % 8 %
Grade 3 0 % 7 % 0 %
Domain: Palpation
6 clusters Cluster1 Cluster2 Cluster3 Cluster4 Cluster5 Cluster6
Scoring pattern label No palpation findings Local 5/6 signs and
intercostal tenderness
Local 2/3/4 signs and pectoral tenderness
Pectoral tenderness Paraspinal and pectoral
tenderness
Generalised tenderness
Cluster Size 22 % 19 % 18 % 16 % 16 % 8 %
Cluster membership probability, median (interquartile range)
100 % (100 % to 100 %)
100 % (100 % to 100 %)
100 % (100 % to 100 %) 100 % (100 % to 100 %) 100 % (100 % to 100 %) 100 % (100 % to 100 %)
Sternoxiphoid springing tenderness
Yes 10 % 22 % 1 % 1 % 10 % 34 %
Costosternal tenderness 2/3 right
Yes 0 % 5 % 1 % 4 % 16 % 52 %
Costosternal tenderness 2/3 left
Yes 1 % 7 % 0 % 2 % 19 % 56 %
Costosternal tenderness 3/4 right
Yes 2 % 13 % 1 % 3 % 12 % 52 %
Costosternal tenderness 3/4 left
Yes 2 % 25 % 0 % 0 % 18 % 54 %
Costosternal tenderness 4/5 right
Yes 1 % 28 % 1 % 1 % 4 % 51 %
Costosternal tenderness 4/5 left
Yes 2 % 77 % 1 % 1 % 10 % 52 %
Costosternal tenderness 5/6 right
Yes 1 % 27 % 1 % 1 % 0 % 51 %
Costosternal tenderness 5/6 left
Yes 3 % 55 % 0 % 0 % 6 % 51 %
sternoxiphoid springing pain
Yes 4 % 3 % 0 % 0 % 4 % 4 %
Costosternal springing pain 2/3 right
Yes 0 % 0 % 0 % 4 % 1 % 8 %
tic
&
Manual
Therapi
es
(2015) 23:20
Page
17
of
Costosternal springing pain 3/4 right
Yes 0 % 2 % 1 % 2 % 2 % 10 %
Costosternal springing pain 3/4 left
Yes 1 % 7 % 0 % 0 % 5 % 10 %
Costosternal springing pain 4/5 right
Yes 0 % 8 % 1 % 0 % 1 % 6 %
Costosternal springing pain 4/5 left
Yes 1 % 36 % 0 % 0 % 0 % 4 %
Costosternal springing pain 5/6 right
Yes 0 % 9 % 0 % 0 % 0 % 4 %
Costosternal springing pain 5/6 left
Yes 0 % 29 % 0 % 1 % 2 % 6 %
Muscle tenderness pectoralis major left
Tenderness 1 % 19 % 78 % 62 % 38 % 54 %
Pain 0 % 3 % 20 % 28 % 4 % 24 %
Muscle tenderness pectoralis minor left
Tenderness 2 % 31 % 83 % 75 % 40 % 66 %
Pain 0 % 6 % 13 % 8 % 4 % 20 %
Muscle tenderness intercostal 2/3 left
Tenderness 1 % 6 % 58 % 42 % 24 % 84 %
Pain 1 % 0 % 3 % 1 % 0 % 12 %
Muscle tenderness intercostal 3/4 left
Tenderness 1 % 20 % 36 % 20 % 18 % 90 %
Pain 1 % 2 % 0 % 0 % 1 % 8 %
Muscle tenderness intercostal 4/5 left
Tenderness 3 % 46 % 12 % 10 % 5 % 91 %
Pain 1 % 15 % 0 % 1 % 1 % 6 %
Muscle tenderness intercostal 5/6 left
Tenderness 2 % 57 % 5 % 3 % 4 % 89 %
Pain 0 % 21 % 0 % 0 % 0 % 6 %
Muscle tenderness intercostal 6/7 left
Tenderness 1 % 42 % 1 % 1 % 0 % 82 %
Pain 0 % 14 % 0 % 1 % 1 % 8 %
Muscle tenderness pectoralis major right
Tenderness 0 % 16 % 75 % 74 % 28 % 56 %
Pain 0 % 0 % 21 % 16 % 4 % 24 %
tic
&
Manual
Therapi
es
(2015) 23:20
Page
18
of
Pain 0 % 0 % 11 % 7 % 1 % 20 %
Muscle tenderness intercostal 2/3 right
Tenderness 0 % 9 % 59 % 38 % 16 % 90 %
Pain 0 % 1 % 0 % 1 % 1 % 8 %
Muscle tenderness intercostal 3/4 right
Tenderness 1 % 15 % 32 % 15 % 9 % 90 %
Pain 0 % 0 % 0 % 1 % 1 % 6 %
Muscle tenderness intercostal 4/5 right
Tenderness 0 % 27 % 10 % 4 % 4 % 90 %
Pain 0 % 2 % 0 % 0 % 0 % 4 %
Muscle tenderness intercostal 5/6 right
Tenderness 0 % 30 % 3 % 1 % 0 % 89 %
Pain 0 % 4 % 0 % 0 % 0 % 4 %
Muscle tenderness intercostal 6/7 right
Tenderness 0 % 17 % 2 % 2 % 0 % 84 %
Pain 0 % 5 % 0 % 0 % 0 % 4 %
Tenderness c4/5 paraspinal posterior
Yes 3 % 6 % 6 % 1 % 17 % 27 %
Tenderness c5/6 paraspinal posterior
Yes 4 % 13 % 11 % 3 % 20 % 26 %
Tenderness c6/7 paraspinal posterior
Yes 3 % 13 % 8 % 3 % 12 % 19 %
Tenderness c7/th1 paraspinal posterior
Yes 1 % 8 % 18 % 0 % 9 % 21 %
Tenderness th1/2 paraspinal posterior
Yes 2 % 14 % 50 % 0 % 20 % 31 %
Tenderness th2/3 paraspinal posterior
Yes 3 % 27 % 89 % 0 % 46 % 51 %
Tenderness th3/4 paraspinal posterior
Yes 1 % 33 % 78 % 0 % 54 % 61 %
Tenderness th4/5 paraspinal posterior
Yes 1 % 38 % 40 % 1 % 59 % 59 %
Tenderness th5/6 paraspinal posterior
Yes 1 % 45 % 13 % 0 % 53 % 41 %
Tenderness th6/7 paraspinal posterior
Yes 1 % 43 % 1 % 0 % 45 % 35 %
tic
&
Manual
Therapi
es
(2015) 23:20
Page
19
of
Tenderness th8/9 paraspinal posterior
Yes 2 % 12 % 0 % 0 % 17 % 25 %
Posterior vertebral springing th1/2
Yes 0 % 8 % 10 % 2 % 4 % 2 %
Posterior vertebral springing th2/3
Yes 1 % 7 % 41 % 11 % 18 % 17 %
Posterior vertebral springing th3/4
Yes 0 % 21 % 51 % 11 % 21 % 26 %
Posterior vertebral springing th4/5
Yes 0 % 15 % 31 % 5 % 18 % 28 %
Posterior vertebral springing th5/6
Yes 0 % 14 % 12 % 0 % 24 % 17 %
Posterior vertebral springing th6/7
Yes 1 % 19 % 2 % 0 % 19 % 11 %
Posterior vertebral springing th7/8
Yes 2 % 12 % 1 % 2 % 14 % 11 %
Posterior vertebral springing th8/9
Yes 5 % 9 % 1 % 0 % 10 % 19 %
tic
&
Manual
Therapi
es
(2015) 23:20
Page
20
of
variables in single-stage clustering. However, clustering approaches are often applied when there is inadequate prior knowledge about which measurements would best inform subgroup formation.
Conclusions
In conclusion, we have suggested a new approach to using statistical clustering techniques to identify clinically useful subgroups of patients. Research designs, statistical methods and outcome metrics suitable for performing that testing have also been described. While the paper il-lustrates this approach using a practical example of (chest
pain) baseline data, due to limitations in the data, it does
not extend that analysis into testing the example’s clinical
importance or implications for prognosis and treatment. We are undertaking such analysis on data from primary and secondary care patients with low back pain, and the results will be comprehensively reported in subsequent papers. This novel statistical approach has a number of potential benefits but requires broad testing, in multiple patient samples, to determine if it is useful. That is likely to be context-specific, depending on the characteristics of the available data and the research question being asked of it.
Table 4Results of the second stage of two-stage clustering (described using the prevalence of first stage cluster membership)
Domain Cluster 1 Cluster 2
Subgroup label Uncertain of cause and fearful,
but not heart-related - with local thoracic 5/6 palpation findings.
Believes pain to be heart- or musculoskelet-al-related with crushing pain, and local thoracic 2/3 signs and pectoral tenderness.
Cluster size 51 % 49 %
Cluster membership probability
Median (interquartile range) 100 % (99 % to 100 %) 100 % (98 % to 100 %)
Demographic Younger 42 %* 62 %
Older 58 % 38 %
Previous history 0 % 0 %
Only one cluster 100 % 100 %
Psychological Uncertain of cause of pain and fearful 88 % 2 %
Believes cause from heart 1 % 44 %
Believes both from heart and musculoskeletal 0 % 31 %
Believes cause from musculoskeletal and less fearful
6 % 14 %
Believes cause from other cause and less fearful
5 % 8 %
Pain Crushing pain 74 % 89 %
Not crushing pain 26 % 11 %
Activity limitation None or light activity limitation 88 % 76 %
Moderate activity limitation 8 % 13 %
Severe activity limitation 4 % 11 %
Diagnosticclassification Not heart 71 % 1 %
Typical angina 13 % 61 %
Maybe angina 16 % 38 %
Palpation No palpation findings 23 % 23 %
Local 5/6 signs and intercostal tenderness 36 % 1 %
Local 2/3/4 signs and pectoral tenderness 4 % 32 %
Pectoral tenderness 3 % 30 %
Paraspinal and pectoral tenderness 23 % 8 %
Generalised tenderness 11 % 6 %
Table 5Results of the second stage of two-stage clustering (described in the measurement units of the original variables)
Response option Cluster1 Cluster2
Subgroup label Uncertain of cause and fearful,
but not heart-related - with local thoracic 5/6 palpation findings.
Believes pain to be heart- or musculoskelet-al-related with crushing pain, and local thoracic 2/3 signs and pectoral tenderness.
Demographic domain
Age Mean (SD) 52.2 (11.0) 56.5 (9.2)
Gender Female 44 % 39 %
Previous history domain
Cardiovascular risk factor Index Mean (SD) 1.9 (1.1) 22.2 (1.1)
Psychological domain
Self-perceived‘Pain from muscle or joints’ Possibly 79 % 1 %
Yes 9 % 46 %
Self-perceived‘Pain from heart’ Possibly 73 % 1 %
Yes 3 % 76 %
Self-perceived‘Afraid’ Yes 94 % 71 %
Pain domain
Episode duration <10 min 34 % 57 %
10 min-1 hour 24 % 20 %
>1 hour 5 % 6 %
Continuous 37 % 17 %
Pain description‘crushing pain’ Yes 76 % 90 %
Pain description‘tenderness’ Yes 0 % 6 %
Pain description‘sharp pains’ Yes 25 % 20 %
Pain description‘well defined’ Yes 3 % 4 %
Pain description‘diffuse’ Yes 2 % 8 %
Pain description‘burning’ Yes 6 % 5 %
Pain description‘tingling’ Yes 7 % 13 %
Activity limitation domain
SF36 physical function sum-score Mean (SD) 67.8 (SD 13.4) 61.5 (SD 16.1)
Diagnostic classification domain
Danish Cardiologist’s Society No angina 49 % 0 %
classification‘angina’ Typical 9 % 56 %
Atypical 14 % 30 %
Uncharacteristic 28 % 14 %
Unstable 0 % 0 %
Canadian Cardiovascular Society Grade 0 67 % 1 %
classification Grade 1 21 % 47 %
Grade 2 11 % 46 %
Grade 3 0 % 5 %
Palpation domain
Sternoxiphoid springing tend Yes 21 % 2 %
Costosternal springing tenderness 2/3 right Yes 13 % 4 %
Costosternal springing tenderness 2/3 left Yes 15 % 4 %
Costosternal springing tenderness 3/4 right Yes 17 % 3 %
Table 5Results of the second stage of two-stage clustering (described in the measurement units of the original variables) (Continued)
Costosternal springing tenderness 4/5 right Yes 20 % 1 %
Costosternal springing tenderness 4/5 left Yes 40 % 2 %
Costosternal springing tenderness 5/6 right Yes 18 % 1 %
Costosternal springing tenderness 5/6 left Yes 32 % 1 %
sternoxiphoid springing pain Yes 5 % 0 %
Costosternal springing pain 2/3 right Yes 2 % 1 %
Costosternal springing pain 2/3 left Yes 3 % 1 %
Costosternal springing pain 3/4 right Yes 3 % 1 %
Costosternal springing pain 3/4 left Yes 6 % 1 %
Costosternal springing pain 4/5 right Yes 5 % 0 %
Costosternal springing pain 4/5 left Yes 15 % 0 %
Costosternal springing pain 5/6 right Yes 4 % 0 %
Costosternal springing pain 5/6 left Yes 13 % 0 %
Muscle tenderness pectoralis major left Tenderness 23 % 54 %
Costosternal springing pain 5/6 left Pain 6 % 17 %
Muscle tenderness pectoralis minor left Tenderness 31 % 60 %
Pain 7 % 7 %
Muscle tenderness intercostal 2/3 left Tenderness 18 % 41 %
Pain 1 % 3 %
Muscle tenderness intercostal 3/4 left Tenderness 23 % 25 %
Pain 2 % 1 %
Muscle tenderness intercostal 4/5 left Tenderness 29 % 14 %
Pain 7 % 1 %
Muscle tenderness intercostal 5/6 left Tenderness 32 % 9 %
Pain 9 % 0 %
Muscle tenderness intercostal 6/7 left Tenderness 21 % 7 %
Pain 7 % 0 %
Muscle tenderness pectoralis major right Tenderness 21 % 55 %
Pain 3 % 15 %
Muscle tenderness pectoralis minor right Tenderness 25 % 54 %
Pain 2 % 8 %
Muscle tenderness intercostal 2/3 right Tenderness 18 % 39 %
Pain 2 % 1 %
Muscle tenderness intercostal 3/4 right Tenderness 17 % 23 %
Pain 1 % 0 %
Muscle tenderness intercostal 4/5 right Tenderness 20 % 11 %
Pain 1 % 0 %
Muscle tenderness intercostal 5/6 right Tenderness 21 % 7 %
Pain 2 % 0 %
Muscle tenderness intercostal 6/7 right Tenderness 16 % 6 %
Pain 2 % 0 %
Tenderness c4/5 paraspinal posterior Yes 11 % 5 %
Tenderness c5/6 paraspinal posterior Yes 16 % 6 %
Table 5Results of the second stage of two-stage clustering (described in the measurement units of the original variables) (Continued)
Tenderness c7/th1 paraspinal posterior Yes 7 % 10 %
Tenderness th1/2 paraspinal posterior Yes 14 % 22 %
Tenderness th2/3 paraspinal posterior Yes 27 % 40 %
Tenderness th3/4 paraspinal posterior Yes 32 % 36 %
Tenderness th4/5 paraspinal posterior Yes 35 % 23 %
Tenderness th5/6 paraspinal posterior Yes 35 % 11 %
Tenderness th6/7 paraspinal posterior Yes 31 % 6 %
Tenderness th7/8 paraspinal posterior Yes 22 % 4 %
Tenderness th8/9 paraspinal posterior Yes 16 % 1 %
Posterior vertebral springing th1/2 Yes 6 % 4 %
Posterior vertebral springing th2/3 Yes 9 % 21 %
Posterior vertebral springing th3/4 Yes 16 % 25 %
Posterior vertebral springing th4/5 Yes 14 % 15 %
Posterior vertebral springing th5/6 Yes 14 % 7 %
Posterior vertebral springing th6/7 Yes 14 % 3 %
Posterior vertebral springing th7/8 Yes 10 % 3 %
Posterior vertebral springing th8/9 Yes 11 % 1 %
Table 6Cross-tabulation of cluster membership
Two-stage clustering
Subgroup 1 Subgroup 2
Uncertain of cause and fearful, but not heart-related - with local thoracic 5/6 palpation findings.
Believes pain to be heart- or musculoskeletal-related with crushing pain, and local thoracic 2/3 signs and pectoral tenderness.
Single stage clustering
Subgroup 1
Low activity limitation, high fear, few palpation findings
173 13
Subgroup 2
Typical and atypical angina, short episode, pectoral tenderness
9 144
Subgroup 3
No palpation findings 64
Subgroup 4
Female, high fear, diffuse anterior tenderness
44 16
Subgroup 5
Typical angina, short episode, high activity limitation, pectoral tenderness
Competing interests
The authors declare that they have no financial or non-financial competing interests.
Authors’contributions
The concept of the paper originated from PK. All authors were involved in the design of the study, the drafting and revision of the manuscript, and gave final approval of the manuscript.
Acknowledgements
PK is partially funded, and AK, MS and HWC fully funded, by the Danish Fund for Chiropractic Research and Post-graduate Education. No funding source played any role in the scientific conduct of the study.
Author details 1
Department of Sports Science and Clinical Biomechanics, University of Southern Denmark, Campusvej 55, Odense M 5230, Denmark.2Nordic Institute of Chiropractic and Clinical Biomechanics, Odense, Denmark.
Received: 17 December 2014 Accepted: 9 June 2015
References
1. Hingorani AD, Windt DA, Riley RD, Abrams K, Moons KG, Steyerberg EW, et al. Prognosis research strategy (PROGRESS) 4: Stratified medicine research. BMJ. 2013;346, e5793.
2. Kroenke K, Harris L. Symptoms research: a fertile field. Ann Intern Med. 2001;134(9 Pt 2):801–2.
3. Amirall D, Compton SN, Gunlicks-Stoessel M, Duan N, Murphy S. Designing a pilot sequential multiple assignment randomized trial for developing an adaptive treatment strategy. Stat Med. 2012;31:1887–902.
4. Von Korff KM, Moore JC: Stepped care for back pain: activating approaches for primary care. Ann Intern Med 2001;134(9 Pt 2):911–7.
5. Hayden JA, Côté P, Steenstra IA, Bombardier C. Group ftQ-LW: Identifying phases of investigation helps planning, appraising and applying the results of explanatory prognosis studies. J Clin Epidemiol. 2008;61(6):552–60. 6. Kotsiantis S, Pintelas P: Recent Advances in Clustering: A Brief Survey, WSEAS
Transactions on Information Science and Applications 2004;1(1):73–81. 7. von Eye A, Bogat GA, Rhodes JE. Variable-oriented and person-oriented
perspectives of analysis: the example of alcohol consumption in adolescence. J Adolesc. 2006;29(6):981–1004.
8. Schellingerhout JM, Heymans MW, Verhagen AP, Lewis M, de Vet HC, Koes BW. Prognosis of patients with nonspecific neck pain: development and external validation of a prediction rule for persistence of complaints. Spine (Phila Pa 1976). 2010;35(17):E827–835.
9. Kent P, Keating JL, Leboeuf-Yde C: Research methods for subgrouping low back pain. BMC Research Methods 2010, 10:62doi:10.1186/1471-2288-10-62. 10. Beneciuk JM, Robinson ME, George SZ. Low back pain subgroups using
fear-avoidance model measures: results of a cluster analysis. Clin J Pain. 2012;28(8):658–66.
11. Westman AE, Boersma K, Leppert J, Linton SJ. Fear-avoidance beliefs, cata-strophizing, and distress: a longitudinal subgroup analysis on patients with musculoskeletal pain. Clin J Pain. 2011;27(7):567–77.
12. Hill JC, Dunn KM, Lewis M, Mullis R, Main C. J., Foster NE, Hay EM: A primary care back pain screening tool: Identifying patient subgroups for initial treatment. Arthritis Rheum. 2008;59(5):632–41.
13. Jorgensen CK, Fink P, Olesen F. Psychological distress and somatisation as prognostic factors in patients with musculoskeletal illness in general practice. Br J Gen Pract. 2000;50(456):537–41.
14. Pincus T, Burton A, Vogel S, Field A. A systematic review of psychological factors as predictors of chronicity/disability in prospective cohorts of low back pain. Spine. 2002;27(5):E109–20.
15. Tetko IV, Livingstone DJ, Luik AI. Neural network studies. 1. Comparison of overfitting and overtraining. J Chem Inf Comput Sci. 1995;35(5):826–33. 16. Collins LM, Lanza ST. Latent class and latent transition analysis for the social,
behavioral, and health sciences. New York: Wiley; 2010.
17. Beneciuk JM, Robinson ME, George SZ: Subgrouping For Patients With Low Back Pain: A Multidimensional Approach Incorporating Cluster Analysis & The STarT Back Screening Tool. J Pain 2015;16(1):19–30. doi:10.1016/ j.jpain.2014.10.004.
18. Foster NE, Hill JC, Hay EM. Subgrouping patients with low back pain in primary care: are we getting any better at it? Man Ther. 2011;16(1):3–8. 19. Fritz JM, Cleland JA, Childs JD. Subgrouping patients with low back pain:
evolution of a classification approach to physical therapy. J Orthop Sports Phys Ther. 2007;37(6):290–302.
20. World Health Organisation. International Classification of Functioning, Disability and Health. Geneva, Switzerland: World Health Organisation; 2001. 21. Takahashi O, Cook EF, Nakamura T, Saito J, Ikawa F, Fukui T. Risk stratification
for in-hospital mortality in spontaneous intracerebral haemorrhage: a Classification and Regression Tree analysis. QJM. 2006;99(11):743–50. 22. McGinn TG, Guyatt GH, Wyer PC, Naylor CD, Stiell IG, Richardson WS. Users’
guides to the medical literature: XXII: how to use articles about clinical decision rules. JAMA. 2000;284:79–84.
23. Stochkendahl MJ, Christensen HW, Vach W, Hoilund-Carlsen PF, Haghfelt T, Hartvigsen J. Diagnosis and treatment of musculoskeletal chest pain: design of a multi-purpose trial. BMC Musculoskelet Disord. 2008;9:40.
24. Stochkendahl MJ, Christensen HW, Vach W, Hoilund-Carlsen PF, Haghfelt T, Hartvigsen J. Chiropractic treatment vs self-management in patients with acute chest pain: a randomized controlled trial of patients without acute coronary syndrome. J Manipulative Physiol Ther. 2012;35(1):7–17. 25. Christensen HW, Vach W, Gichangi A, Manniche C, Haghfelt T,
Hoilund-Carlsen PF. Manual therapy for patients with stable angina pectoris: a nonrandomized open prospective trial. J Manipulative Physiol Ther. 2005;28(9):654–61.
26. Christensen HW, Vach W, Gichangi A, Manniche C, Haghfelt T, Hoilund-Carlsen PF. Cervicothoracic angina identified by case history and palpation findings in patients with stable angina pectoris. J Manipulative Physiol Ther. 2005;28(5):303–11.
27. Vigneau E, Sahmer K, Qannariand EM, Bertrand D. Clustering of variables to analyze spectral data. J Chemometrics. 2005;19:122–8.
Submit your next manuscript to BioMed Central and take full advantage of:
• Convenient online submission
• Thorough peer review
• No space constraints or color figure charges
• Immediate publication on acceptance
• Inclusion in PubMed, CAS, Scopus and Google Scholar
• Research which is freely available for redistribution